Stock Profit vs. ROI: Which Return Measure Should Investors Use?
Quick Summary
- Simple profit only shows the raw cash you win or lose on a single trade.
- ROI reveals how hard your money works by showing your exact percentage return.
- Smart investors calculate net return by adding extra payouts and subtracting trading fees.
- Comparing trade returns with time horizons gives you a clear edge in the market.
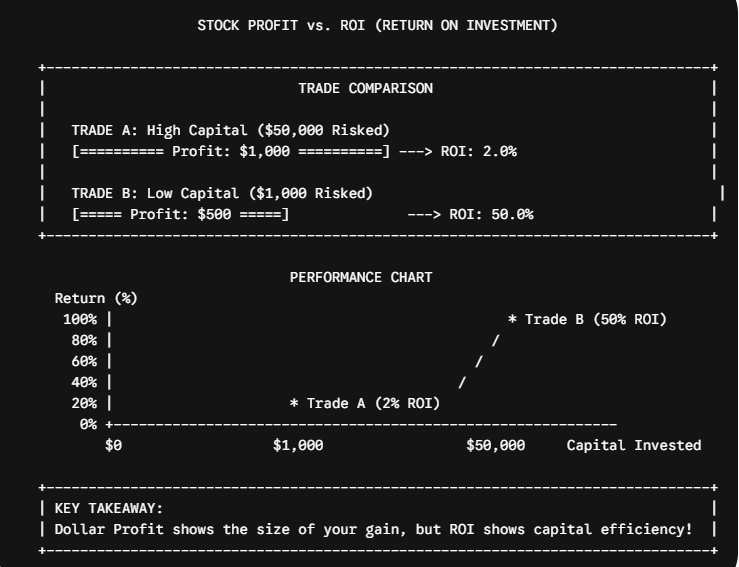
While bringing home my very first stock profit, I could not wait to celebrate. That was $1,000 on a single trade. It felt like a massive win to show off my trade report to my mentor.
He smiled, looked at my paper, and asked one simple question: "How much cash did you risk to make that $1,000?"
That single question changed how I look at money. I told him I used $50,000 of my savings to make that $1,000. He explained that my return was only 2%. Meanwhile, my friend made $500 using just $1,000 of capital. My friend gained a 50% return.
That was the day I learned that dollar profit only tells half the story. If you want to build true wealth and get a real edge in trading, you need to understand how your money works for you. You can level up your trading skills and get deep market analysis today when you join Becoin Premium.
What Is Stock Profit vs ROI?
Stock profit is the basic dollar amount you win or lose when you close a trade. You take the money you got from selling your shares and subtract what you paid for them. It is simple cash in your hand.
ROI stands for Return on Investment. It measures your efficiency. It shows the exact percentage growth of every single dollar you put into the market.
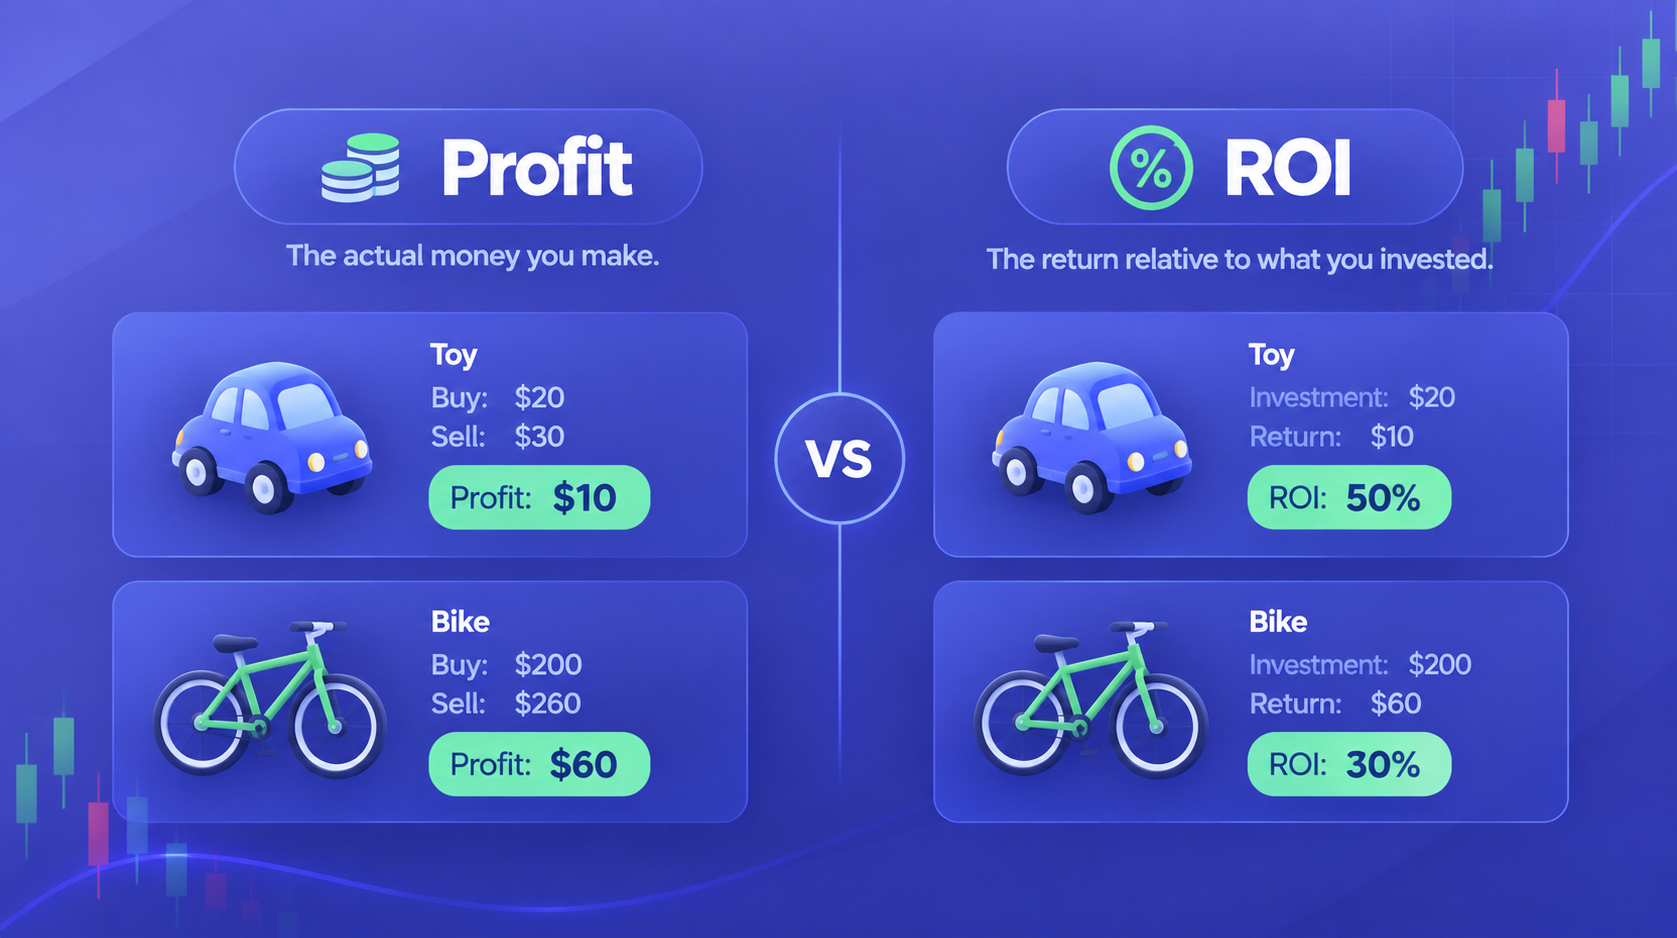
Think of it like buying items at a store. If you buy a rare toy for $20 and sell it for $30, you made a $10 profit. That is a 50% ROI. If you buy a bike for $200 and sell it for $260, you made a $60 profit. That gives you a 30% ROI. While the bike brought in more dollar profit, the toy yielded a higher return on investment relative to its starting cost.
How to Calculate Your Stock Returns
Calculating your return is very easy when you break it down into small steps.
The Basic Formula
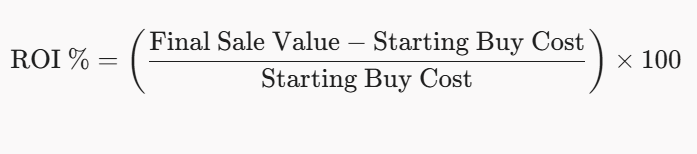
First, find your profit by taking your final sale value and subtracting your buy price. Then divide that profit by your starting cost. Finally, multiply by 100 to get your percentage.
A Simple Stock Example
Imagine I buy 10 shares of a company at $100 per share.
- My starting cost is $1,000.
- Six months later, the price goes up to $120 per share.
- I sold my 10 shares for $1,200.
- My dollar profit is $200.
- My ROI calculation is ($200 divided by $1,000) multiplied by 100, which gives me 20%.
To find your true net ROI, you must also add any extra earnings like company payouts and subtract trading fees or broker expenses.

If I got $20 in payouts but paid $5 in trading fees, my real profit becomes $215. That bumps my net ROI up to 21.5%.
What Makes a Stock Return Good?
A good return depends on how long you hold your stock and how much risk you take.
Making a 15% return in one single week is amazing. But making a 15% return over ten long years is very slow. It might not even beat the rising prices of everyday goods at the store.
Always compare your personal returns against the big market averages, like the main index of top company stocks.
Academic research shows that tracking these return ratios helps investors make better decisions. A study on The Effect of Profitability (Return on Investment) and Financial Risk Against Stock Price confirms that ROI directly impacts share prices and overall market growth over time.
When practicing quick entry signals across different markets, testing setups on interactive charting platforms can help refine timing and risk management strategies.
Comparing Important Financial Measures
Different metrics help answer different questions about your trade setups.
| Metric Name | What It Measures | Best Used For |
|---|---|---|
| Dollar Profit | Raw cash won or lost | Checking your bank total |
| Simple ROI | Percentage growth on capital | Quick single trade review |
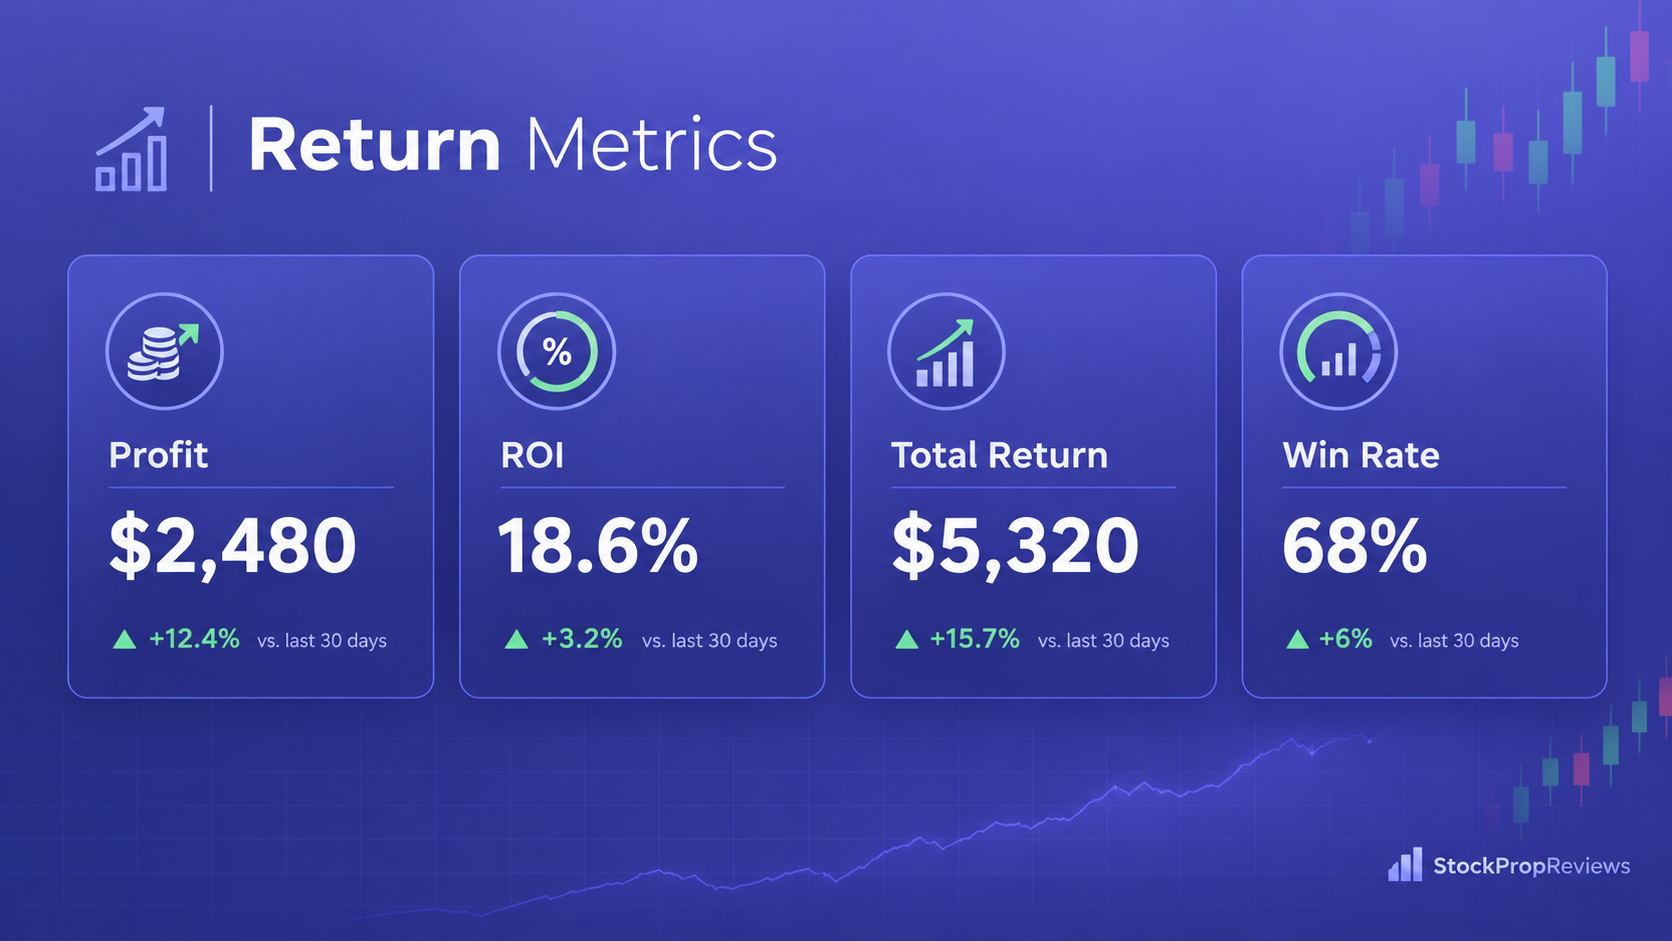
| Total Return | Price growth plus cash payouts | Long term stock holding |
| Annualized Rate | Compound growth per year | Comparing short vs long trades |
Simple ROI works great for quick single trade reviews. But when you hold stocks over several years, tracking annual growth rates gives you a much clearer picture.
Advanced Terms You Might Hear
When you dig deeper into market news, you will see other three-letter terms. Here is how they connect to your investments:
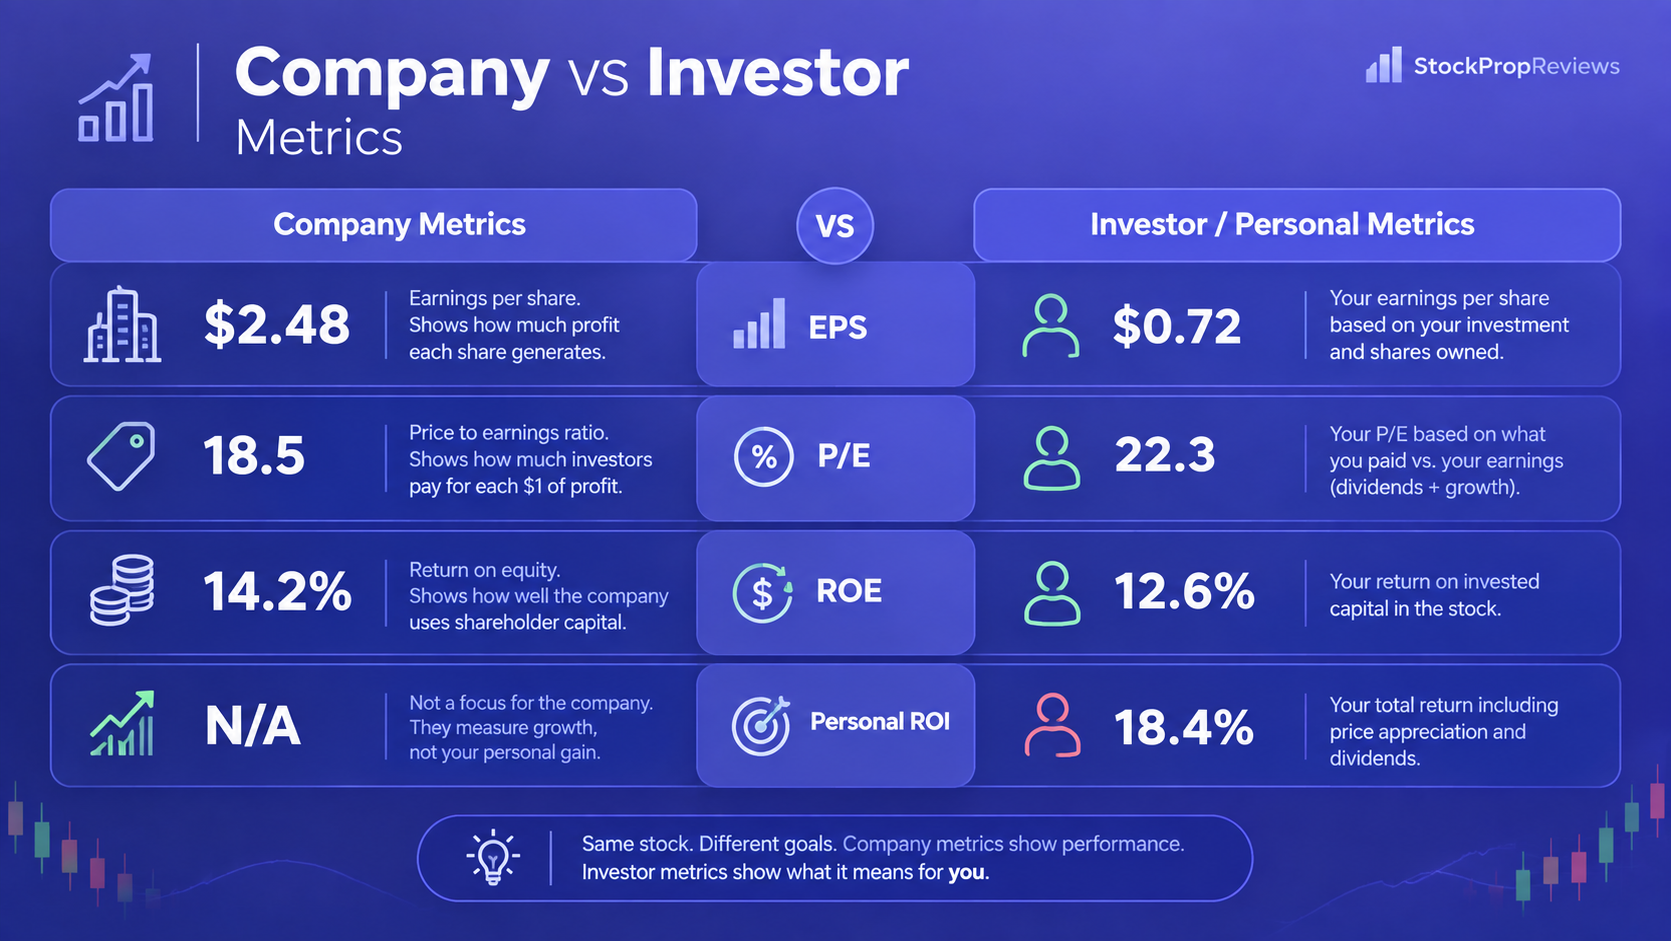
- Earnings Per Share (EPS): This shows how much profit a business earns for every share it issues. It measures company performance, while ROI measures your personal trade efficiency.
- Price to Earnings (P/E): This shows how much money buyers will pay for each dollar of company earnings.
- Return on Equity (ROE): This measures how wisely the leaders of a company use shareholder funds to grow the business.
You can also test order execution models on Olymp Trade, practice market timing on Binomo, or check risk parameters on CapitalCore.
How You Should Track Your Trades
Follow this simple 5-step checklist every time you review your stock portfolio:
- Write Down Cash Profit: Record the raw dollar change in your account.
- Calculate Your ROI: Find your basic growth percentage relative to your initial capital.
- Subtract Fees and Add Payouts: Include all broker costs and dividend rewards.
- Check Your Holding Time: See how many months or years your trade was open.
- Compare to Market Averages: See if your trade beats standard market benchmark returns.
FAQs
What is the biggest difference between profit and ROI?
Dollar profit shows the exact cash you made or lost. ROI shows the percentage efficiency of the money you risked.
Does stock ROI include extra cash payouts?
Basic ROI only measures price moves. True net return adds extra dividend payouts and subtracts trading costs.
Why is ROI better than dollar profit for comparing trades?
ROI levels the playing field. It lets you compare a small $100 trade to a big $10,000 investment fairly.
To read more trading guides, check out our helpful stop loss and breakeven on the Becoin Blog to sharpen your strategies today.
Ready to take your trading skills to the next level? Get powerful market insights, expert breakdowns, and a real advantage in the market when you join Becoin Premium!

Best Broker for Learning Price Action in 2026 (Tested by Real Traders)
Most traders think they need a better strategy. What they actually need is a better understanding of price. A few years ago, one of our community members had over ten indicators on his chart. RSI. MACD. Moving averages. Bollinger Bands. Stochastic. Every new YouTube video added another indicator. The result? More confusion. Not more profits. […]

Which Broker Has Faster Withdrawals? Real 2026 Comparison for Traders
When most beginners choose a broker, they focus on bonuses, signals, or flashy interfaces. But after trading for a while, you realize one thing matters more than almost anything else: How fast can you actually withdraw your money? A broker can look perfect until your first withdrawal request gets stuck in “processing” for three days. […]

Deriv vs IQ Option for Synthetic Indices: Which Platform Is Better in 2026?
Synthetic indices have become one of the most talked about trading categories among beginners and experienced traders alike. Unlike forex or crypto markets that depend on real world events, synthetic indices operate 24/7 using algorithm driven price movements. That means traders can access opportunities at any time without waiting for market openings or major news […]

Binomo vs IQ Option Mobile App Comparison 2026: Which Trading App Is Better for Beginners?
Mobile trading is no longer a backup option for traders. For many beginners, the smartphone app becomes the main trading workstation. Whether you are entering quick trades during a lunch break or analyzing charts late at night, the quality of a broker’s mobile app can directly impact your results. Two platforms that continue to dominate […]

Why 90% of Traders Lose Money (Real Reasons Beginners Don’t Realize)
Most Traders Don’t Lose Because of Strategy — They Lose Because of Behavior If you ask most beginners why traders fail, you’ll hear answers like: But after observing thousands of beginner trading behaviors, the truth is much simpler and more uncomfortable: “Most traders lose money because of how they behave, not what they use.” Even […]

Capital Core for US Traders: Can Americans Use It Safely?
I’ll be honest: when I first started digging into Capital Core for US traders, I wasn’t looking for hype. I was looking for a boring answer. Can I sign up from the US?Can I actually trade?And the real question nobody asks loudly enough: if I win, can I withdraw without drama? That last one matters […]