
Best Indicator Combinations for Sideways Markets
I still vividly remember the late-night trade that nearly pushed me to walk away from trading altogether. It was a cold Tuesday evening, and the chart for EUR/USD had been stuck in a narrow 30-pip range for six straight hours. I was convinced a massive breakout was imminent. Every time the price poked its head slightly above the upper resistance line, I placed aggressive buy orders. Every time it dipped back down, I panicked, flipped my bias, and opened a short position.
By midnight, I had taken five trades, suffered five consecutive losses, and watched my entire weekly profit evaporate. The most frustrating part was looking at the screen at 1 AM only to realize that the price was sitting at the exact same level where it had started the day.
Like most retail traders, I had been taught to worship trends. We are constantly reminded that the trend is your friend, but nobody adequately warns you about what happens when the market goes completely flat. Financial markets do not move in strong trends most of the time. In fact, price spends roughly 70 percent of its time consolidating, digesting news, and moving sideways in choppy horizontal channels.
When I first opened my live trading account on IQ Option, I tried applying basic trend-following tools like moving average crossovers directly into non-trending markets. The result was an endless sequence of whipsaws and false breakout signals. It took months of backtesting and painful trial and error to realize that range trading requires an entirely different mindset and a specialized combination of technical tools. You cannot rely on a single indicator to tell you the full story. To trade sideways markets profitably, you need a system that first confirms the market is actually ranging, and second, pinpoints high-probability entry points right before price reverses.
Why Single Indicators Fail in Range-Bound Conditions
Early in my trading journey, I believed I could solve my ranging market problems using just the Relative Strength Index (RSI). I reasoned that if the RSI went above 70, I should short, and if it dropped below 30, I should buy. It sounded foolishly simple.
However, during a strong breakout disguised as a temporary range, the RSI can stay overbought for hours while price continues to rocket higher against your position. Conversely, in a tight, low-volatility consolidation, the RSI might never reach extreme oversold or overbought levels at all, leaving you sitting on your hands while clean rotational moves happen right inside the boundaries.
Single indicators only give you one perspective on market dynamics. A momentum oscillator shows speed, a volatility band shows range expansion, and a trend filter shows directional strength. When you use them in isolation, you are essentially trading with one eye closed. To consistently profit when price is bouncing between support and resistance, you must stack indicators into synergistic pairs. One indicator acts as the gatekeeper, confirming that a true sideways condition exists, while the second indicator acts as the trigger, telling you precisely when to execute your trade. As I detailed in my previous guide on foundational technical analysis on Becoin Blog, proper alignment of complementary tools is what separates amateur gambling from institutional probability.
Indicator Combination 1: ADX and Bollinger Bands (The Volatility Gatekeeper)
After blowing through several demo accounts testing chaotic combinations, I stumbled upon a pair that completely transformed my daily charting routine: the Average Directional Index (ADX) combined with Bollinger Bands.
The ADX measures the strength of a trend regardless of its direction, while Bollinger Bands map out price volatility and mean reversion levels. Here is the exact framework I use on my Quotex trading chart to trade this setup:
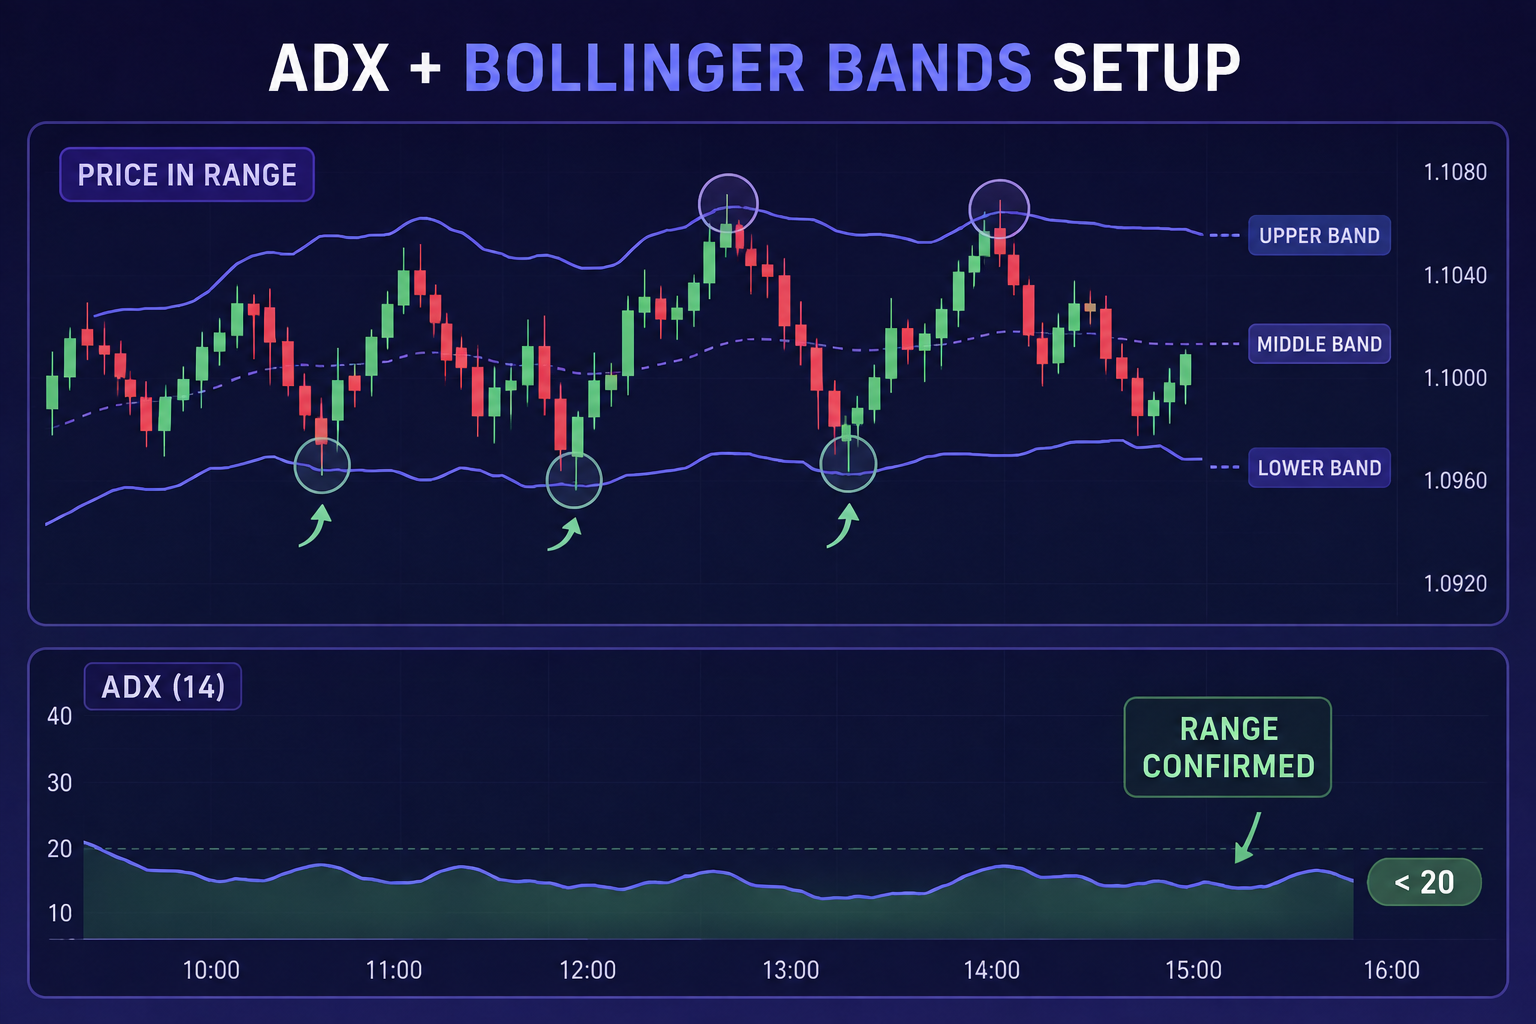
Step 1: Confirm the Range Filter (ADX)
Before looking at price action or entry triggers, I look at the ADX line set to a standard 14-period setting. If the ADX reading is above 25, a strong trend is underway, and I immediately abort all range-bound strategies. However, when the ADX drops below 20, it signals that directional momentum has completely dried up. The market is officially moving sideways, and range trading strategies are cleared for takeoff.
Step 2: Map the Dynamic Boundaries (Bollinger Bands)
With the ADX confirming a sideways regime, I turn my attention to 20-period Bollinger Bands with a 2-standard deviation setting. In a ranging environment, the upper band acts as dynamic resistance, while the lower band acts as dynamic support.
Step 3: Wait for the Mean-Reversion Trigger
I wait for price to pierce or touch the outer band while the ADX stays strictly below 20. The entry trigger occurs when a candlestick closes back inside the band structure. I open a long position at the lower band or a short position at the upper band. My first take-profit target is always the middle simple moving average line, and my second target is the opposite band boundary.
Executing this setup on fast execution platforms like Pocket Option allows me to capture quick, highly repeatable mean-reversion swings while completely avoiding the trap of chasing fake breakouts.
Indicator Combination 2: RSI and Stochastic Oscillator (The Dual-Momentum Reversal Trigger)
While Bollinger Bands excel at capturing volatility extremes, there are times when sideways ranges are uneven and price fails to reach the outer bands. For these situations, I developed a dual-momentum approach using the Relative Strength Index (14-period) alongside the Stochastic Oscillator (5, 3, 3 setting).
When analyzing sideways assets on Deriv, I treat the RSI as my macro-momentum context indicator and the Stochastic as my micro-entry trigger.
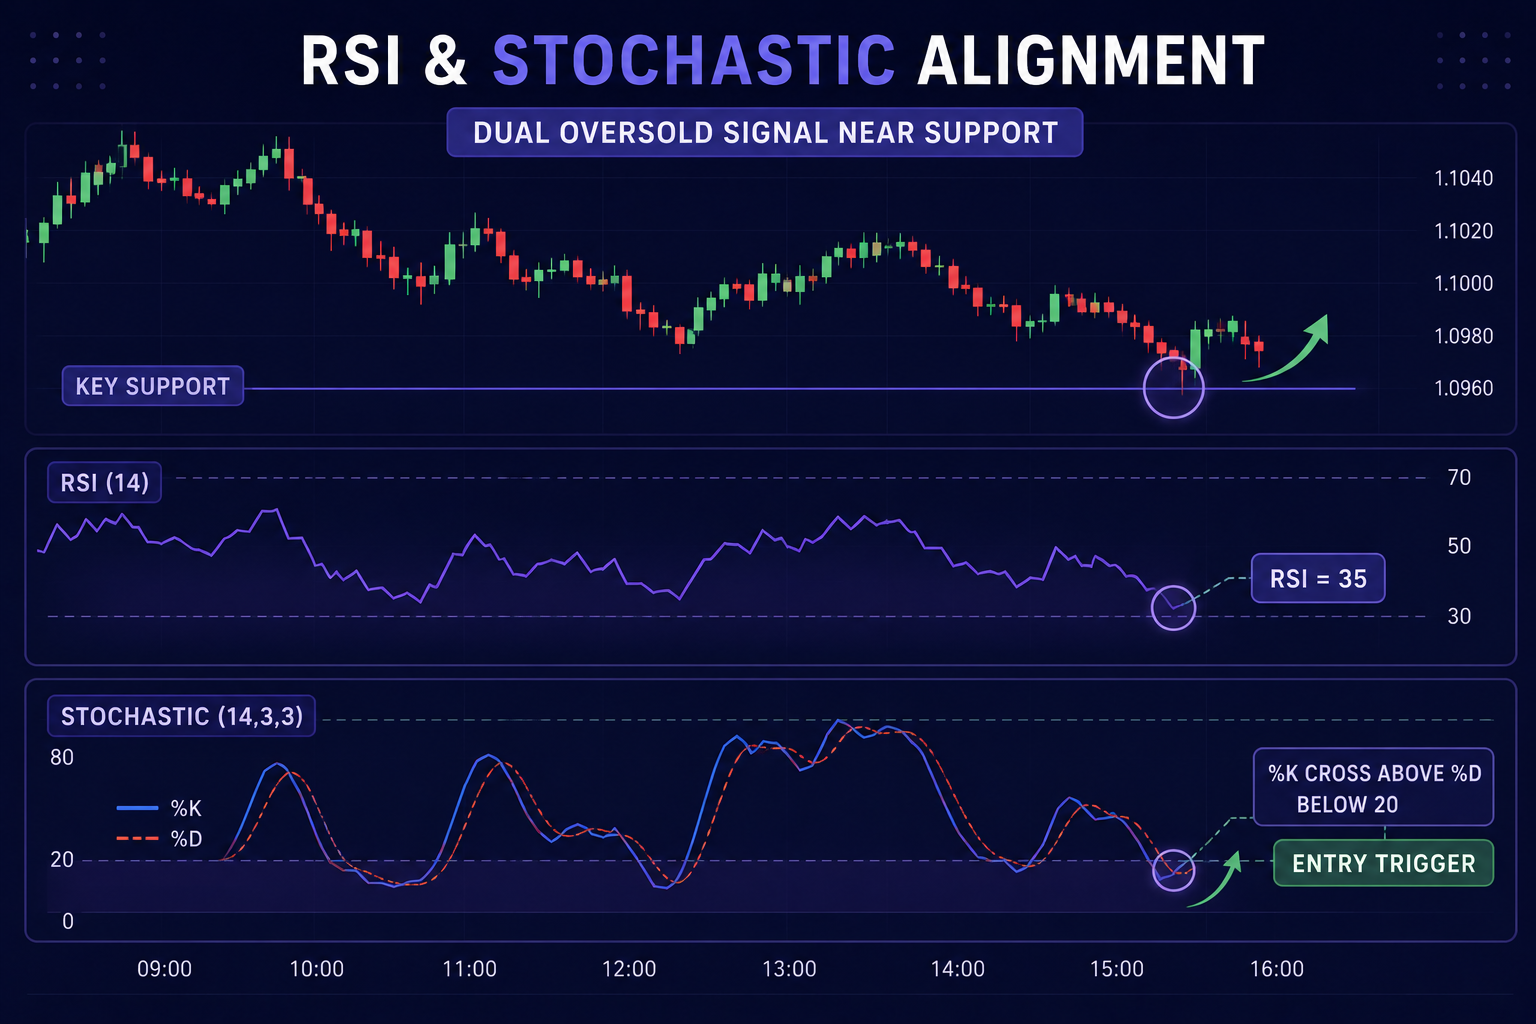
During a healthy sideways phase, the RSI usually hovers between 35 and 65, oscillating smoothly around its 50 midline. When price moves toward an established horizontal support level, I look for the RSI to dip into the 35 to 30 zone without making aggressive lower lows. This tells me selling pressure is exhausting itself into key support.
Next, I switch my eyes to the Stochastic Oscillator. Because the Stochastic is far more sensitive than the RSI, it will often enter deep oversold territory (below 20) much faster. The ideal setup occurs when:
- Price approaches known range support.
- RSI sits near 35-30, showing decelerating downside momentum.
- Stochastic fast line (%K) crosses above the slow line (%D) below the 20 level.
When all three conditions align, I enter a long position with tight risk parameters placed just below the swing low support level. This strategy provides remarkably precise timing for fast swing trades on platforms like ExpertOption, giving me exceptional risk-to-reward ratios right at the outer edges of the consolidation channel. Following disciplined risk management strategies on Becoin Blog ensures that even if a range unexpectedly breaks down, my loss remains minimal and controlled.
Indicator Combination 3: Keltner Channels and Chaikin Money Flow (The Institutional Trap Detector)
One of the most frustrating aspects of sideways markets is the liquidity sweep or false breakout. This occurs when institutional players intentionally push price past support or resistance to trigger retail stop losses before violently reversing price back into the range. To protect myself from these traps, I combine Keltner Channels with Chaikin Money Flow (CMF).
Keltner Channels use Average True Range (ATR) rather than standard deviation to construct channel envelopes. This gives them a smoother, structure-aligned channel shape. Meanwhile, Chaikin Money Flow measures institutional buying and selling volume pressure over a 20-period horizon.
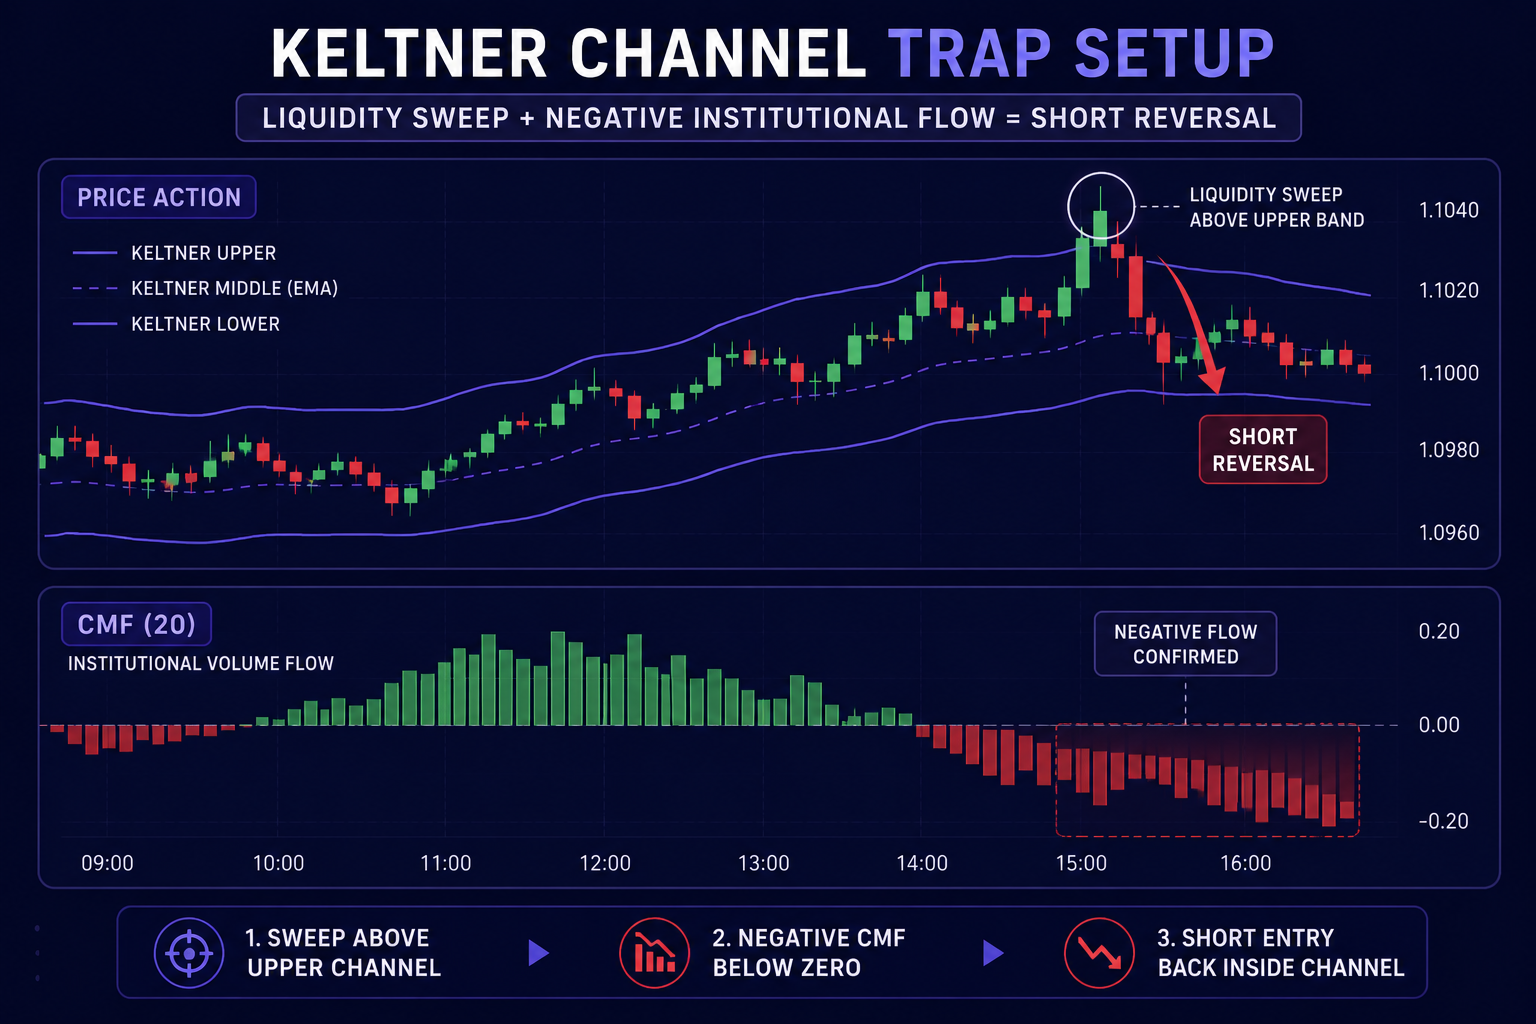
When I analyze charts on Capital Core or Olymp Trade, I look for instances where price sweeps outside the upper Keltner Channel line while Chaikin Money Flow drops below zero or displays clear bearish divergence.
If price reaches a new high above the local range but institutional money flow is negative, it indicates that smart money is using retail buying enthusiasm to unload short positions. This is a classic fakeout setup. As soon as the price candle closes back inside the upper Keltner Channel, I enter a short trade, anticipating a swift drop back toward the channel centerline.
Knowing When to Step Aside (Recognizing the Range Breakout)
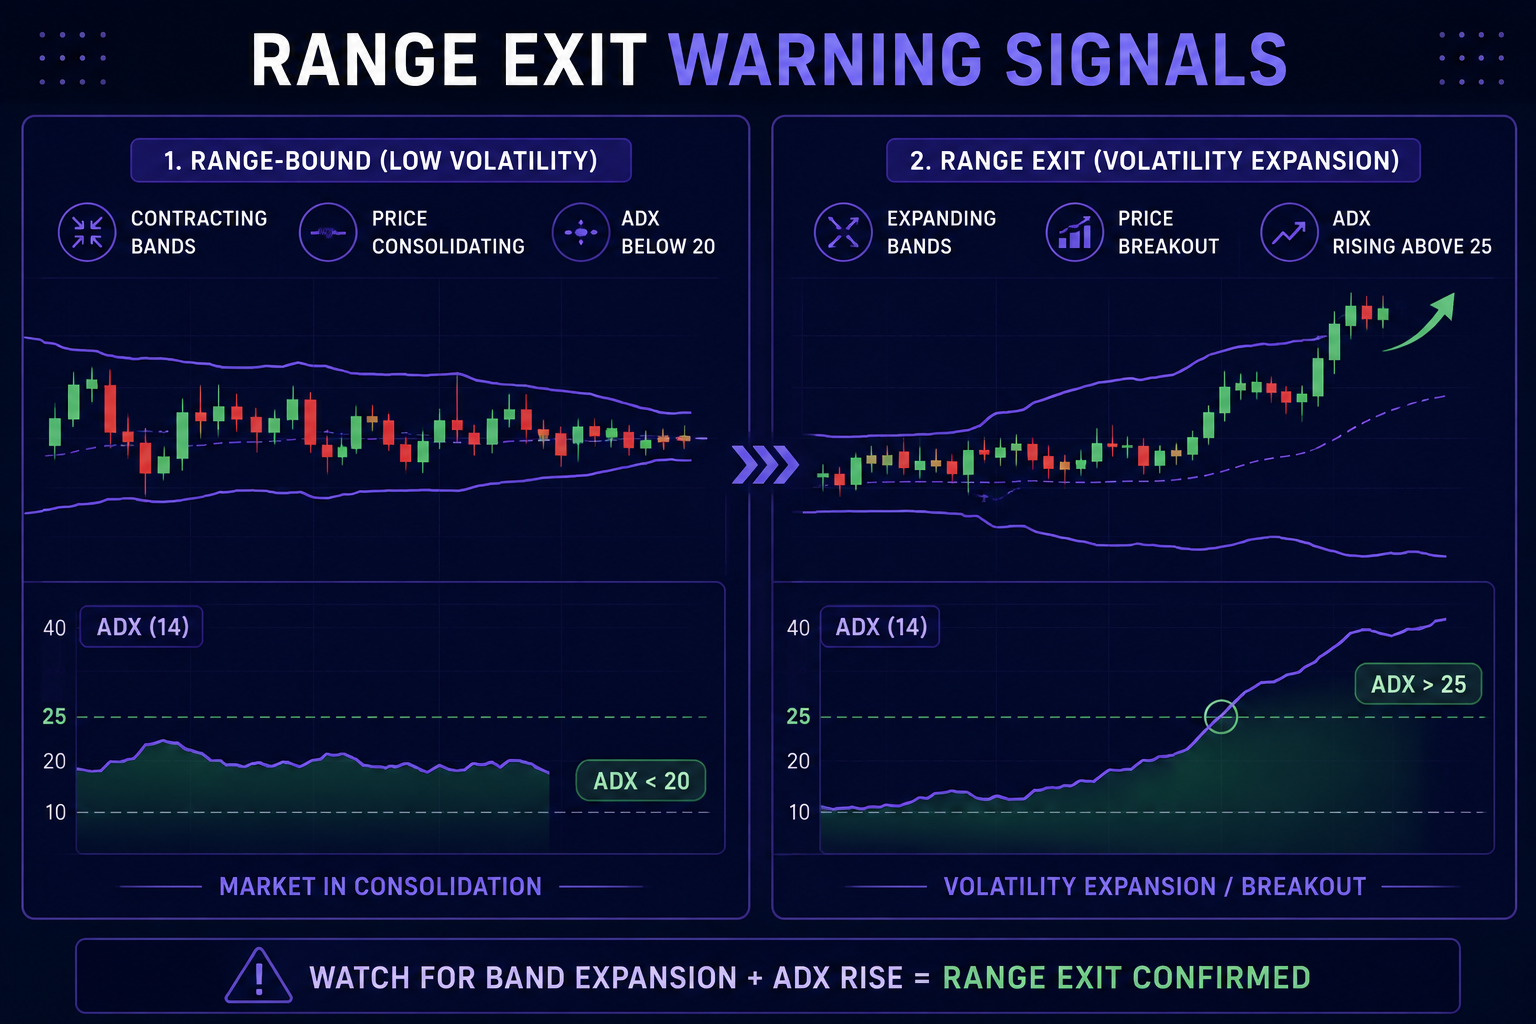
The ultimate key to surviving sideways markets long-term is knowing when the range is coming to an end. Ranging markets never last forever. Eventually, low volatility compresses price to a tipping point, leading to explosive directional breakouts.
Whenever you notice the Bollinger Bands tightening into an unusually narrow neck (known as a Bollinger Squeeze) or the ADX starting to turn upward toward the 25 mark, you must immediately stop taking range-bound mean-reversion trades. Trying to short a range when volatility is expanding is the fastest way to suffer severe drawdowns. For deeper insights on how to transition your strategy when market structure shifts, read my detailed breakdown on price action setups on Becoin Blog.
Gain an Unfair Edge in Any Market Condition
Mastering these indicator combinations transformed my personal trading from a stressful guessing game into a structured, mechanical routine. Instead of fearing sideways days, I now look forward to them as some of the most predictable trading opportunities available in the market.
However, market conditions shift rapidly across different asset classes, and manually scanning dozens of currency pairs and crypto charts for perfect indicator alignment takes hours of dedicated screen time. If you want to bypass the steep learning curve and access real-time, high-probability forecasts powered by expert analysis, visit the Becoin Forecast Hub.
For traders who are ready to elevate their performance and trade with professional precision, subscribing to the Becoin Premium Tariff Plan gives you exclusive access to daily in-depth market updates, actionable trading templates, and real-time breakout warnings before the market moves. Stop letting choppy sideways price action drain your hard-earned capital. Join Becoin Premium today, gain the analytical edge you need, and trade with absolute confidence.

Which Broker Is Better for Students in 2026?
For students, trading usually starts with one simple goal: learning how markets work without risking too much money. Most students are not starting with huge budgets. They are trading from a phone, using mobile internet, balancing studies, and trying to avoid losing money quickly. That changes what actually matters in a broker. The “best broker” […]

Biggest Beginner Mistakes That Kill Trading Accounts
Trading looks simple from the outside. Open an account, place a few trades, and grow your balance. But reality is different. Most beginners do not lose because markets are impossible. They lose because they repeat the same avoidable mistakes. A small account can survive bad market conditions. What usually kills it is poor decision-making, emotional […]
Why Most Deriv Traders Blow Accounts: A Data-Driven Post-Mortem Analysis
The first time I blew a trading account on Deriv, it didn’t happen dramatically. There was no single catastrophic trade. It happened quietly. One loss turned into another. Then I increased the stake to recover the loss. Then the market moved again. Before I realized what had happened, an account balance that took weeks to […]

How Liquidity Affects Day Trading Results
When I first started trading day trading, I believed success was all about finding the perfect indicator. I spent weeks testing moving averages, RSI settings, support and resistance levels, and dozens of YouTube strategies that promised easy wins. Some worked for a few trades, but most failed. What confused me was that the same setup […]

How I Learned to Sit on My Hands During Choppy Markets
I remember the morning vividly. It was a Tuesday. The coffee on my desk was still piping hot, the charts on my screen were blinking, and I was feeling incredibly confident. I had just finished reading about how market open hours create the best trading opportunities, and I was ready to hunt for a clean […]