
How to Measure Strategy Consistency in Trading
I still remember the late Tuesday night when I wiped out three months of market gains in less than forty-five minutes.
My chart was a sea of red candles. I sat staring at the screen, heart hammering against my ribs, trying to make sense of the damage. On paper, my trading system was supposed to be a money-printing machine. The backtests on my spreadsheets showed a 68% win rate. I had spent weeks tweaking moving average crossovers, setting rigid Fibonacci retracements, and drawing clean support zones.
Yet, there I was—watching my account balance drop from $10,000 down to a painful $1,400.
For months, I blamed everything external: market manipulation, sudden news spikes, liquidations, bad fills, and unpredictable volatility. But when I finally printed out my last 100 trade logs and laid them across my floor, the brutal truth stared right back at me.
My strategy did not fail because the markets changed. It failed because I had no quantifiable way to measure strategy consistency.
I was judging my system on feelings rather than mathematical metrics. When I won three trades in a row, I felt invincible and doubled my lot size. When I hit two losses, I panicked, abandoned my rules, and tried to revenge-trade my way back to breakeven.
That dark night became my turning point. I realized that top traders do not focus on how much money they make on a single setup. They focus on evaluating system performance through strict quantitative parameters.
If you want to escape the endless cycle of blowing accounts and changing indicators every week, you must learn how to audit your trading system scientifically.
The Dangerous Myth of Absolute Profitability
Most retail traders evaluate success using a single flawed question: "Did I end the week in profit?"
Focusing strictly on net P&L creates a dangerous illusion. You can break every risk management rule, over-leverage your account, ignore stop-losses, and still end the week in profit simply due to short-term market randomness. But that is not a strategy—that is gambling with favorable odds.
Measuring strategy consistency requires separating execution quality from trade outcome. A losing trade that strictly followed your setup rules is a successful execution. A winning trade that resulted from panicking, moving your take-profit target, or sizing up recklessly is a flawed execution.
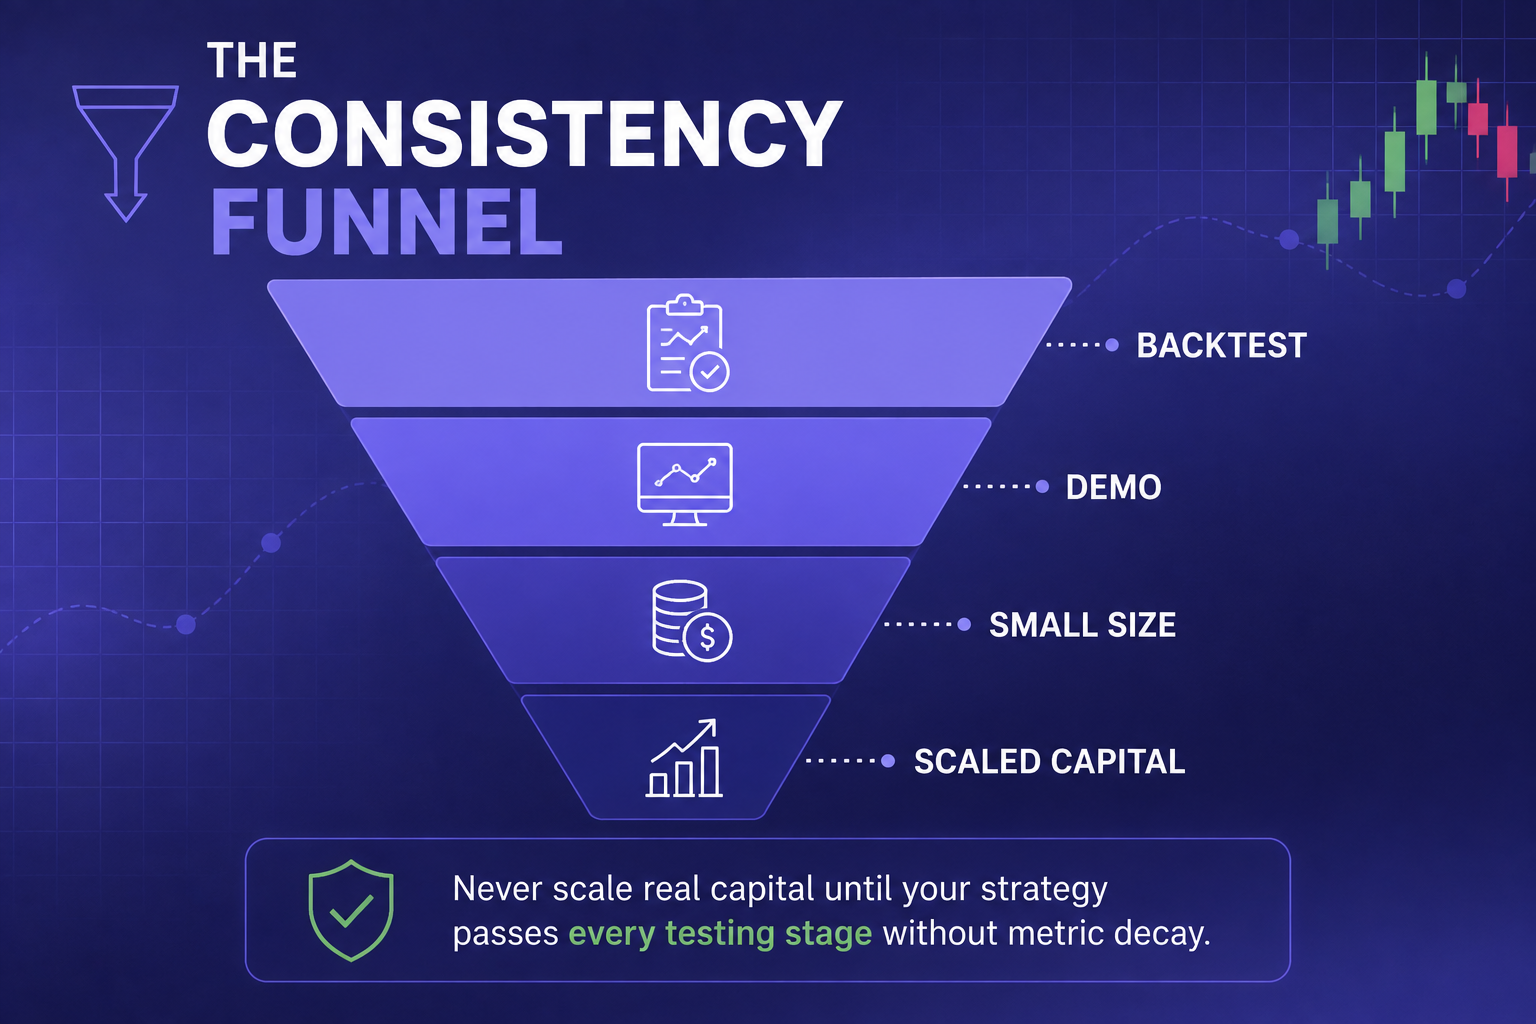
To truly understand if your trading edge holds up across different market environments, you need to measure specific variance metrics over a minimum statistical sample size of 50 to 100 trades.
If you are currently trading day trading or digital options on platforms like IQ Option or Binomo, tracking these variance metrics is even more critical. Short-duration trades carry high execution velocity, meaning a lack of discipline can drain your capital faster than traditional spot markets.
4 Core Pillars for Measuring Strategy Consistency
To determine whether your trading system is robust or merely riding a lucky streak, you must track four core performance metrics.
1. Profit Factor Stability Across Market Regimes
Profit Factor measures how much gross return your system generates for every single dollar lost.
$$\text{Profit Factor} = \frac{\text{Total Gross Profits}}{\text{Total Gross Losses}}$$
A system with a Profit Factor of 1.0 is breaking even. A sustainable system generally maintains a Profit Factor between 1.4 and 2.1 across varied conditions.
To test consistency, divide your trade log into three separate market environments:
- Trending markets (strong directional momentum)
- Ranging markets (sideways consolidation)
- High-volatility phases (news releases and market opens)
If your strategy yields a 2.5 Profit Factor in trends but drops to 0.6 in ranges, your system lacks broad market consistency. You do not need to scrap the setup entirely—you simply need to add a volatility filter or range-bound rule to shield your capital during unfavourable cycles.
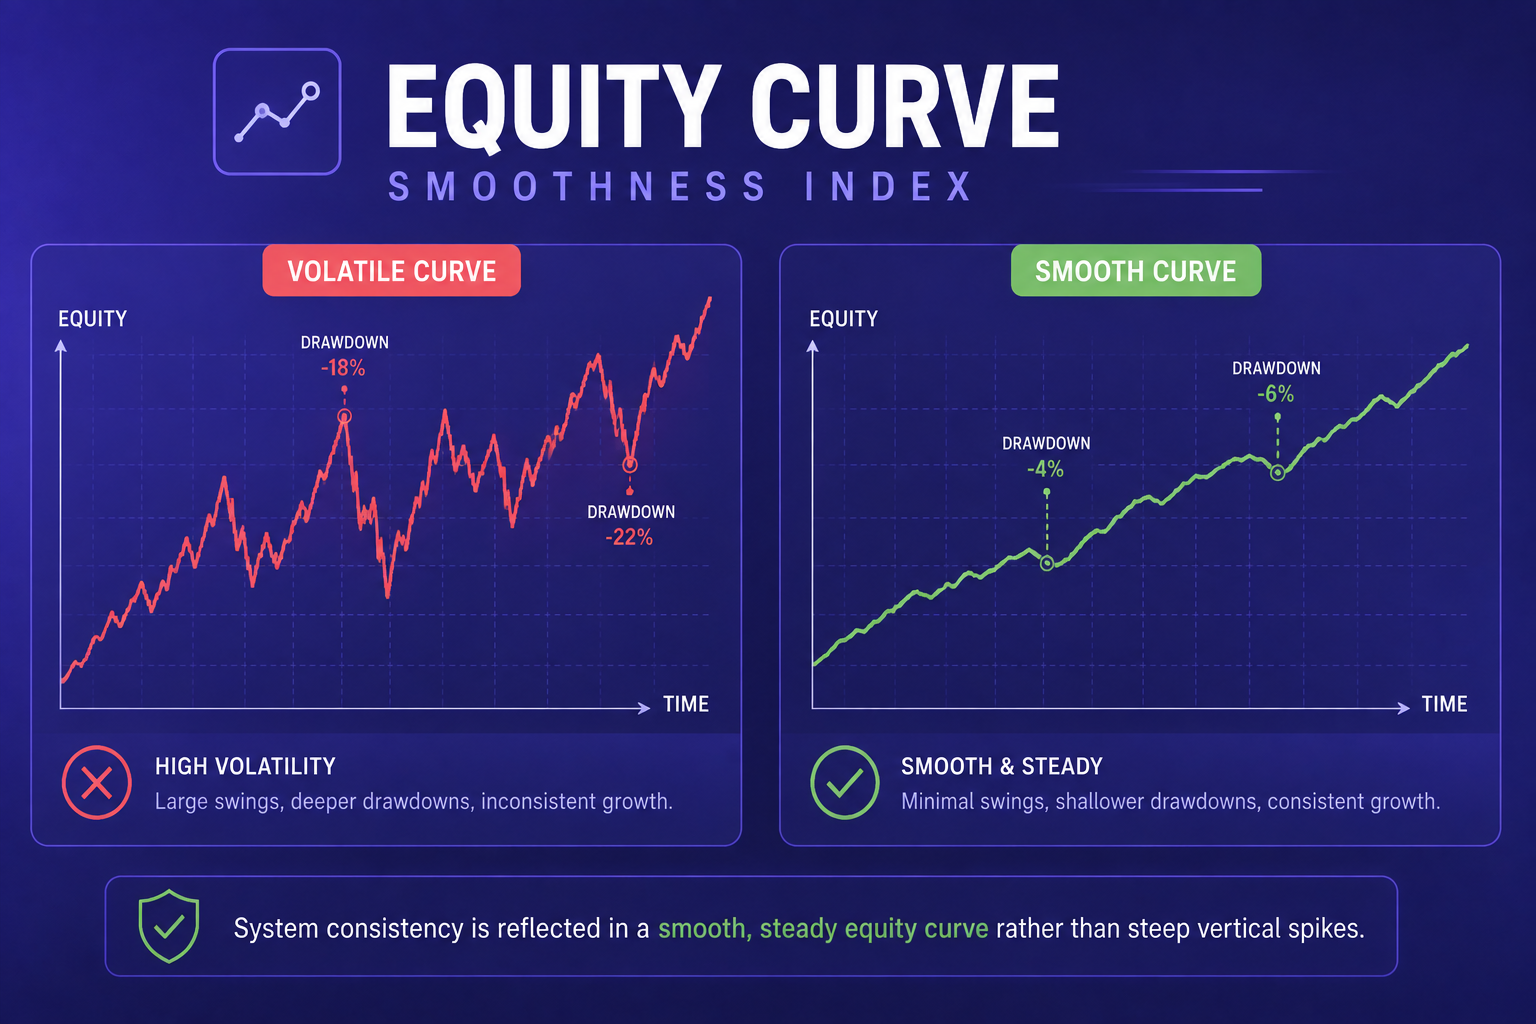
- Maximum Drawdown (DD) Variance Drawdown measures the peak-to-trough decline in your capital balance before a new peak is reached. Consistency is defined by how predictable your drawdown curve remains over time.For instance, if your historical backtests reflect a maximum drawdown of 12%, but your live execution hits an 18% drawdown, your strategy is experiencing variance decay.
$$\text{Drawdown Variance} = \text{Live Max Drawdown} - \text{Backtest Max Drawdown}$$
An acceptable divergence between historical backtesting and forward live execution is 15% to 20%. Anything beyond that signals either changing market conditions or psychological slippage in your trade execution.
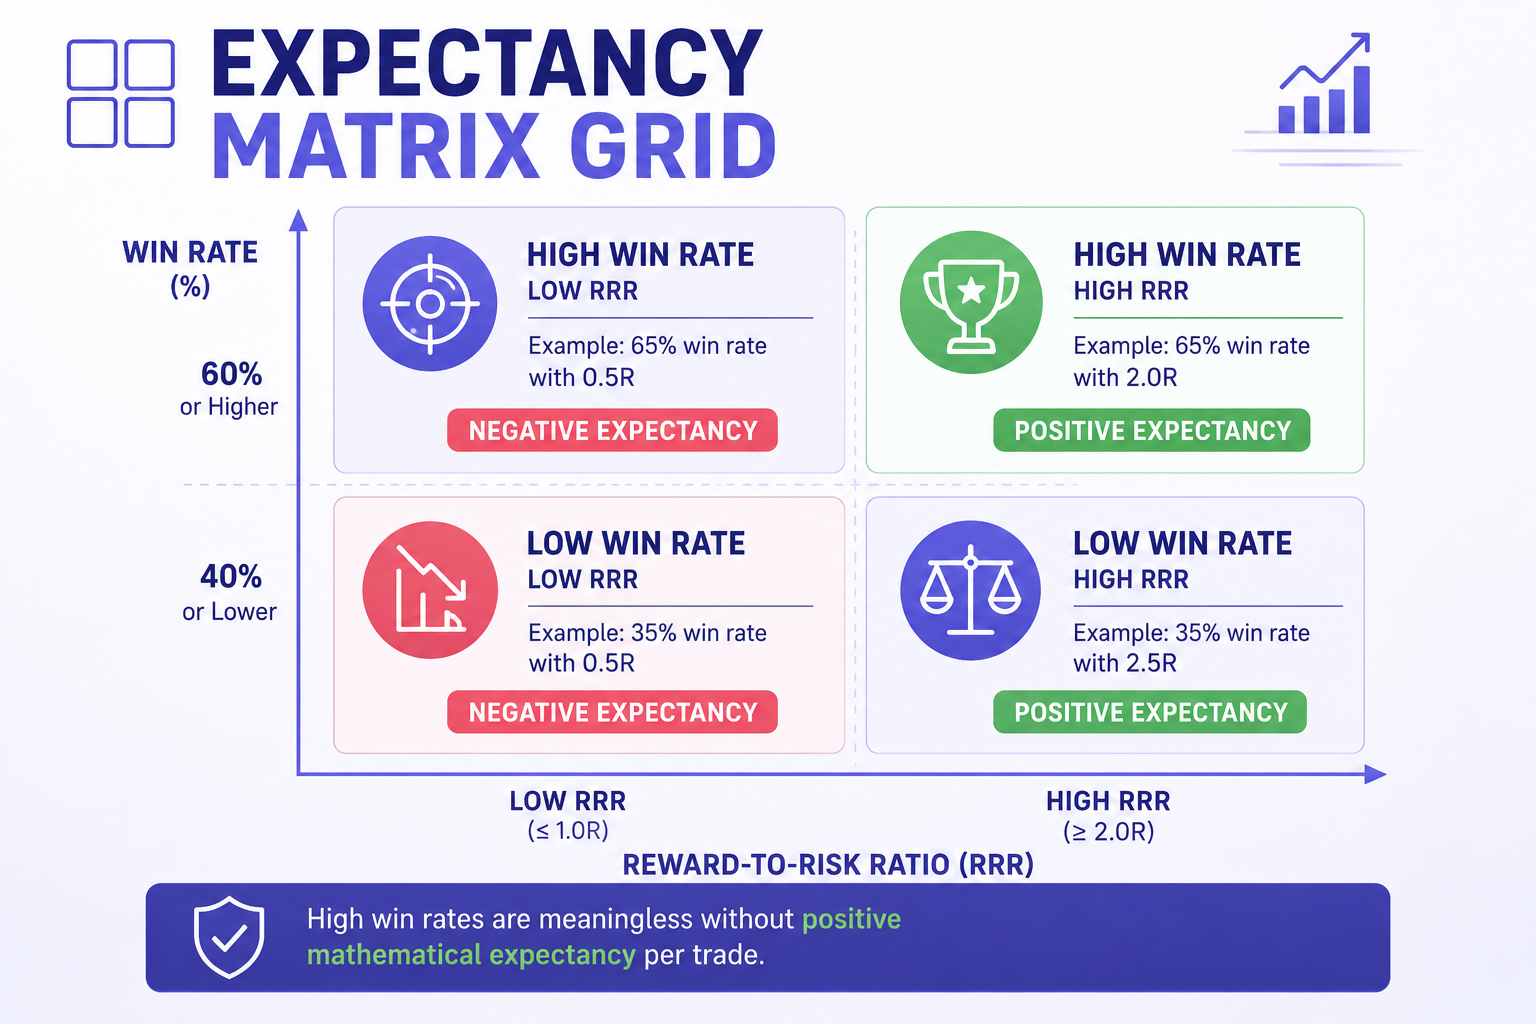
- Expectancy Quotient (R-Multiple)Winning percentage alone is a vanity metric. A trader with an 85% win rate can still go bankrupt if their average loss is ten times larger than their average win.Consistent systems rely on positive Expectancy. Expectancy calculates the average amount you expect to make per dollar risked across a long sequence of trades.
$$\text{Expectancy (R)} = (\text{Win Rate} \times \text{Average Win Size}) - (\text{Loss Rate} \times \text{Average Loss Size})$$
If your strategy averages +0.35R per trade over 100 executions, you possess a statistical edge. If your expectancy drops to negative numbers during live execution, you are over-trading or cutting your winners short out of fear.
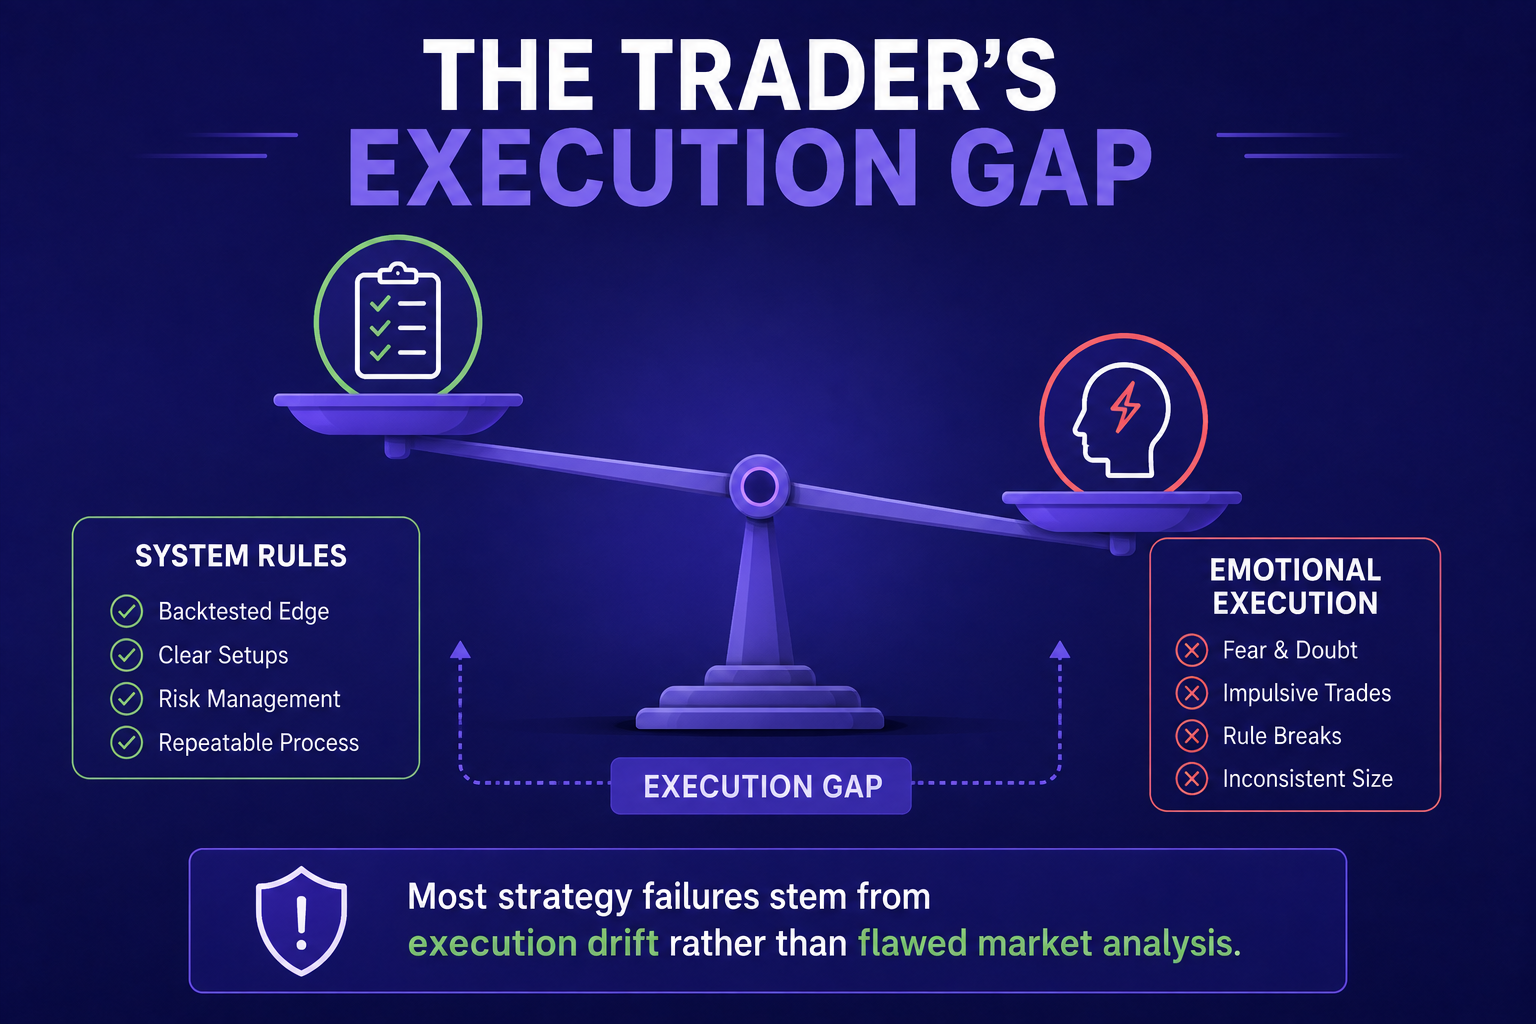
- The Execution Gap AuditThe final pillar measures the difference between your theoretical system rules and your actual trading behavior.Write down every rule for your setup: entry criteria, stop placement, position sizing, and profit targets. After every 30 trades, score yourself on compliance. If your statistical strategy is profitable on charts, but your live balance is falling, the issue isn't the setup—it is your execution discipline.
To see real-world breakdowns of how professional traders calculate expectancy and structure risk management, explore detailed research guides on the BeCoin Blog.
How to Conduct a Weekly Strategy Audit
To turn these metrics into a daily habit, establish a systematic review process at the end of every trading week.
Step 1: Export Raw Trade Logs Pull your exact trading history directly from your broker platform. Avoid manually editing entries to shield yourself from painful losses. Raw data provides honest feedback.
Step 2: Categorize Every Trade Group your trades into three simple execution buckets:
- Grade A: Followed strategy rules completely.
- Grade B: Followed setup rules, but had slight execution errors (e.g., minor slippage or late entry).
- Grade C: Emotional trades, revenge entries, or premature exits that violated your trading plan.
Step 3: Recalculate Expectancy Exclusively for Grade A Trades Calculate your Expectancy using only your Grade A executions. If your Grade A trades reflect a positive expectancy of +0.40R while your overall account balance is flat, you have clear proof that your strategy works. Your only challenge is eliminating Grade C emotional trades.
If you trade short-term digital options across fast-moving brokers like Pocket Option,Quotex, or ExpertOption, tracking execution grade is vital. High-frequency setups make it easy to drift into impulse trading without realizing it.
Eliminating Emotional Slippage in Live Trading
Once you establish a mathematical benchmark for your strategy, your primary focus shifts to protecting your discipline.
Trading discipline is not about willpower; it is about environment design. If you rely purely on self-control during live market hours, fear and greed will eventually derail your trading plan.
Here are three structural habits that eliminate emotional execution:
- Pre-Define Risk Limits: Set a daily loss limit (e.g., 3% of total equity). If you hit that limit, step away from your charts for the remainder of the day—no exceptions.
- Implement a Trade Cooldown Period: After two consecutive losses, force a 30-minute cooling-off period. This prevents immediate impulse entries designed to get money back.
- Automate Checklist Requirements: Use a written pre-trade checklist. Unless every setup parameter is checked off, you cannot click the execute button.
Trading setups on multi-asset platforms like Olymp Trade or Capital Core become significantly easier to evaluate when you reduce your strategy to clear, repeatable rules.
Stop Guessing the Markets—Build Your Advantage
When I sat on my floor years ago surrounded by loss logs, I thought I needed a complex trading indicator or an expensive secret tool to turn things around.
I was wrong.
What I actually needed was an objective framework to audit my trading strategy, control risk, and eliminate discretionary errors. Once you begin evaluating your trading system through the lens of drawdown stability, expectation metrics, and profit factor resilience, you stop reacting to market noise. You begin operating like a professional manager of probability.
If you are ready to stop guessing and want to gain an institutional-grade edge in your daily trading with deep market analytics, real-time setups, and advanced technical breakdowns, take your performance to the next level.
Check out our real-time trade signals and institutional commentary on the BeCoin Forecast Hub, or upgrade today to access our complete analytical suite by joining BeCoin Premium. Get the clarity, data, and structured edge your capital deserves.

Deriv vs Binomo Deposit Methods: My 2026 Real Money Comparison Guide
I sat in the corner of a crowded coffee shop, my eyes fixed on my phone screen. After months of testing strategies on a demo account, I had finally saved up a small pocket of risk capital. I felt ready to trade live. A high-probability setup was forming on my charts, and my heart rate […]

Can You Start Trading with $10 on Deriv?
A lot of beginners enter trading with the same question: “Is $10 actually enough to start trading on Deriv?” The short answer is yes. But the real answer is more complicated. You can start with $10 on Deriv, but whether you can survive, learn, and grow that account depends entirely on your expectations, discipline, and […]

Deriv vs IQ Option for Synthetic Indices: Which Platform Is Better in 2026?
Synthetic indices have become one of the most talked about trading categories among beginners and experienced traders alike. Unlike forex or crypto markets that depend on real world events, synthetic indices operate 24/7 using algorithm driven price movements. That means traders can access opportunities at any time without waiting for market openings or major news […]

$10 to $50 Trading Challenge – Strategy + Real Results (Case Study)
Turning $10 into $50 sounds easy until you actually try it. Small accounts expose every weakness in your trading. One bad decision can erase hours of progress, and emotional trading becomes much harder to control when every dollar matters. This case study breaks down how a $10 account was realistically grown to $50 using a […]

Binomo First $10–$50 Test Deposit Plan: The Safest Way to Validate the Platform Before Scaling
I didn’t start with confidence. I started with doubt. Every time I searched for answers about Binomo, I found opinions, not proof. Some people claimed fast withdrawals. Others complained about delays. But almost nobody showed a complete journey from deposit to withdrawal using real money. So I stopped reading and started testing. Instead of risking […]