
Best Pocket Option Indicator Settings That Actually Work in 2026
Hey there! If you’ve ever stared at the Pocket Option chart wondering what now? Trust me, you’re not alone. I’ve been there. I still remember my early trades, full of nerves and random clicks, hoping something would work. Spoiler: it didn’t.
However, once I understood how to use indicators properly, everything changed.
This guide is not your usual boring theory dump. I’ll walk you through my favorite indicators, how I use them in real trades, the exact settings that work for different strategies and I’ll also answer the questions you won’t find on Google. Ready? Let’s go.
What Are the Best Indicators for Pocket Option?
For most traders, the best Pocket Option indicators are RSI, MACD, Bollinger Bands, Stochastic Oscillator, and Moving Averages. These indicators help identify trend direction, momentum, overbought or oversold conditions, and possible reversal points. Beginners often start with RSI and EMA combinations, while advanced traders combine MACD and Bollinger Bands for stronger confirmation signals.
Why Indicators Matter on Pocket Option
Before we jump into the top indicators, let’s get one thing clear. Indicators don’t predict the market. They’re tools just like your GPS. They help you make informed decisions. Without them, you’re basically trading blind.
Ready to Try These Indicators on a Real Chart?
Open a Pocket Option account today and get a 50% deposit bonus as a new trader. It’s the perfect way to practice what you’re learning—risk-managed, with more capital to grow.
Sign up here with my bonus link and start trading smarter from day one.
On Pocket Option, where trades move fast and timing is everything, the right indicator can be the difference between a winning session and a blown account.

My Top 5 Best Indicators for Pocket Option
These are the ones that I use regularly and have tested over dozens (okay, hundreds) of trades.
1. RSI (Relative Strength Index)
RSI is like a mood detector. It tells me if the market is tired from buying or selling too much.
- How I use it:I look for RSI crossing over 70 (overbought) or under 30 (oversold). That usually hints a reversal is coming.
- My favorite setting:14-period RSI with an extra twist. I combine it with a 5-period RSI. This helps catch sharp momentum shifts for short-term trades.
- Best strategy combo:RSI + candlestick reversal patterns (like pin bars) = gold for 1–5 minute trades.
Read more about step by step using Pocket Option.
2. MACD (Moving Average Convergence Divergence)
MACD shows the tug-of-war between bulls and bears. It’s great for spotting momentum and trend changes.
- How I use it:I wait for the MACD line to cross the signal line. If it crosses from below, I prepare for a buy. If it crosses from above, I look to sell.
- My favorite setting:12, 26, 9 (classic). But for scalping? I tweak it to 5, 13, 1. It makes MACD more responsive.
- Bonus tip:If MACD crosses and RSI confirms the direction? That’s a high-conviction trade.
3. Bollinger Bands
I call these my “price cages.” They help spot volatility and breakout opportunities.
- How I use it:When the price touches the upper or lower band, I zoom in. If the candle is rejecting the band (e.g., wicks), I prepare for a reversal.
- My favorite setting:20-period with 2 standard deviations. For high-volatility assets, I adjust to 1.8.
- Secret sauce:Combine Bollinger Bands with RSI divergence. If the price hits the upper band and the RSI shows a bearish divergence? I’m in.
4. Stochastic Oscillator
It’s RSI on steroids. It’s more sensitive, which is great for quick trades.
- How I use it:When %K crosses %D in overbought/oversold areas, I jump in for 1-minute trades.
- Settings I use:5, 3, 3 works great for short-term action.
- Best combo:I use Stochastic + Support/Resistance zones. Works like magic on ranging markets.
5. Moving Averages (SMA & EMA)
These are the backbone of any trend-following system.
- How I use them:I use 50 EMA and 200 EMA for trend direction. A golden cross (50 crossing above 200) = bullish. Death cross = bearish.
- Settings I tweak for scalping:EMA 9 and EMA 21 on a 15s or 30s chart. Super sharp entries.
- Killer trick:Add a moving average cloud (like 9, 21, and 50 EMA) for clean trend visualization.
You’ve Seen the Strategies. Now It’s Your Turn.
Theory is nice, but nothing beats real practice. Use my custom indicator setups on Pocket Option and get a 50% bonus on your first deposit when you register through this link.
✅ Fast execution
✅ User-friendly charts
✅ Trusted payout system
Claim your bonus and open an account now
Best Indicator Combinations for Pocket Option
Using one indicator alone can lead to false signals. That’s why many traders combine indicators for confirmation.
RSI + Bollinger Bands
This combination works well for reversal trading. When RSI reaches overbought or oversold zones while the price touches Bollinger Bands, traders often look for candle confirmation before entering a trade.
MACD + EMA
This setup is popular for trend-following strategies. EMA helps identify the trend direction while MACD confirms momentum strength.
Stochastic + Support & Resistance
Best for ranging markets and short-term scalping. Traders wait for Stochastic crossovers near key support or resistance levels.
EMA + RSI
A beginner-friendly setup where EMA defines the trend and RSI helps avoid entering overextended moves.
Real Trade Examples: How Signals Helped Me Win
Let me walk you through a few trades where these indicators saved my skin or helped me bank some quick profits.
Trade #1: EUR/USD Reversal (RSI + Bollinger Bands)
- Timeframe: 1 minute
- Setup: RSI dropped below 30, and the price touched the lower Bollinger Band.
- Signal: RSI divergence showed price wasn’t dropping as hard.
- Entry: Bullish engulfing candle formed.
- Result: 3 ITM trades back to back.

Trade #2: Trend Following with MACD (AUD/JPY)
- Timeframe: 5 minutes
- Setup: MACD line crossed above the signal line. RSI was at 50 (neutral but rising).
- Signal: Price broke below 200 EMA.
- Entry: On pullback to 50 EMA.
- Result: 86% payout within 5 minutes.

Trade #3: Stochastic + Support Zone (GBP/USD)
- Timeframe: 30 seconds
- Setup: Price was bouncing between clear support/resistance.
- Signal: Stochastic crossed upward from oversold + support bounce.
- Entry: Instant high.
- Result: Quick win in under 1 minute.

Ideal Indicator Settings Based on Strategies
Let’s be real, there’s no “one size fits all.” So here’s what I recommend depending on how you like to trade:
| Strategy Type | Timeframe | Indicators | Settings |
| Scalping | 15s – 1 min | RSI, Stochastic, EMA | RSI (5 & 14), Stochastic (5,3,3), EMA (9 & 21) |
| Trend Following | 5–15 min | MACD, Moving Averages | MACD (12,26,9), EMA (50,200) |
| Reversal Hunting | 1–3 min | RSI, Bollinger Bands, Stochastic | RSI (14), BB (20,2), Stoch (5,3,3) |
| Range Trading | 30s – 5 min | RSI, Stochastic, S/R Zones | RSI (14), Stoch (5,3,3) |
Trade Smarter, Not Harder – with a Bonus Boost
If you’re serious about applying these setups, don’t wait. Pocket Option makes it simple to execute these trades, and when you sign up through my link, you’ll receive an exclusive 50% deposit bonus to kickstart your trading journey.
🎯 Start with proven tools.
💸 Get more from every trade.
Join Pocket Option today and get your bonus
FAQs
Can I use multiple indicators at once?
Yes, but don’t overdo it. I stick to 2–3 max. More than that, and you’ll freeze up with “analysis paralysis.”
What indicators work best for OTC trading on weekends?
OTC is tricky. I’ve found RSI and Bollinger Bands work best. Add candlestick confirmation, and you’re good.
Which indicators repaint or lag?
- RSI, MACD, and Bollinger Bands don’t repaint.
- Be cautious with some custom signals or indicators labeled “fast”. They often repaint.
Why do my trades go wrong even with correct signals?
Great question. A few reasons:
- Bad entry timing: Wait for the candle to close.
- Ignoring news: Big events can kill your setups.
- Forcing trades: Only trade when the setup screams “go.”
How do I avoid fake signals?
- Wait for confirmation from at least 2 indicators.
- Check multiple timeframes (e.g., confirm a 1-minute signal on a 5-minute chart).
- Watch volume or candle strength.
Want a Real Edge Instead of Random Trading?
Most student traders fail because they rely on random entries, copied signals, and emotional decisions.
At BeCoin Premium, the focus is different.
You get:
- In depth market analysis
- Higher quality trade setups
- Better risk management insights
- Educational guidance for long term growth
- Structured learning instead of gambling style trading
If you want to improve your trading decisions and develop real consistency, you can join BeCoin Premium here.
Common Indicator Mistakes Beginners Make
Many new Pocket Option traders lose money not because indicators fail, but because they misuse them.
Using Too Many Indicators
Adding 5–6 indicators at once creates confusion and conflicting signals. Most experienced traders use only 2–3 indicators together.
Ignoring Market Conditions
Indicators behave differently in trending and ranging markets. For example, RSI works better in sideways conditions, while EMA and MACD perform better during strong trends.
Entering Before Candle Confirmation
One of the biggest mistakes is entering too early. Waiting for the candle to close can filter many fake signals.
Trading During High-Impact News
Economic news events can invalidate technical indicators instantly due to sudden volatility spikes.
Copying Random Indicator Settings
Not all settings work for every timeframe or asset. Traders should test and adjust indicator settings based on their strategy.
Final Thoughts: Indicators Are Tools – You’re the Driver
Don’t let indicators control you. They’re your assistants, not your boss. The more you practice with them, the better you’ll feel the market rhythm.
Some days, even the best signals fail and that’s okay. Pocket Option is about precision, patience, and practice.
So next time you’re about to hit that green or red button, pause. Ask yourself:
- What’s the indicator saying?
- Is there confirmation?
- Am I chasing or am I focused?
If all boxes are ticked—pull the trigger. Trade smart, not fast.
P.S. Want me to break down more strategies or indicator combinations? I’d love to hear what you’re testing.
Happy trading!
FAQs
Which indicator is best for Pocket Option beginners?
RSI and EMA are considered the best indicators for beginners because they are simple to understand and help identify trend direction and reversal opportunities clearly.
What is the best indicator for 1-minute trading on Pocket Option?
Many scalpers use RSI, Stochastic Oscillator, and EMA combinations for 1-minute trading because these indicators react quickly to short-term price movements.
Can I use multiple indicators together?
Yes, combining indicators helps improve trade confirmation. Popular combinations include RSI + Bollinger Bands for reversals and MACD + EMA for trend-following strategies.
Do Pocket Option indicators repaint?
Most built-in indicators like RSI, MACD, EMA, and Bollinger Bands do not repaint. However, some third-party custom indicators may repaint and produce misleading signals.
Which indicator works best for OTC trading
RSI and Bollinger Bands are commonly used for OTC trading because they help identify short-term reversals and volatility changes.
Are Pocket Option signals reliable?
Signals can help identify trading opportunities, but they are not always accurate. Traders should combine signals with technical analysis and proper risk management.
What is the best RSI setting for Pocket Option?
The standard 14-period RSI works well for most strategies, while short-term traders often use RSI 5 or RSI 7 for faster signals.
How many indicators should I use at once?
Most traders use 2–3 indicators together. Using too many indicators can create confusion and conflicting signals.
Can indicators guarantee winning trades?
No indicator guarantees profits. Indicators are tools that help traders analyze market conditions, but losses are still possible.
What timeframe is best for Pocket Option indicators?
The best timeframe depends on the trading strategy. Scalpers often use 15-second to 1-minute charts, while trend traders prefer 5-minute to 15-minute charts.

Best Broker for Learning Price Action in 2026 (Tested by Real Traders)
Most traders think they need a better strategy. What they actually need is a better understanding of price. A few years ago, one of our community members had over ten indicators on his chart. RSI. MACD. Moving averages. Bollinger Bands. Stochastic. Every new YouTube video added another indicator. The result? More confusion. Not more profits. […]

Is Binomo Safe or Risky in 2026? A Practical User Checklist (Not a Generic Review)
I still remember the first time I opened Binomo. It wasn’t excitement. It was hesitation. I had already read multiple reviews. Some said it was safe. Others called it risky. None of them felt like they came from someone who had actually traded, deposited, withdrawn, and dealt with real friction. So I decided to test […]

Binomo in Pakistan / India / Bangladesh: What Payment Methods Actually Work in 2026?
When I first started testing Binomo seriously across South Asia, I made one rule for myself: I would never judge a platform by the deposit button. I would judge it by the withdrawal result. That single rule saved me a lot of frustration. A lot of articles still ranking for this topic say the same […]
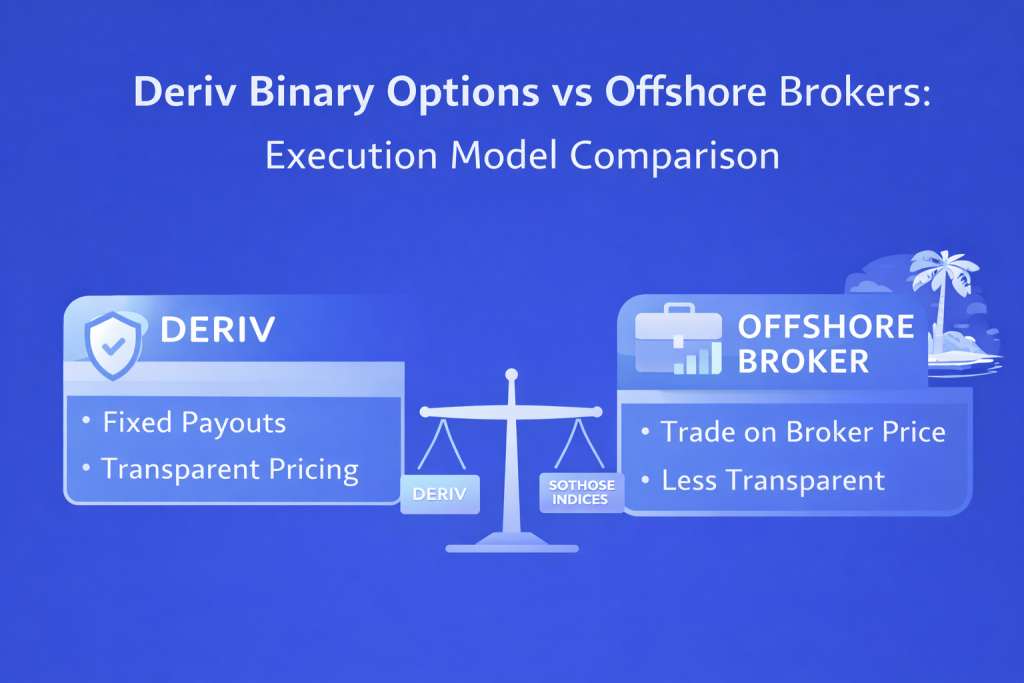
Deriv Day Trading vs Offshore Brokers: Execution Model Comparison
I did not start my trading journey thinking about execution models. Like most beginners, I started with charts, indicators, and the belief that if I could just find the right entry signal, profits would follow. My early trading notebook was full of screenshots of RSI signals, candlestick patterns, and support levels. What it did not […]

Which Broker Is Better for Students in 2026?
For students, trading usually starts with one simple goal: learning how markets work without risking too much money. Most students are not starting with huge budgets. They are trading from a phone, using mobile internet, balancing studies, and trying to avoid losing money quickly. That changes what actually matters in a broker. The “best broker” […]