
Inside Bar Breakout Trading Explained
I still remember the feeling of sitting in front of my dual-monitor setup at 2:00 AM, my eyes bloodshot, staring at a screen that looked like a plate of digital spaghetti. I had MACD lines crossing, Bollinger Bands squeezing, and RSI indicators flashing overbought signals all at once. Every time I thought I had figured out the market, it would reverse and wipe out my hard-earned balance. I was trapped in the classic beginner cycle of overcomplicating everything, a common pitfall I wrote about when recalling the day I stopped trading and finally started making money.
The turning point came when I stripped my charts completely naked. No indicators, no moving averages, just raw candlestick charts. I wanted to see what the market was actually doing, not what a lagging mathematical formula was trying to predict. That was when I discovered the quiet power of price action, specifically the inside bar candlestick pattern. It completely altered my trajectory, saving my portfolio and teaching me how to listen to the market’s natural rhythms. If you are struggling with messy charts, taking the time to seek out the best broker for learning price action is the first step toward visual clarity.
What Exactly is an Inside Bar?
When I first heard the term "inside bar," I expected some complex mathematical formula. In reality, it is one of the most elegant and visually straightforward setups you will ever find.
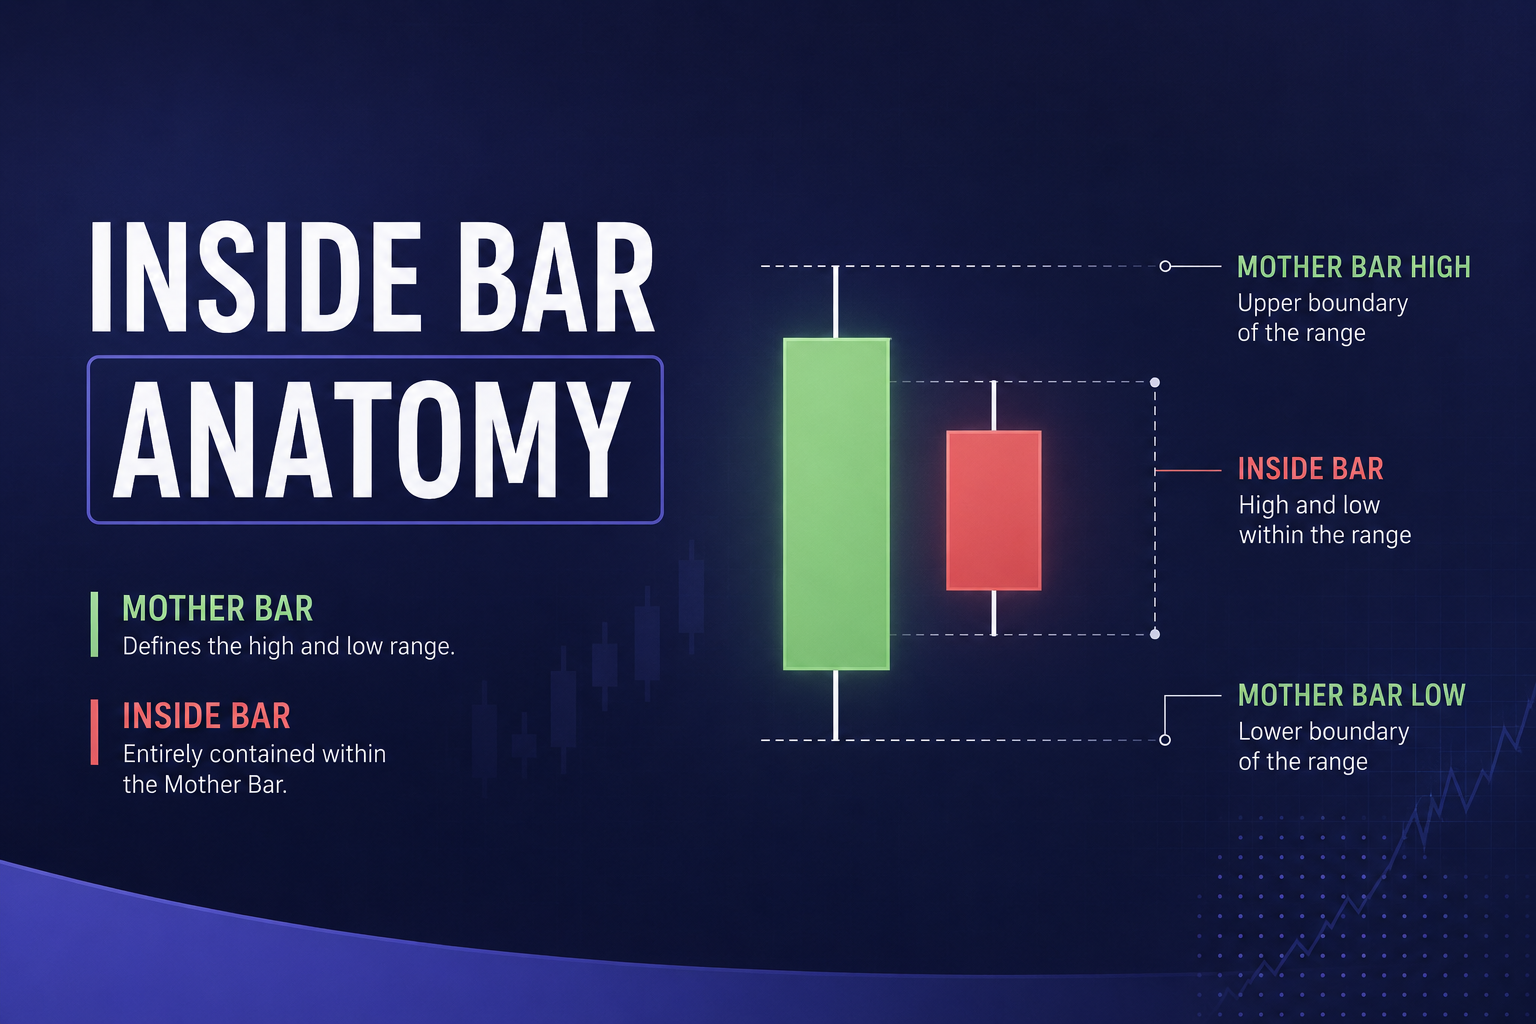
An inside bar is a two-candle price action pattern. The first candle is a large, dominant candle known as the "mother bar." The second candle is a smaller one, completely contained within the high-to-low range of that mother bar. This means the high of the inside bar is lower than the mother bar's high, and the low of the inside bar is higher than the mother bar's low.
When you look at this on a chart, it looks like a mother holding a child. But don't let the simplicity fool you. This setup represents a massive psychological battle taking place behind the scenes. It is a visual representation of a market that has paused to catch its breath. After a strong directional push, the aggressive buying or selling pressure temporarily stops, leading to a period of consolidation where buyers and sellers find a brief, delicate equilibrium.
Understanding this dynamic is crucial, as failing to grasp these pauses is a major reason why 90% of traders lose money before they ever find their footing.
The Psychology of the Squeeze
To trade the inside bar breakout successfully, you have to look past the colored rectangles on your screen and understand the human emotion driving them.
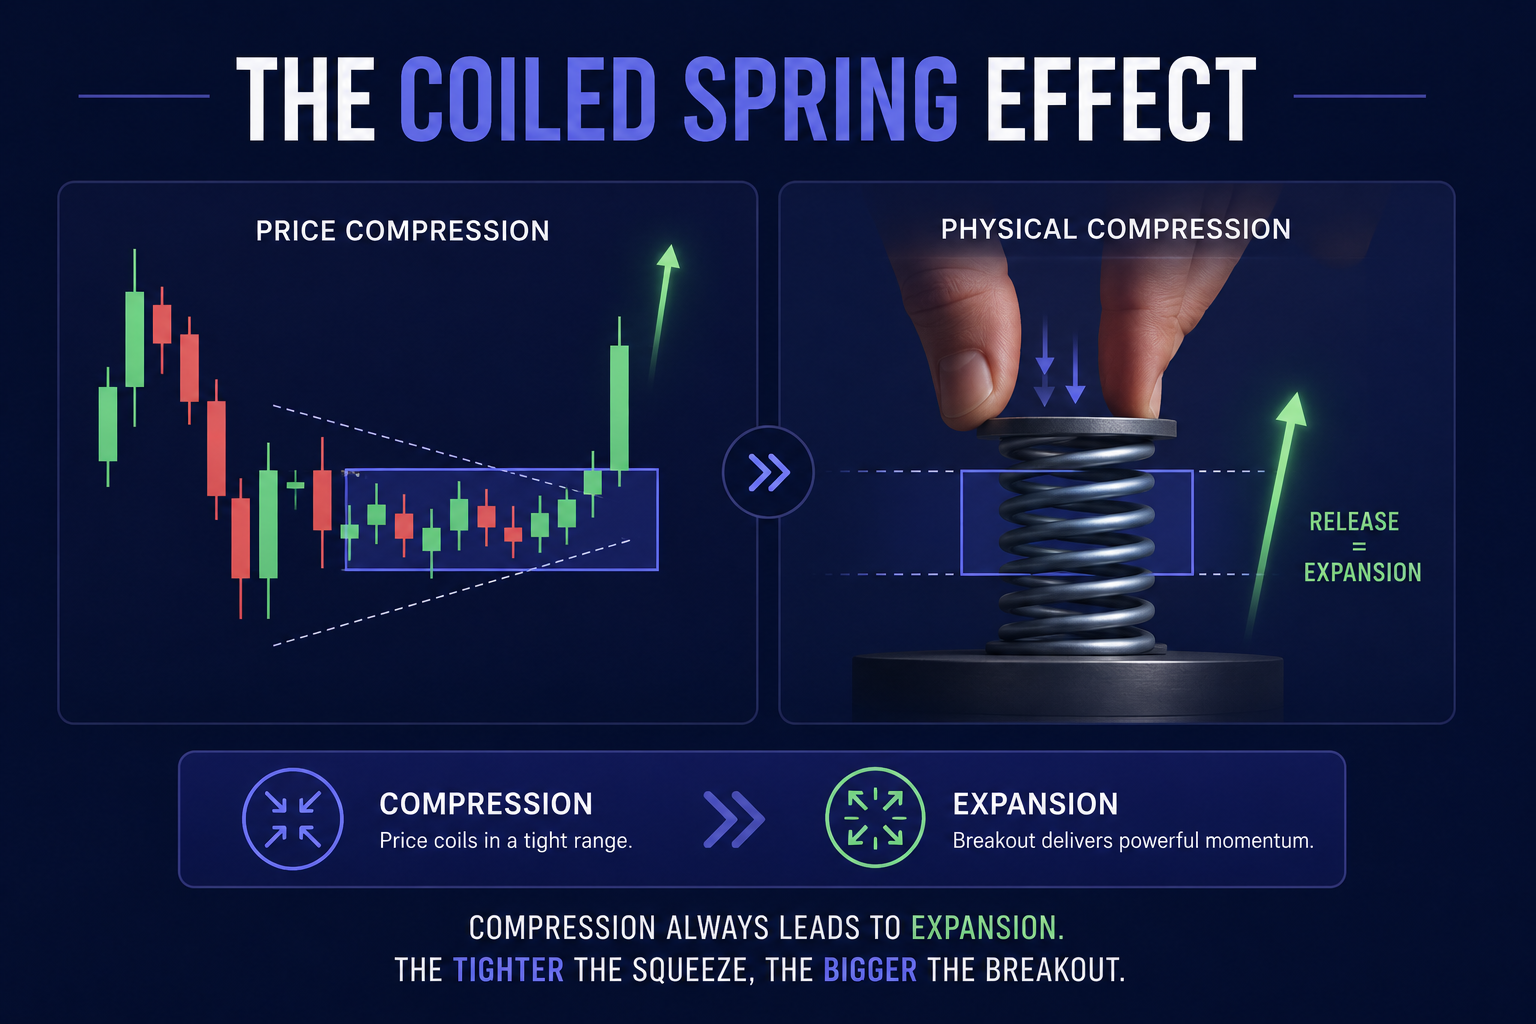
Think of an inside bar as a coiled spring. When a market is trending strongly, it is moving with immense momentum. But a market cannot move in a straight line forever. Eventually, big institutional players stop to take profits, and retail traders hesitate to buy or sell at extreme prices. Volatility drops, trading volume dries up, and price contracts into a tight, narrow range.
This contraction is the inside bar. The market is storing up energy. The longer the market remains in this tight consolidation, the more explosive the breakout is likely to be when the pressure is finally released. By studying how these zones form, I realized how understanding market structure saved my trading because it taught me to anticipate where the big money was building its next move.
Step-by-Step Guide to Trading the Inside Bar Breakout
When I first started trading this setup, I made the mistake of trying to predict which way the breakout would go. I would jump in early, hoping to catch the very beginning of the move. That is a fast track to blowing your account. The real secret to trading this pattern is patience. You do not predict the breakout: you let the market prove itself to you first.
Step 1: Identify the Market Context
Context is everything. An inside bar in the middle of a choppy, sideways market is highly unreliable and will generate nothing but false signals. You want to find inside bars that form during a clearly established, strong trend. If the market is in a powerful uptrend, you are looking for a bullish breakout. If it is in a steep downtrend, you want to ride a bearish breakout.
Step 2: Set Your Pending Orders
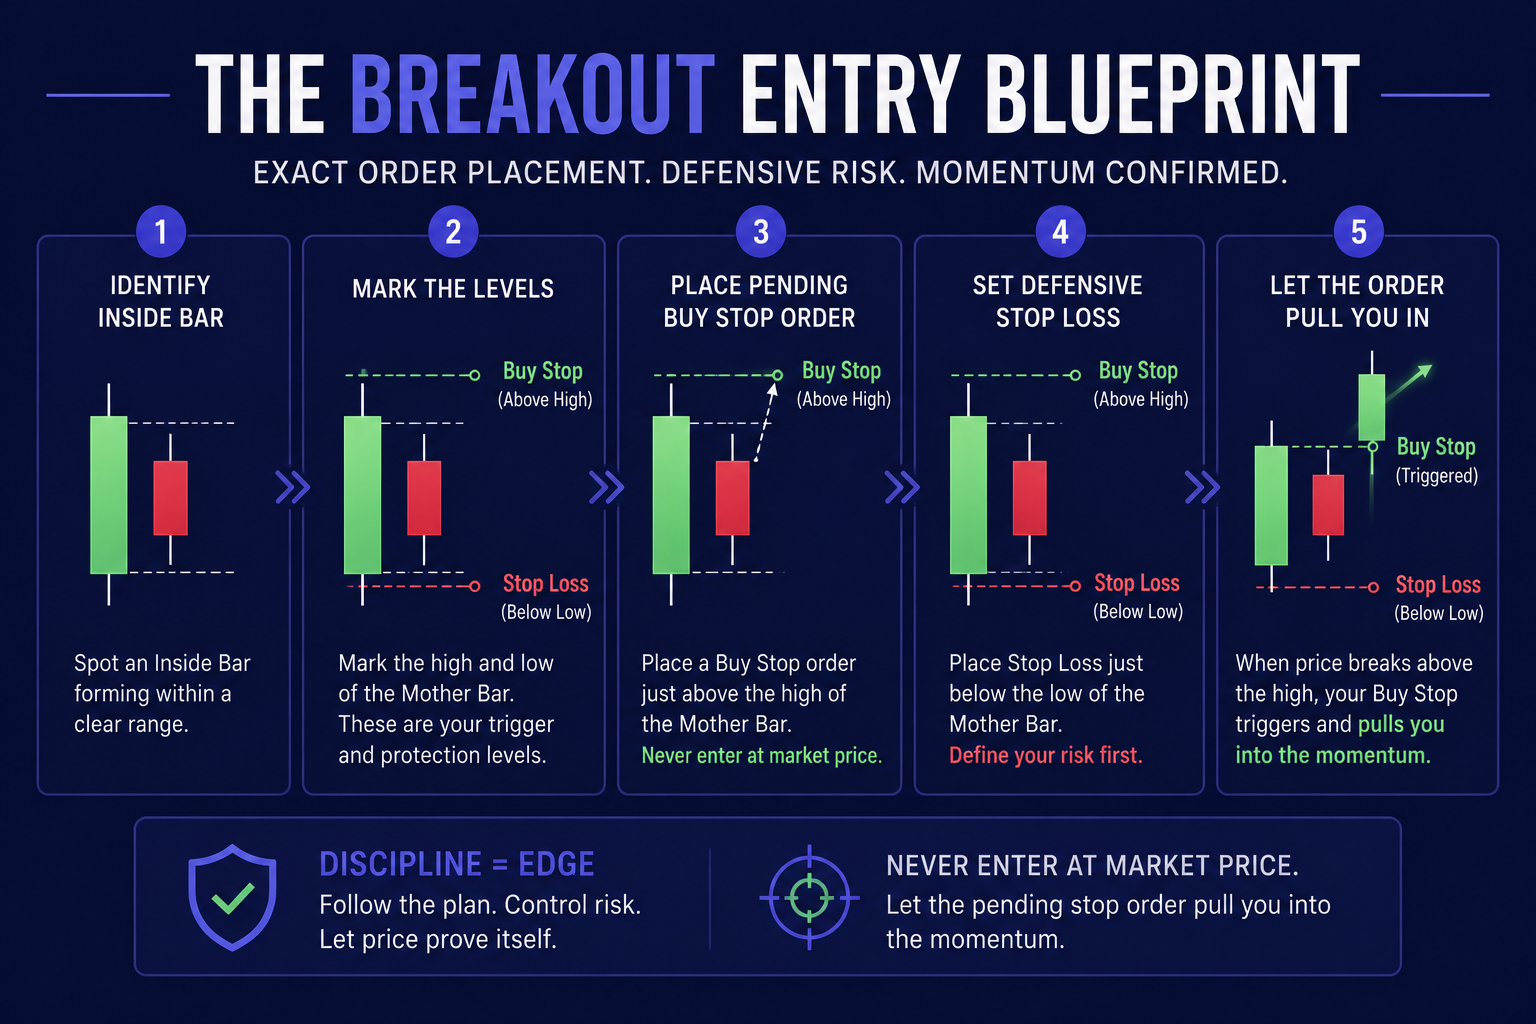
Do not enter this trade with a market order. Use pending orders to ensure you are only dragged into the market when the breakout actually has momentum behind it. For a bullish breakout in an uptrend, place a Buy Stop order just a few pips above the high of the mother bar. For a bearish breakout in a downtrend, place a Sell Stop order just below the low of the mother bar. This mechanical execution removes the emotion from your trading.
Step 3: Manage Your Risk Sensibly
Your stop loss must be placed defensively. The standard, safest approach is to place your stop loss just on the opposite side of the mother bar. For example, in a long trade, your stop loss goes just below the mother bar's low. If the mother bar is exceptionally large, you can place it on the opposite side of the inside bar itself to keep your risk tighter, though this does increase your chances of getting stopped out by a minor price wiggle.
Step 4: Secure Your Profits
I always look for logical technical levels, like key support and resistance zones, to set my profit targets. At a minimum, I aim for a 1:2 risk-to-reward ratio. If I risk fifty dollars on a trade, I want to make at least one hundred dollars.
Choosing the Right Execution Ground
No matter how perfect your strategy is, your execution is only as good as the trading platform you use. Having clean charts that update without latency is crucial when you are waiting for that exact moment of a breakout.
When I was comparing different options, I realized that some platforms are simply built better for price action traders. If you are using a mobile device, choosing a responsive, uncluttered platform is critical. You can see how the top options stack up by reading through this detailed Binomo vs IQ Option mobile app comparison, which highlights how user interface and chart stability can impact your decision-making in real-time.
For those who want to practice these setups with precise tools, you can register and test your skills directly on IQ Option or leverage the flexible chart features of Deriv. Deciding between these two giants can be tricky for a newcomer, so I recommend reading through this comparison of Deriv vs IQ Option for beginners to see which interface matches your trading routine.
How to Avoid the False Breakout Trap
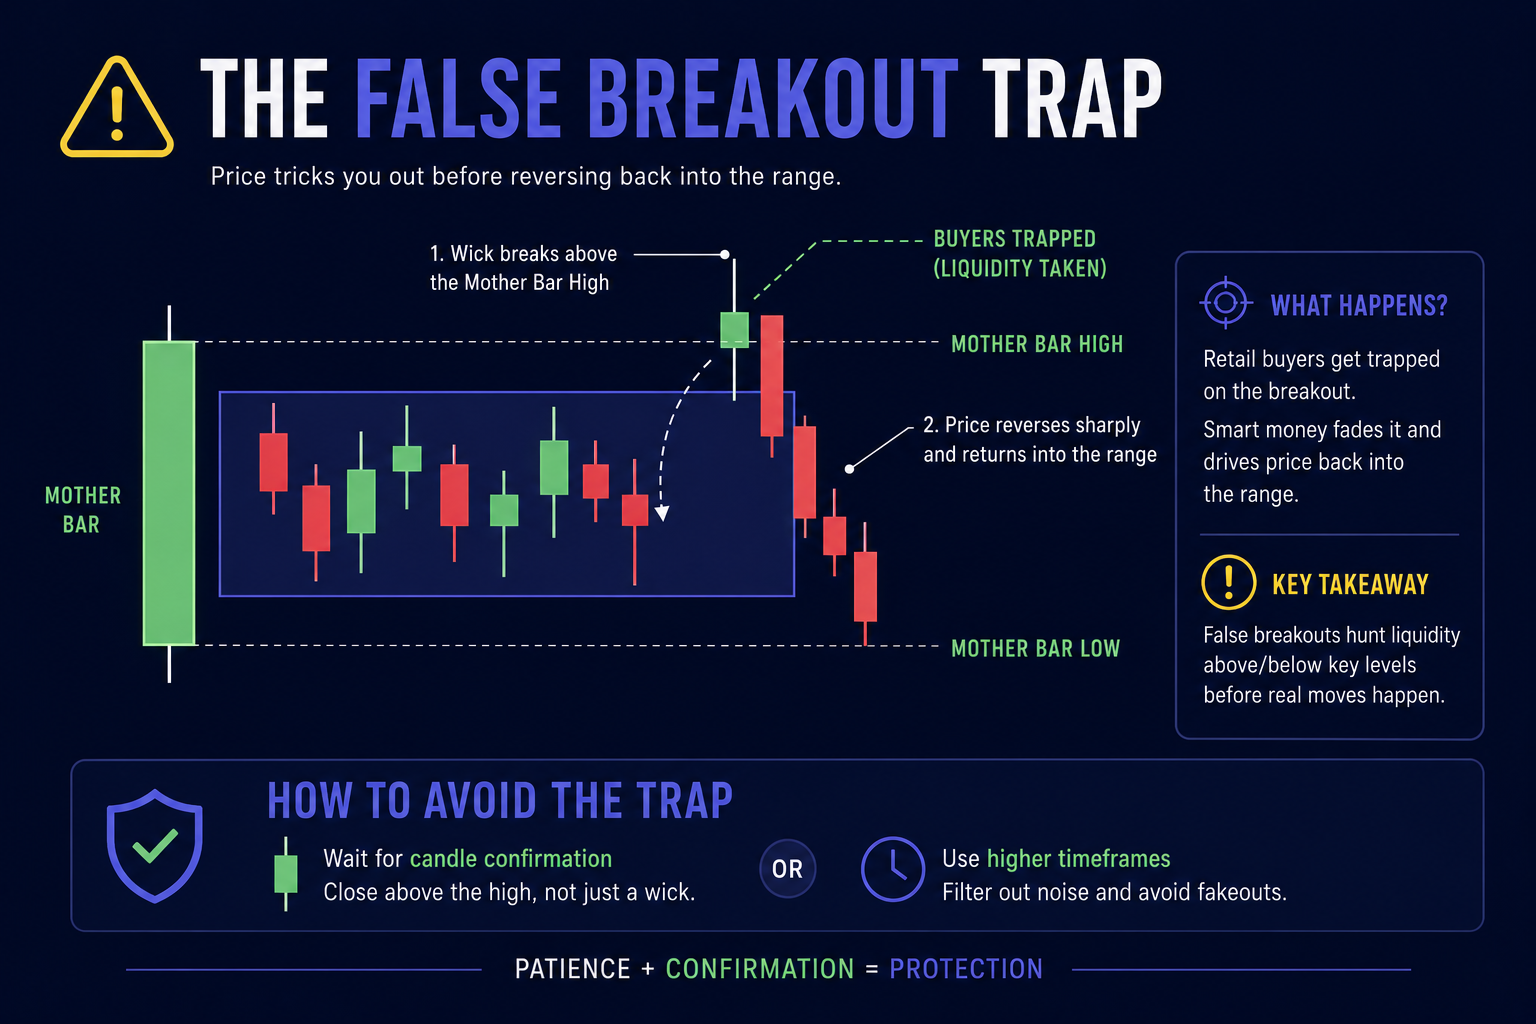
If there is one thing that will test your discipline as a price action trader, it is the false breakout. You set your pending orders, the price shoots past the mother bar, triggers your entry, and then immediately reverses, leaving you holding a losing position. This is the "Fakey" setup, a classic trap where market makers sweep liquidity before moving the market in the opposite direction.
Over time, I learned that the best way to handle these choppy market situations is to simply sit on my hands. Developing this discipline took time, and I had to learn how to sit on my hands during choppy markets to protect my capital.
To filter out these fakeouts:
- Focus primarily on the Daily (D1) or 4-Hour (H4) charts, as lower timeframes contain too much market noise.
- Only trade setups that align with the dominant, higher-timeframe trend.
- Look for expanding volume on the breakout candle as validation that institutional money is backing the move.
Elevate Your Price Action Edge
Mastering the inside bar breakout is a massive step forward, but truly consistent trading requires deeper, structured analysis and real-time insights. If you are tired of trading alone and want to gain a professional edge in the markets, explore the Becoin Forecast Hub for high-probability setups and continuous market updates.
For those ready to take their trading to a professional level with expert market commentary, direct price action blueprints, and in-depth educational resources, I highly recommend checking out the Becoin Premium Tariff Plan. It is the exact resource you need to stop guessing and start executing with mathematical and technical precision.
Capital Core Verification Process Explained: KYC, Restrictions, and Withdrawal Delays
I learned something the hard way with offshore-style brokers: the smoothest part is usually opening the account, funding it, and placing the first few trades. The real test starts when you try to move money back out. That’s exactly why I wanted to document the Capital Core verification process from a trader’s perspective, not from […]

Safest Broker for Small Deposits in 2026
Looking for the safest broker for small deposits in 2026? Discover beginner-friendly trading platforms with low minimum deposits, reliable withdrawals, risk controls, and the best options for starting safely with limited capital. Starting trading with a small amount of money sounds easy until you actually deposit real funds. Most beginners quickly realize that choosing the […]

Deriv vs Binomo Deposit Methods: My 2026 Real Money Comparison Guide
I sat in the corner of a crowded coffee shop, my eyes fixed on my phone screen. After months of testing strategies on a demo account, I had finally saved up a small pocket of risk capital. I felt ready to trade live. A high-probability setup was forming on my charts, and my heart rate […]

Can You Start Trading with $10 on Deriv?
A lot of beginners enter trading with the same question: “Is $10 actually enough to start trading on Deriv?” The short answer is yes. But the real answer is more complicated. You can start with $10 on Deriv, but whether you can survive, learn, and grow that account depends entirely on your expectations, discipline, and […]

Capital Core for US Traders: Can Americans Use It Safely?
I’ll be honest: when I first started digging into Capital Core for US traders, I wasn’t looking for hype. I was looking for a boring answer. Can I sign up from the US?Can I actually trade?And the real question nobody asks loudly enough: if I win, can I withdraw without drama? That last one matters […]

Capital Core Account Types Explained: Which One Fits Your Trading Budget?
When I first started looking at Capital Core account types, I made the same mistake most traders make. I looked at the bonus first. Then I looked at the leverage. And only after that did I start asking the question that actually matters: Which account can I realistically manage without forcing trades just because I […]