
How Understanding Market Structure Saved My Binary Options Trading
I remember the exact moment my trading account hit zero for the third time in a single month. It was a rainy Tuesday evening, and I was staring at a 1-minute chart on my laptop screen. The price had been moving up aggressively. It looked like a flawless rocket ship to the moon. I clicked the green “Higher” button, confident that the momentum would carry my trade to an easy payout in sixty seconds.
Instead, the very next candle reversed with terrifying speed. It didn’t just drop; it crashed straight through my entry point, leaving me empty-handed. Desperate to recover the loss, I immediately entered a “Lower” trade, assuming the market was crashing. The market instantly flipped back upward.
I felt like an invisible entity was watching my screen, actively trading against me. If you have ever felt this way, you are not alone. It is exactly why 90% of traders lose money. We enter the market chasing colors and momentum without understanding the underlying architectural layout of the asset.
Everything changed for me when I stopped downloading messy technical indicators and started learning market structure. I realized that the market isn’t a chaotic ocean of random ticks. It is a highly organized, repetitive system driven by institutional order flow and retail psychology. Once you learn to read the architectural bones of a chart, binary options stop looking like a gamble and start looking like a game of calculated probabilities.
What is Market Structure and Why Does It Matter for Binary Options?
In simple terms, market structure is the study of the trend, the asset’s current phase, and the structural high and low points on a price chart. While forex or crypto traders use market structure to find massive moves that span days, binary options traders use it to predict the direction of the very next few candles.
Because binary options are fixed-time contracts, precision is everything. You do not just need to be right about the direction; you need to be right right now.
When I first started, I used to hunt for the best broker for learning price action because I realized indicators lagged too much for short-term expiration times. Price action operates on the foundation of market structure, which is divided into three distinct phases: bullish trending markets, bearish trending markets, and ranging or consolidating markets.
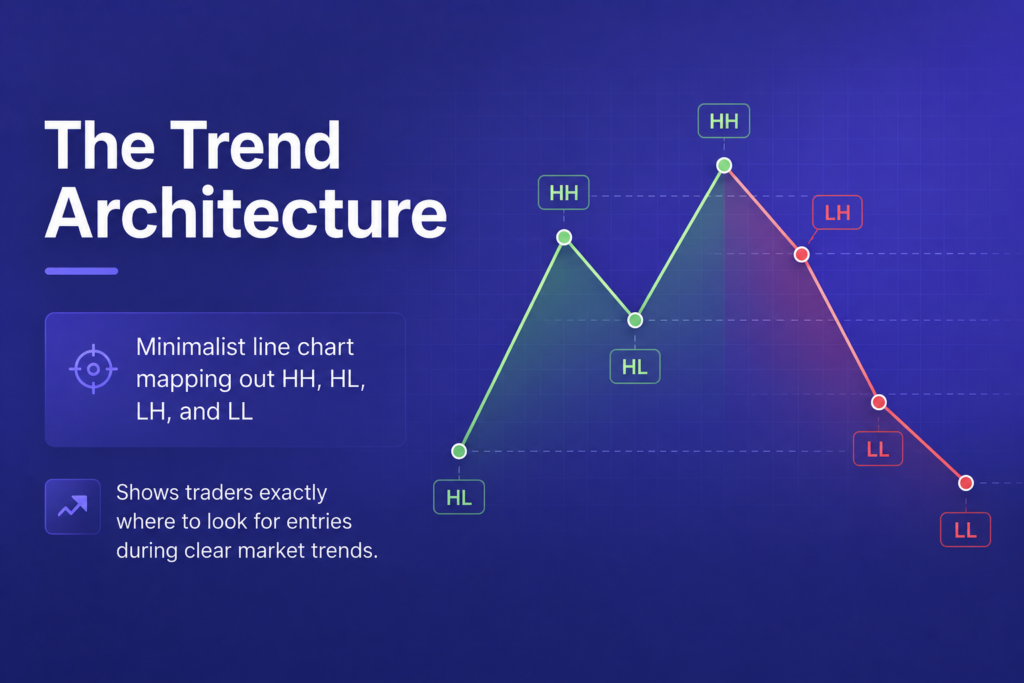
The Anatomy of a Bullish Trend
A bullish market structure is defined by a series of Higher Highs (HH) and Higher Lows (HL). When big buyers push the price up, it creates a peak (a high). When those buyers pause to take profits, the price dips temporarily, creating a trough. If the buyers step back in before the price falls past the previous low, they create a Higher Low.
For binary options, the absolute best time to take a “Higher” trade is not when the price is breaking out into a new Higher High. That is where beginners get trapped by sudden pullbacks. The golden entry is at the termination of a pullback, right as the asset forms its Higher Low.
The Anatomy of a Bearish Trend
Conversely, a bearish market structure consists of Lower Highs (LH) and Lower Lows (LL). Sellers drive the price down, take a breather, cause a minor upward retracement, and then slam the price down even lower.
If you are looking to place “Lower” trades, your eyes should be glued to the Lower Highs. Waiting for the price to bounce upward into a previous structural broken floor turned ceiling gives you the highest mathematical probability of winning a short-duration binary trade.
The Range: The Binary Options Trap
The third structure is the range, where the asset moves sideways between a relatively equal ceiling of resistance and a floor of support. While ranging markets can offer clean bounces if the channel is wide enough, tight ranges are highly toxic for short-term traders. I spent months learning how I learned to sit on my hands during choppy markets because attempting to trade a narrow range with 1-minute expiries is financial suicide.
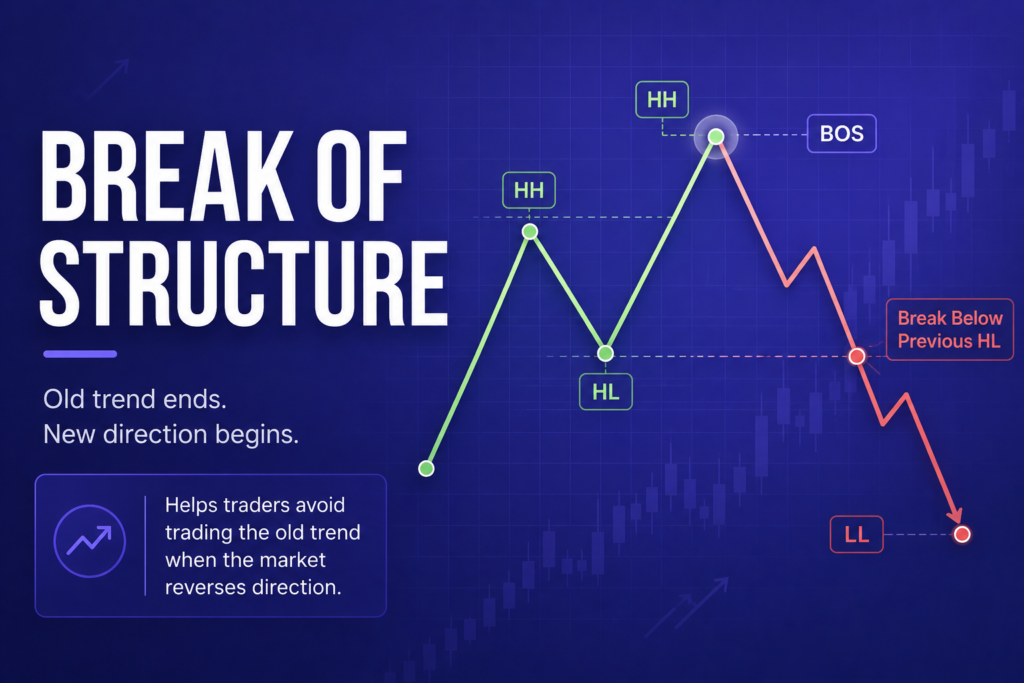
Reading Structural Shifts: The Break of Structure (BOS)
The real magic happens when you learn to identify when a trend is dying. A trend does not just stop out of nowhere; it gives clear architectural warning signs. This signal is known as a Break of Structure (BOS) or a Change of Character (CHoCH).
Imagine a bullish market that has been printing Higher Highs and Higher Lows consistently. Suddenly, the price rallies but fails to break above the previous Higher High. It prints a Equal High or a Lower High instead. Then, sellers aggressively push the price down, crossing clean through the last Higher Low.
The structural floor is broken. The bullish structure is officially dead, and a new bearish cycle has begun.
When I spot a Break of Structure on a clean platform like the IQ Option Platform, I immediately shift my bias. Instead of looking for buy entries, I wait for the price to retest that broken structural level from below to hunt for a high-probability sell trade.
Structuring Your Workspace for Short-Term Analysis
To trade market structure effectively, you do not need a screen cluttered with twenty different colorful lines. You need a platform that offers lightning-fast execution and highly responsive charting tools.
When I am testing out new strategies, I always check the safest trading platforms to ensure my charting lines stay exactly where I put them and don’t lag during high-volatility sessions. For traders who appreciate minimalism, finding a platform that doesn’t overwhelm you with unnecessary features is critical. Many beginners prefer reading pure price lines on a platform designed to be the best broker without complicated features to keep their psychological focus sharp.
Let’s look at how to map out a clear structural chart step-by-step:
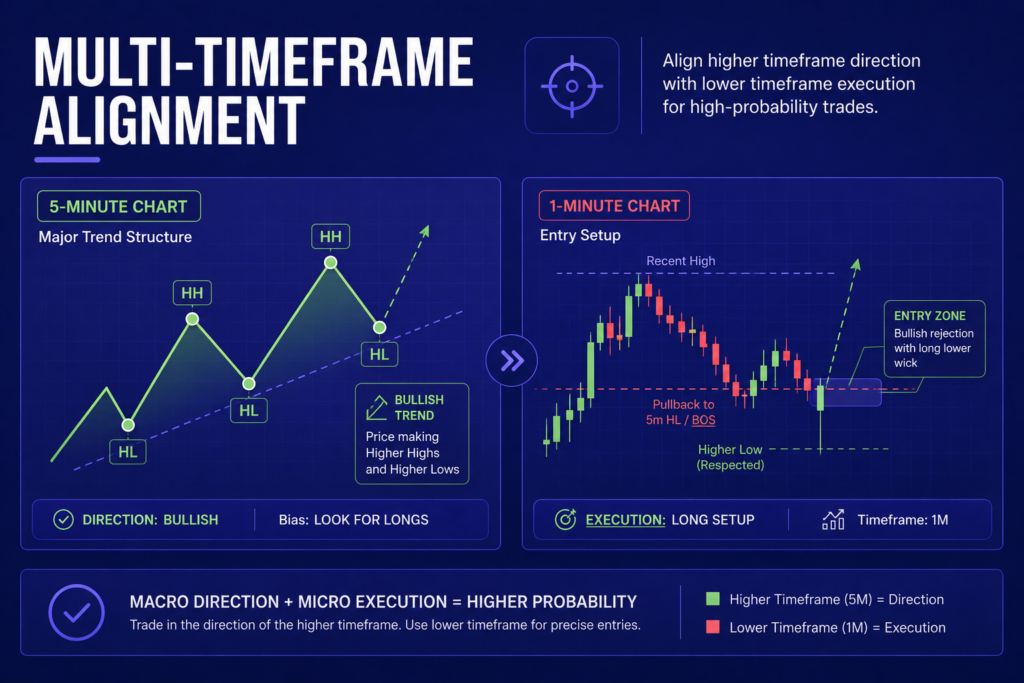
- Identify the Master Trend on a Higher Timeframe: If you are trading 1-minute expiries, look at the 5-minute or 15-minute chart first. Is the overall market structure moving up or down? Always trade in the direction of the higher timeframe structure.
- Mark Your Swing Highs and Swing Lows: Draw horizontal lines across the clear peaks and troughs on your chart. These represent the real battlegrounds of supply and demand.
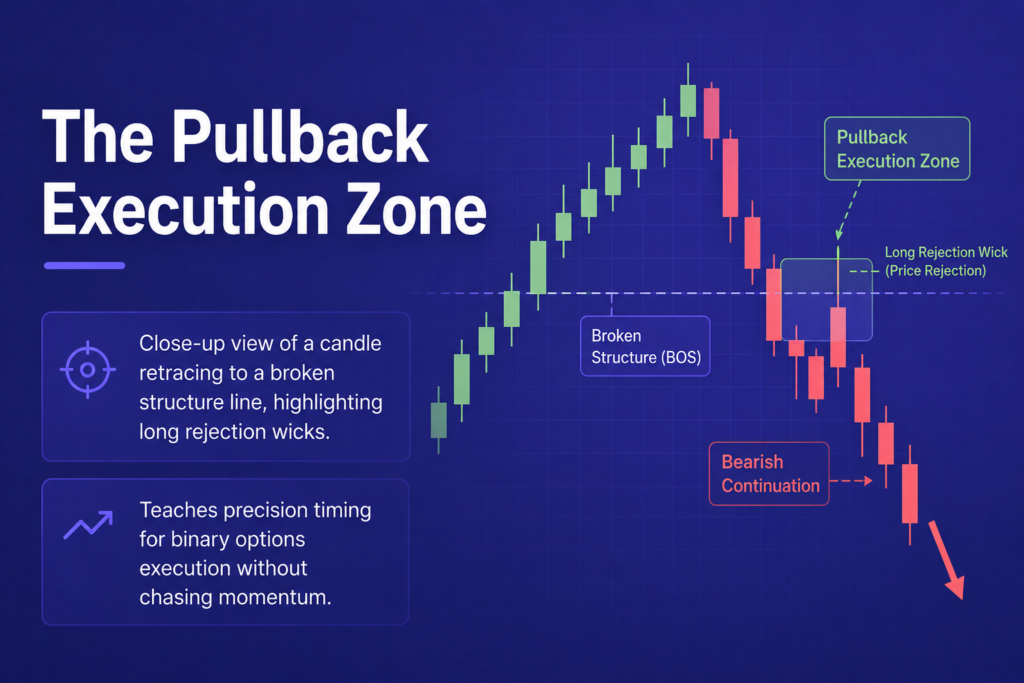
- Watch the Reaction at the Key Levels: When price approaches a previous structural point, do not guess. Look for candle rejection wicks. A long wick pointing downward at a Higher Low means the structure is holding, signalling a perfect moment to execute.
Practical Application Across Different Trading Ecosystems
Different brokers handle structural movements uniquely depending on their internal chart feeds and available assets. For instance, if you are looking to trade highly predictable, mathematically driven structures that run 24/7 without being affected by real-world news events, you might look toward synthetic assets. Many traders prefer the Deriv Platform for this specific reason, as its synthetic indices follow clean, algorithmic price action patterns beautifully.
If your style leans heavily toward trading traditional currency pairs during major sessions, you need rapid order fulfillment so you do not suffer from slippage at structural levels. For those who prioritize execution speed and clean interface mapping, exploring alternative options like the Pocket Option Platform, the Quotex Platform, or the highly responsive Expert Option Platform can make a substantial difference in catching volatile structural breaks.
Similarly, platforms like the Olymp Trade Platform and Capital Core offer excellent technical environments for drawing clear support and resistance lines across multi-timeframe structures.
Shifting From Gambler to Structural Master
The day I stopped guessing whether the next candle would be green or red was the day I finally started treating binary options like a real business. It requires patience. It requires you to sit on your hands and wait for hours if necessary until the price arrives exactly at a verified structural zone.
If you are tired of watching your hard-earned capital vanish due to unpredictable market swings, it is time to stop trading blindly. You need deep analytical insights, precise daily forecasts, and a community that decodes the real movements behind the scenes.
To truly take your market comprehension to an institutional level, check out the specialized insights available at the Becoin Forecast Hub and step up your game by securing your access to the Becoin Premium Tariff Plan. Do not let the market dictate your financial future; learn its structure, read its blueprints, and take control of every single trade you make.

The Day I Stopped Trading and Finally Started Making Money
It was a rainy Tuesday morning, and I was staring at my screen with a familiar knot in my stomach. The previous three days had been a slow, agonizing slide into the red. I had given back two weeks of hard-earned profits in less than seventy-two hours. Every asset I clicked on looked like a

The Clock and the Candle: How I Stopped Guessing the Best Time to Trade Binary Options
I still remember the night I blew my third trading account. It was 11:30 PM. The house was completely quiet, the market charts on my screen were barely crawling, and I was forcing trades out of pure impatience. I kept staring at a flatline asset, placing one-minute positions, convinced that the market owed me a
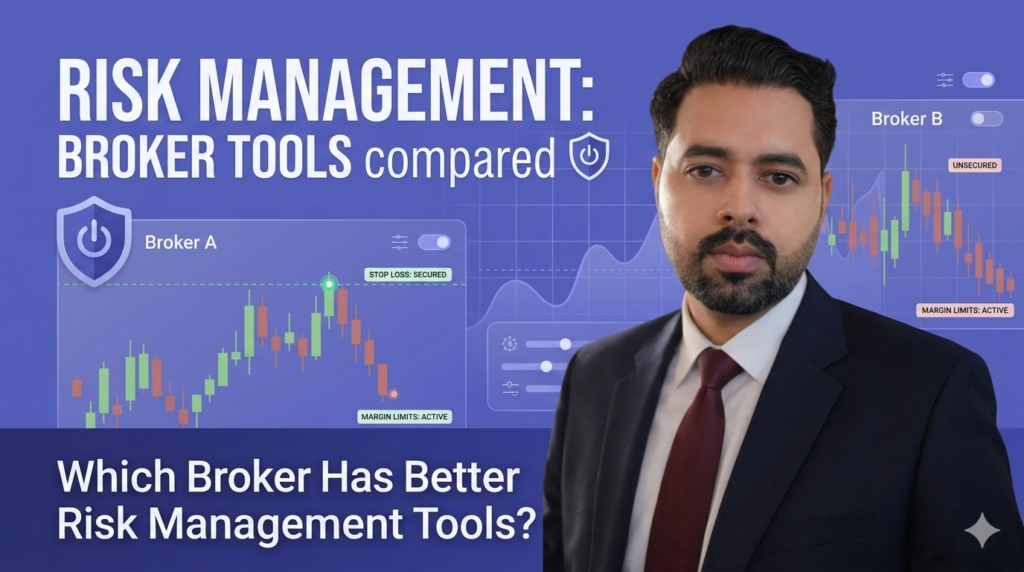
Which Broker Has Better Risk Management Tools?
The burning smell of my own account blowing up is a scent I will never forget. It was a rainy Tuesday afternoon a few years back. I sat huddled over my laptop, watching a currency pair oscillate. Confident, arrogant, and entirely unprotected, I clicked buy. Minutes later, a sudden market spike completely wiped out my
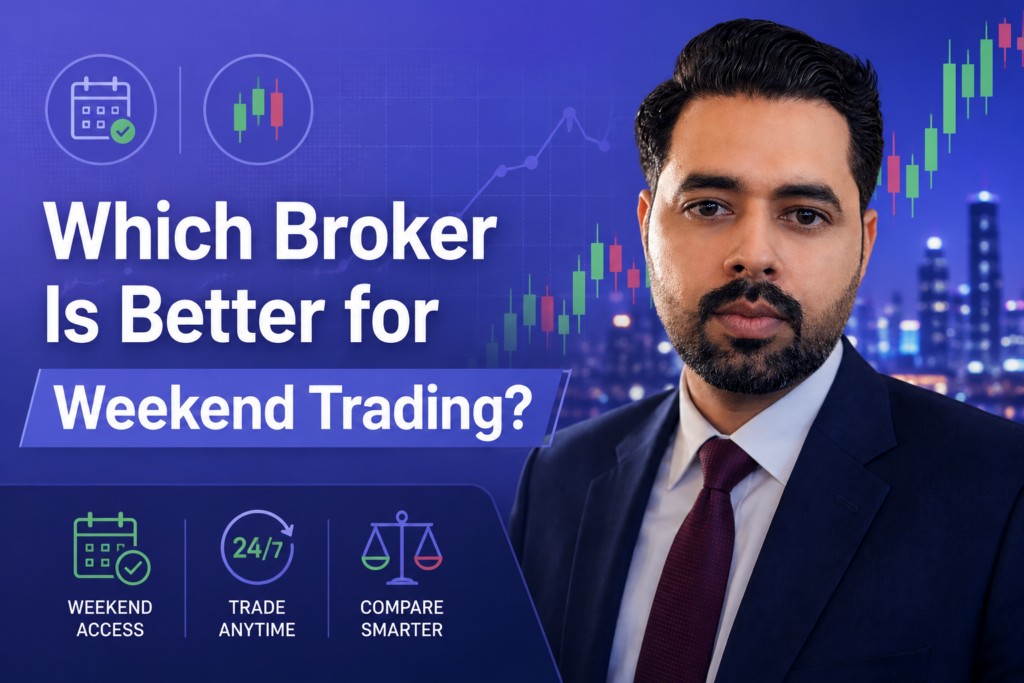
Which Broker Is Better for Weekend Trading?
It was a chilly Saturday morning, and while the rest of the world was sleeping in or catching up on shows, I was staring at a completely frozen screen. My usual EUR/USD chart looked like a heart monitor flatlining. The traditional markets were closed. The banks were shut down. For a long time, that was
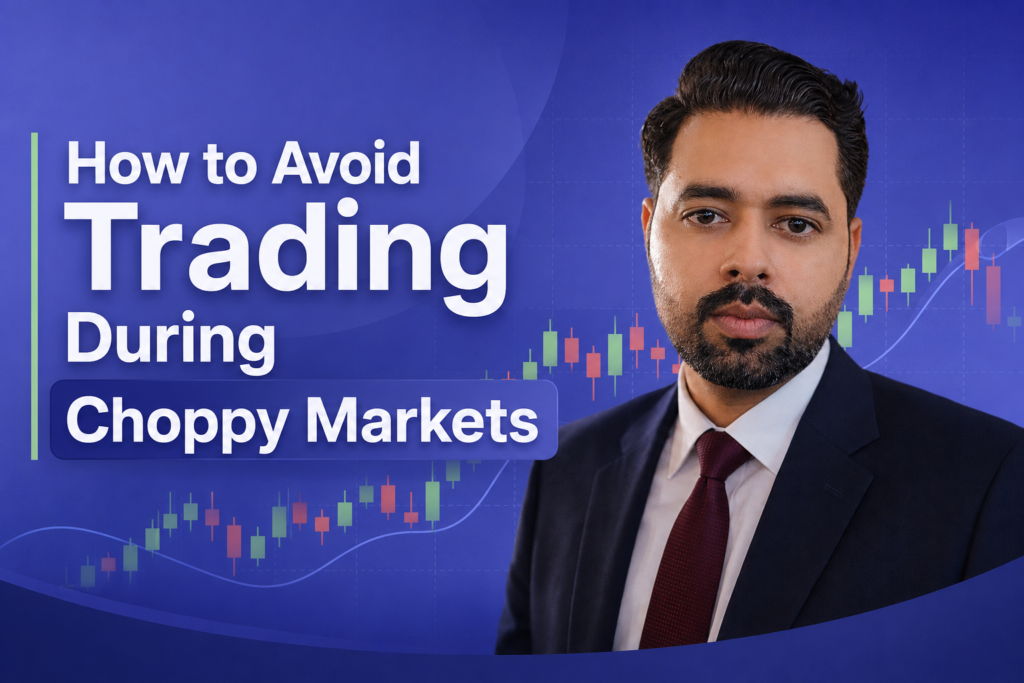
How I Learned to Sit on My Hands During Choppy Markets
I remember the morning vividly. It was a Tuesday. The coffee on my desk was still piping hot, the charts on my screen were blinking, and I was feeling incredibly confident. I had just finished reading about how market open hours create the best trading opportunities, and I was ready to hunt for a clean

Why Market Open Hours Create the Best Trading Opportunities
I used to think trading was a 24-hour conveyor belt of endless cash. In my earliest days, armed with a laptop, a hot cup of coffee, and far too much unearned confidence, I would stare at charts at 11:00 PM on a Tuesday. The candles barely moved. They crawled across my screen like snails on