USD/TRY Forecast: A 48.31 Record With 48.00 the New Floor
The lira printed another record low in August, lifting USD/TRY above 48.00 for the first time. Here is the level map, the carry maths and what could break the crawl.
Real strategies, honest forecasts, and data-backed analysis delivered by traders who actually trade.
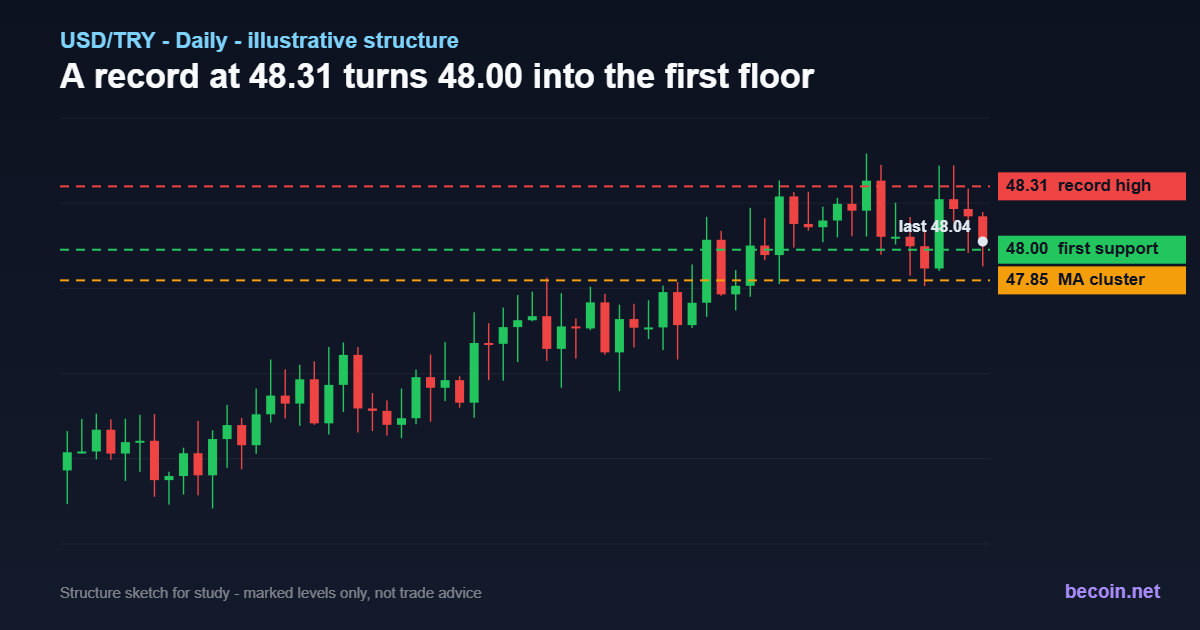
The lira printed another record low in August, lifting USD/TRY above 48.00 for the first time. Here is the level map, the carry maths and what could break the crawl.
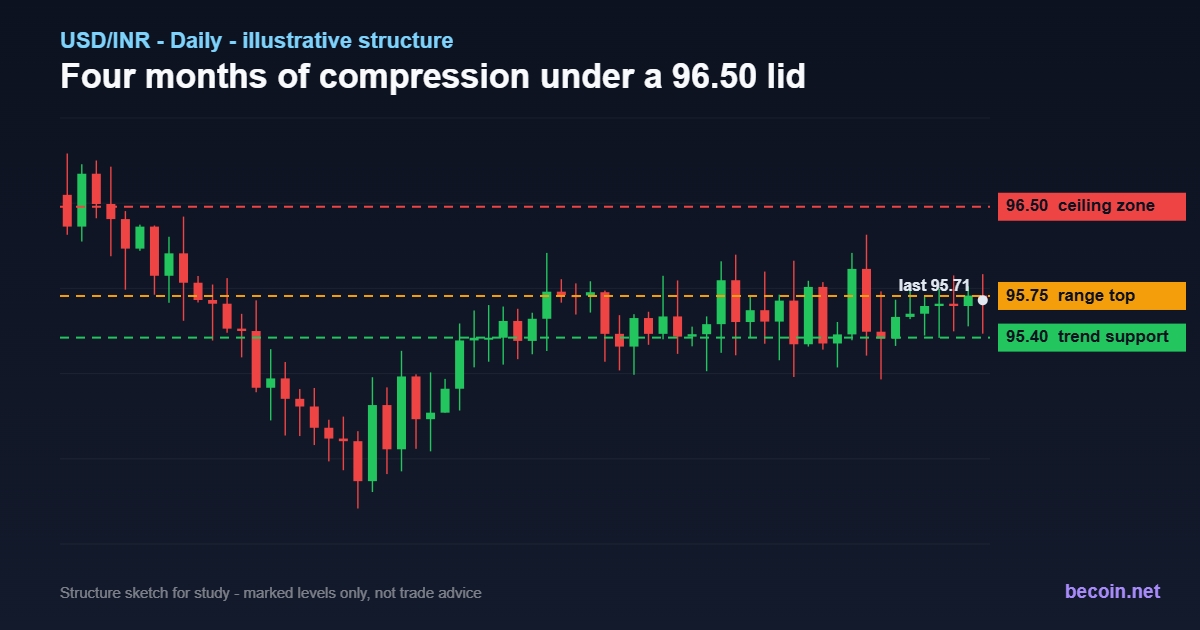
After a violent first half, USD/INR has spent four months compressing under 96.50. Here is the level map, the RBI intervention pattern and what finally breaks the coil.
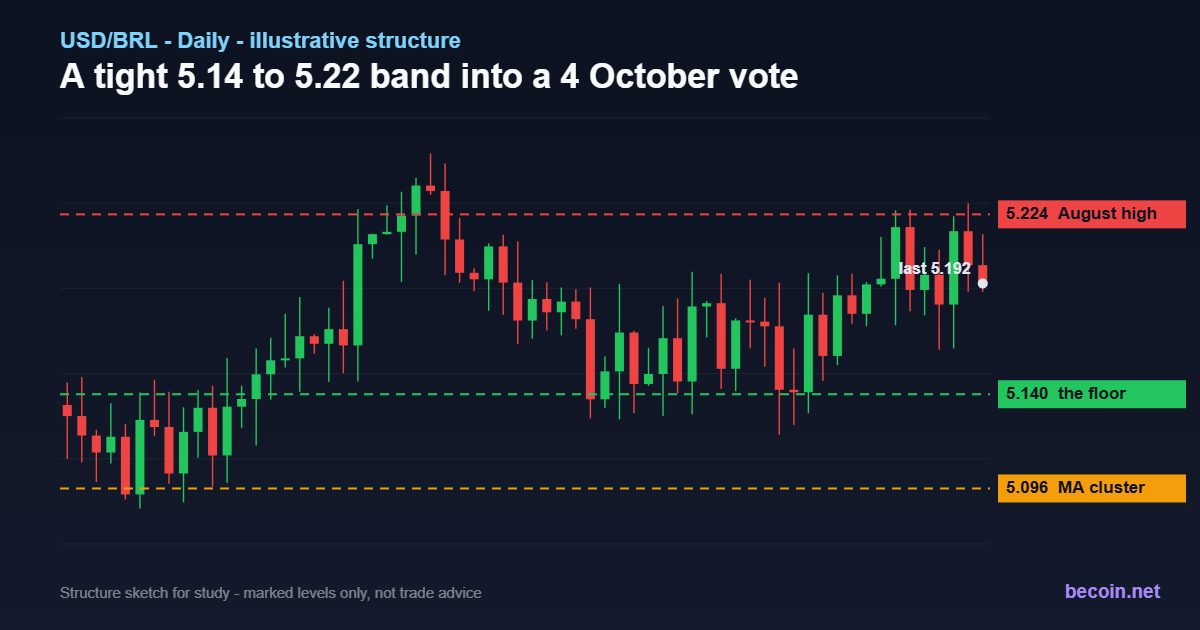
USD/BRL is compressed between 5.14 and 5.22 with the Selic cutting cycle slowly eroding the carry and a first-round vote on 4 October. Here is the level map.
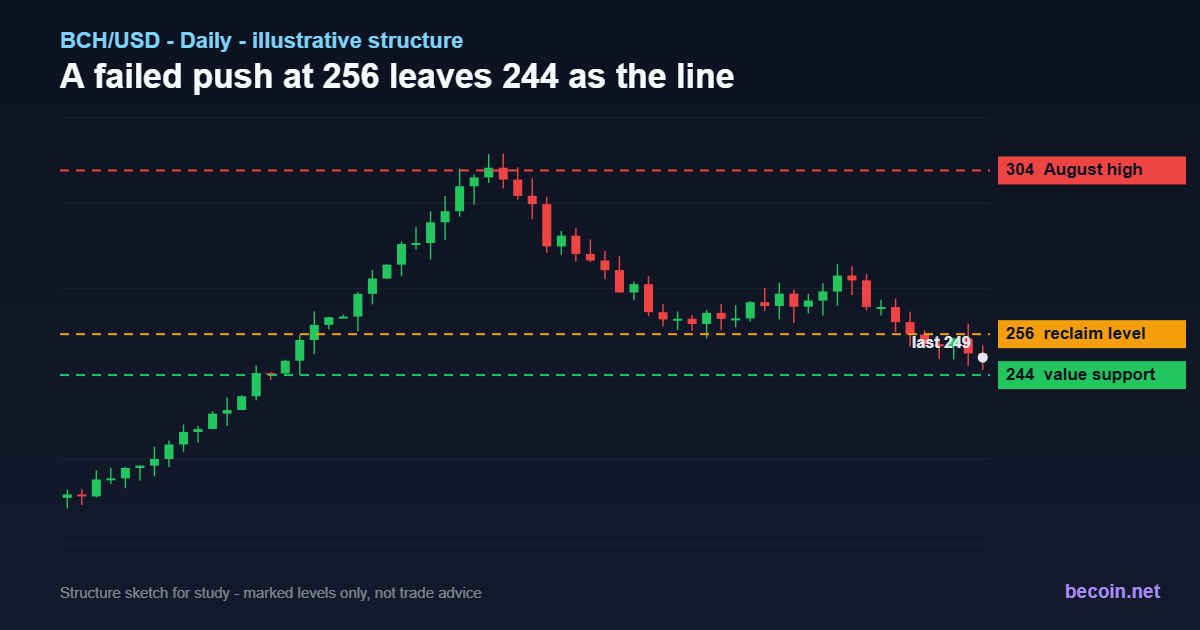
BCH rallied 29% in a week, then failed at the 256 average and gave back 7% in a session. Here is the level map, the base case and what the May upgrade changed.

Cardano ran 50% in four days and has handed the whole move back to the low of the bar that made it. A governance vote closing on 1 September is the near-term risk.

Meta grew revenue 28% and still lost a seventh of its share price, because capital spending is now guided as high as $145bn. The chart shows where the recovery runs out.

Netflix fell 7.7% on results in July and has since recovered almost all of it, reaching 82.33 before easing. The engagement disclosure change is the detail worth watching.

Bitcoin has reclaimed the $80K zone, but the real question is whether bulls can turn it into support. Here’s what the latest BTC data says about the next move.

The Rule of 72 is a simple investing formula that estimates how long it takes to double your money based on an annual rate of return.

Discover the essential trading metrics every trader must track to stay profitable. Learn how tracking expectancy, drawdown, and win rates transformed my journey.