
Bitcoin $80K: What Happens Next? BTC Price Prediction & Key Levels
Bitcoin $80K: What Happens Next? BTC Price Prediction & Key Levels
Bitcoin is back around the $80,000 level, and now the market is facing a much bigger question:
Is Bitcoin preparing for another major rally, or is this another breakout that could quickly turn into a trap?
The move toward $80K has brought traders' attention back to Bitcoin, but price alone doesn't tell the whole story. ETF flows, market liquidity, leverage, funding rates, open interest and technical levels can all influence what happens next.
For traders, the next few moves could be more important than the rally that brought BTC back to $80K.
Why Is $80,000 So Important for Bitcoin?
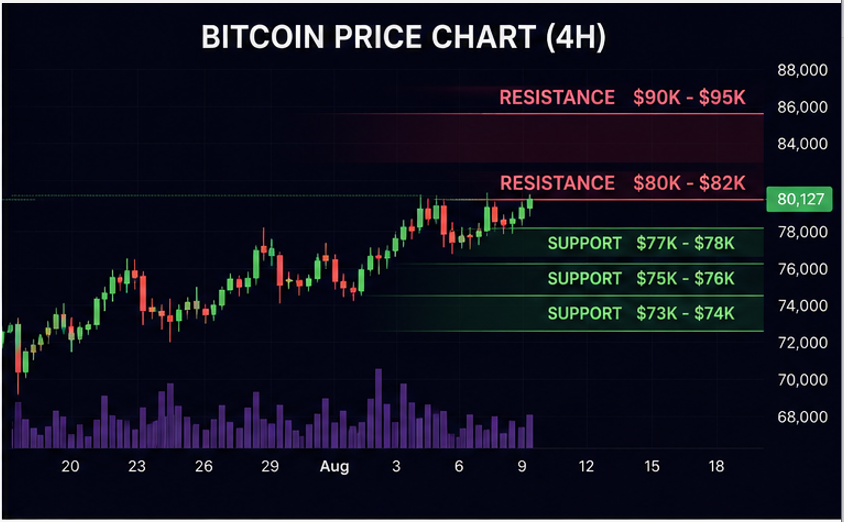
Round numbers often become psychological levels in financial markets, and $80,000 is currently one of the most important areas on the Bitcoin chart.
Bitcoin has shown strong buying interest around this region, but sellers can also become more aggressive when BTC approaches major resistance.
This creates two possibilities.
Bullish scenario
If Bitcoin can break above the $80K–$82K area and remain above it, the market could begin looking toward higher resistance levels.
A successful breakout could put $90K and $95K on traders' radar.
The key word is confirmation.
Bitcoin briefly moving above $80K doesn't necessarily mean the breakout is real. Traders generally want to see BTC hold the level and potentially turn previous resistance into new support.
Bearish scenario
The alternative is a rejection.
If Bitcoin fails to hold above $80K and begins falling back toward the $77K–$78K area, traders may start watching the lower support zones.
A deeper correction could bring $75K and $73K–$74K back into focus.
That wouldn't automatically mean the Bitcoin bull case is finished.
It could simply mean the market needs a deeper retest before attempting another move higher.
Bitcoin Price Prediction: What Happens Next?
Instead of trying to predict one exact Bitcoin price, it makes more sense to think in terms of market scenarios.
Scenario 1: Bitcoin breaks $82K
A decisive move above $82K would strengthen the short-term bullish structure.
If buyers can maintain momentum, the next major psychological targets could be:
$85K → $90K → $95K → $100K
The closer Bitcoin gets to $100K, the more important volume and market participation become.
Scenario 2: Bitcoin remains between $77K and $82K
This would create a consolidation range.
While this might look boring, consolidation can actually be extremely important.
A period of sideways trading can allow excessive leverage to disappear while buyers and sellers establish a new equilibrium.
A breakout from that range could then produce a much stronger move.
Scenario 3: Bitcoin loses $77K
A sustained move below $77K would weaken the immediate bullish setup.
Traders could then watch:
$75K → $74K → $73K
If Bitcoin finds strong buying pressure in those areas, the pullback could become another accumulation opportunity.
If those levels fail with heavy selling, the market could enter a deeper correction.
Bitcoin ETF Flows: The Data Behind the Rally
One of the most important things Bitcoin traders should monitor is spot Bitcoin ETF activity.
Why?
Because ETF inflows can provide an indication of demand from larger investors.
When Bitcoin rises while ETF inflows remain strong, the rally has a stronger fundamental demand component.
But if Bitcoin continues climbing while ETF demand starts weakening, traders may need to consider whether leverage and short covering are becoming more important drivers.
This is why Bitcoin's price should never be viewed in isolation.
A better dashboard includes:
- BTC price
- ETF inflows and outflows
- Trading volume
- Open interest
- Funding rates
- Liquidations
- Bitcoin dominance
- Dollar strength
Together, these metrics can provide a much clearer picture of market conditions.
Bitcoin Short Squeeze: Why BTC Can Move So Fast
Bitcoin is famous for sudden moves, and leverage can make those moves even more aggressive.
Imagine thousands of traders are betting that Bitcoin will fall.
Then BTC suddenly starts rising.
Some of those traders are forced to close their short positions.
Closing a short position requires buying Bitcoin or Bitcoin-related contracts.
That additional buying can push Bitcoin even higher.
Then more short positions are liquidated.
The process can create a chain reaction:
BTC rises → shorts get liquidated → forced buying increases → BTC rises further.
This is known as a short squeeze.
It can create extremely powerful rallies, but there is an important downside.
Once the forced buying disappears, Bitcoin can lose momentum quickly.
That's why traders should distinguish between a rally supported by genuine spot demand and a rally heavily powered by leverage.
Bitcoin Funding Rates and Open Interest
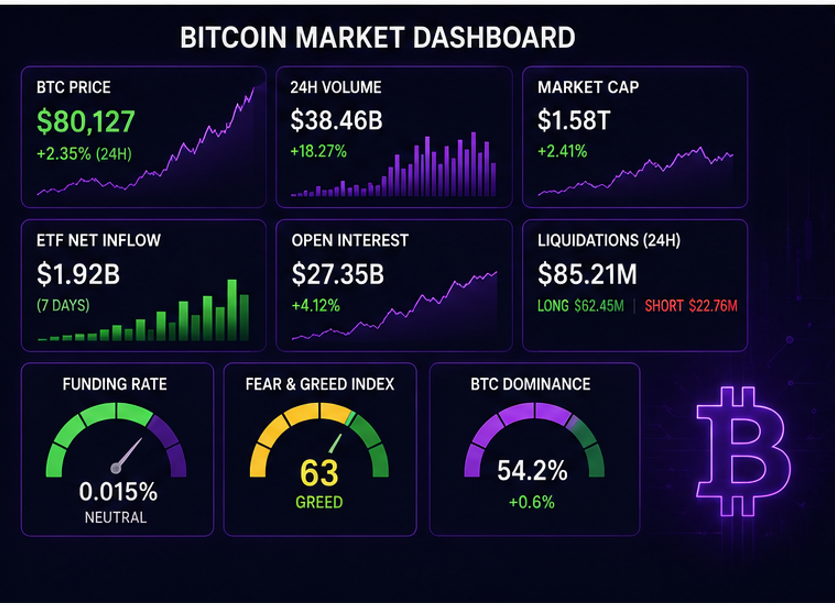
Two of the most useful derivatives indicators are funding rates and open interest.
Funding rates provide insight into whether traders are paying to maintain predominantly long or short positions.
Open interest shows how much money is currently committed to outstanding futures and perpetual contracts.
When Bitcoin rises alongside rapidly increasing open interest, leverage may be entering the market.
That can be bullish initially.
But excessive leverage can also increase the risk of a sharp liquidation event.
For example:
BTC rises → traders become confident → more leveraged longs enter → market becomes crowded → small decline triggers liquidations → selling accelerates.
This is why a trader looking at Bitcoin's next move shouldn't only ask:
"Is BTC going up?"
The better question is:
"Who is driving the move?"
Bitcoin Support and Resistance Levels
Here are the major zones traders may want to watch:
| Bitcoin Level | Market Importance |
|---|---|
| $80K–$82K | Major resistance / breakout zone |
| $77K–$78K | Important short-term support |
| $75K–$76K | Secondary support |
| $73K–$74K | Deeper support |
| $90K–$95K | Potential upside zone |
| $100K | Major psychological target |
These levels shouldn't be treated as guaranteed reversal points.
Bitcoin can move through support and resistance quickly, especially when volatility and leverage increase.
Instead, think of them as areas where market behavior could change.
What Could Push Bitcoin Above $80K?
Several factors could help Bitcoin establish a stronger breakout.
1. Strong institutional demand
Continued buying from large investors could provide additional support for the market.
2. Bitcoin ETF inflows
Persistent ETF demand could strengthen the underlying buying pressure.
3. A weaker U.S. dollar
Bitcoin has historically attracted attention when investors become concerned about currency purchasing power and liquidity conditions.
4. Improving liquidity
More liquidity flowing into risk assets can benefit Bitcoin and other high-beta markets.
5. Strong breakout volume
A breakout supported by significant trading volume is generally more convincing than a low-volume move above resistance.
What Could Send Bitcoin Back Below $75K?
The bullish setup isn't guaranteed.
Several factors could trigger a sharp correction.
These include:
- A failed $80K breakout
- Weakening ETF demand
- Excessive long leverage
- Rising funding rates
- Increasing open interest
- Stronger dollar conditions
- A broader stock-market sell-off
- Sudden risk-off sentiment
The most important thing is to watch how Bitcoin reacts when it reaches these levels.
A rejection from $82K followed by a controlled pullback is very different from a sudden collapse through multiple support zones.
Is Bitcoin Going to $100K?
This is probably the question most traders want answered.
Bitcoin reaching $100K is possible, but the market still has several hurdles to clear first.
The most important one is $80K–$82K.
If Bitcoin can turn that region into support, the probability of a move toward higher levels increases.
The potential path could look something like:
$82K breakout → $85K → $90K → $95K → $100K
But markets rarely move in straight lines.
Bitcoin could also break above $82K, pull back, retest the breakout and then continue higher.
That type of price action can actually be healthier than a vertical move because it gives the market time to establish support.
The Most Important Bitcoin Signal Right Now
Don't focus on a single Bitcoin price prediction.
Instead, watch the relationship between price and market data.
If Bitcoin rises while:
- ETF inflows remain strong
- Spot volume increases
- Open interest remains controlled
- Funding stays reasonable
- Liquidations remain balanced
the rally could have a stronger foundation.
But if BTC rises while leverage becomes extreme, funding becomes heavily positive and open interest explodes, the market could become vulnerable to a sudden correction.
This is where data can be more useful than headlines.
Bitcoin $80K: Bullish Breakout or Trap?
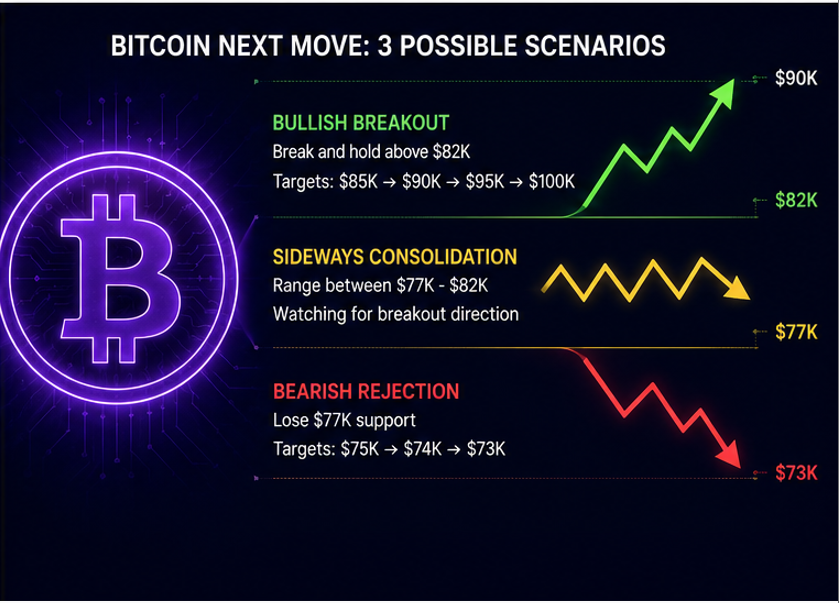
Bitcoin's return toward $80K has put the market at another major decision point.
Above $80K–$82K, bulls have an opportunity to prove that Bitcoin has entered a new upward phase.
Below $77K, short-term momentum could begin weakening.
And between those levels, Bitcoin may simply continue consolidating while traders wait for the next catalyst.
The important thing isn't predicting the exact candle that comes next.
It's understanding what the market is telling you when that candle appears.
Final Bitcoin Price Prediction
Bitcoin's move toward $80,000 has created one of the most interesting technical battles of the current market.
The immediate question is whether BTC can establish $80K–$82K as support after breaking through it.
If that happens, $90K, $95K and eventually $100K could become increasingly important upside targets.
If Bitcoin gets rejected and loses $77K, traders could instead watch the $75K and $73K–$74K zones.
The biggest mistake is to assume that one indicator can predict Bitcoin's next move.
The strongest analysis comes from combining:
Price + volume + ETF flows + open interest + funding + liquidations + macro conditions.
Bitcoin doesn't need to tell traders where it will go.
It only needs to show which levels it can hold. Check Bitcoin Premium Latest Forecast here (Becoin.net BTC FORECAST)
Check Becoin.net Tariff Plans
And right now, $80K is the level everyone is watching.

Can You Start Trading with $10 on Deriv?
A lot of beginners enter trading with the same question: “Is $10 actually enough to start trading on Deriv?” The short answer is yes. But the real answer is more complicated. You can start with $10 on Deriv, but whether you can survive, learn, and grow that account depends entirely on your expectations, discipline, and […]

Bitcoin slips to $65,741 as oil and yields test the breakout
Bitcoin is near $65,741 as rising oil and Treasury yields test the $65.7K breakout floor. Here are the levels that confirm or invalidate the move.

How Liquidity Affects Day Trading Results
When I first started trading day trading, I believed success was all about finding the perfect indicator. I spent weeks testing moving averages, RSI settings, support and resistance levels, and dozens of YouTube strategies that promised easy wins. Some worked for a few trades, but most failed. What confused me was that the same setup […]

Which Broker Has the Cleanest Interface? Real Comparison for Beginners in 2026
Looking for the cleanest trading interface in 2026? Compare Binomo, IQ Option, Quotex, Deriv, and more based on speed, layout, usability, mobile experience, and beginner friendliness. When most beginners choose a broker, they focus on bonuses, payouts, or deposit methods. But after testing multiple platforms for months, I realized something surprising: A messy interface can […]

Which Broker Has Faster Withdrawals? Real 2026 Comparison for Traders
When most beginners choose a broker, they focus on bonuses, signals, or flashy interfaces. But after trading for a while, you realize one thing matters more than almost anything else: How fast can you actually withdraw your money? A broker can look perfect until your first withdrawal request gets stuck in “processing” for three days. […]

Deriv vs IQ Option for Synthetic Indices: Which Platform Is Better in 2026?
Synthetic indices have become one of the most talked about trading categories among beginners and experienced traders alike. Unlike forex or crypto markets that depend on real world events, synthetic indices operate 24/7 using algorithm driven price movements. That means traders can access opportunities at any time without waiting for market openings or major news […]