USD/INR Forecast: 95.50 Coils Under the 96.50 Ceiling
USD/INR forecast: a market that stopped moving
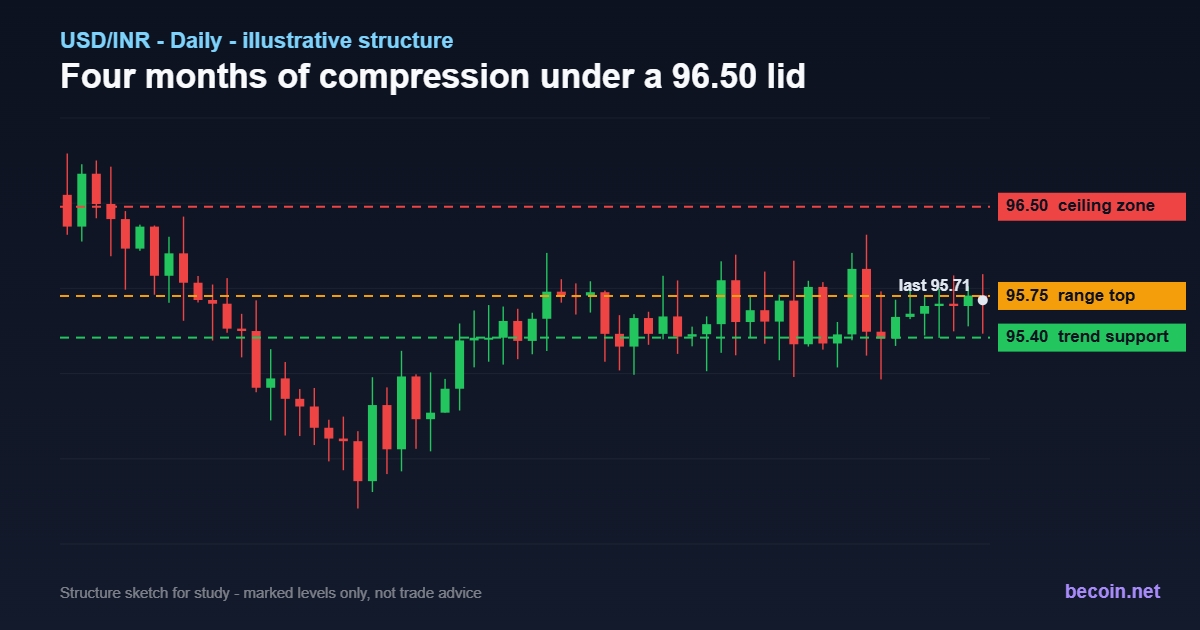
The most interesting thing about USD/INR right now is how little it does. The pair finished the week of 28 August somewhere around 95.45 to 95.55, and it has barely left a rupee-and-a-half band since May. The ten-day range has been roughly 95.40 to 95.50. For a currency that travelled from 89.86 in early January to just under 97.00 by 20 May, that is a remarkable change of character.
Compression like this is not boredom. It is a market with two large forces cancelling each other out, and those forces are easy to name: a dollar that keeps finding reasons to firm, and a central bank that keeps selling into every approach to the highs.
The level map
96.50 to 96.85 is the ceiling zone. The record high sits just under 97.00, and the 96.50 area is where a long-standing downward trendline from the spring highs intersects. Community chartists have been fading rallies into 96.50 to 96.80 all summer, and so far the tape has rewarded them.
96.00 is the psychological line that matters most for headlines. A sustained close above it would tell you the next depreciation leg has started rather than being threatened.
95.55 is the 20-period exponential average and the immediate lid. 95.40 is the rising trendline underneath. Those two lines are the cage, and price has been bouncing between them for weeks with RSI oscillating in a 40 to 60 band. That is textbook consolidation, not distribution.
Below the cage, the retracement ladder of the whole 2026 up-leg runs 93.79, then 91.88, then 90.33, with the 88.78 area marking the level where a genuine trend change would be argued.
What the RBI is actually doing
The Reserve Bank is not defending a number. It is smoothing a pace. State-run banks sell dollars whenever the pair pushes toward its record, then step back once the move settles. That behaviour produces exactly the chart you see: sharp rejections at the top of the range, no follow-through on the downside.
The policy backdrop supports the same read. The repo rate was held at 5.25% in June alongside a capital-account package designed to widen foreign access to Indian government bonds and remove several FPI limits. The bank also closed its FCNR deposit facility early after drawing roughly 57 billion dollars. These are the actions of an institution managing flows, not fighting a trend.
The two forces pressing on the rupee
On one side, the dollar. Headline PCE near 3.7% has kept the possibility of further Fed tightening alive rather than easing, and the dollar index around 99 reflects that. Jackson Hole commentary in late August was the week's swing factor and left the hawkish read intact.
On the other, India's own import bill. The country sources roughly 85% of its crude from abroad, so Brent above 90 dollars flows almost directly into the current account. A partial easing of Middle East supply risk briefly helped the rupee in late August, but dollar strength swamped it.
Layered underneath both is the tariff story. Steep US duties on Indian exports and the associated pressure over Russian crude purchases have driven substantial foreign portfolio outflows through 2026, which is the slow leak beneath the fast headlines. Traders who want that macro layer mapped against specific levels rather than narrative can work through the structured setups on the Becoin.net Premium Forecast desk.
Scenarios into the autumn
Range holds. The base case. The pair keeps oscillating between roughly 95.40 and 95.75, occasionally probing 96.00, with the RBI capping anything above. Most H2 forecasts sit in a 93 to 96 corridor.
Upside break. A daily close above 96.00 that holds, followed by a push through 96.50, opens the record and turns 96.00 into support. This most likely needs a genuine dollar catalyst rather than a domestic one.
Downside resolution. Losing 95.40 and then 94.16 would put the retracement ladder in play, starting at 93.79. That path usually needs oil to fall meaningfully and FPI flows to turn positive at the same time.
The round number of 100 sits in the background of most commentary as the level nobody expects to be allowed through this year. That is a market belief about intervention rather than a stated policy target, and it should be read as such.
How to use these levels
Ranges reward patience and punish size. The practical approach is to trade the edges rather than the middle, keep expectations proportionate to a band barely 0.4% wide, and accept that the breakout, when it comes, will be driven by a headline rather than a chart pattern. Traders comparing spreads and account tiers for a low-volatility pair where costs eat a large share of the move can compare the options on Becoin.net Tariff Plans.
This analysis is educational and is not investment advice. Levels will need refreshing as new data arrives.

Is Capital Core Safe or a Scam? What Day Traders Should Know Before Depositing
I’ll be honest: the first time I landed on Capital Core, I didn’t feel excited. I felt suspicious. That might sound strange coming from someone who has spent years around day trading and offshore brokers, but if you’ve traded long enough, you know the pattern. A polished homepage. Big payout claims. A low minimum deposit. […]

The Best Broker Without Complicated Features (And Why Simplicity Wins)
Most traders don’t fail because they lack knowledge. They fail because their platform buries them in noise before they even place their first trade. Here’s what actually works. It Started With a Confession From a $10 Trader A reader messaged us a few months back. He had been trying to trade for three weeks, had […]

Deriv vs Binomo Deposit Methods: My 2026 Real Money Comparison Guide
I sat in the corner of a crowded coffee shop, my eyes fixed on my phone screen. After months of testing strategies on a demo account, I had finally saved up a small pocket of risk capital. I felt ready to trade live. A high-probability setup was forming on my charts, and my heart rate […]

Why Traders Move from Binomo to Deriv in 2026: The Real Reasons Behind the Switch
If you spend enough time around trading communities, you’ll notice a pattern. Many traders start with Binomo. Then, after a few months, a surprising number begin looking at Deriv. Some switch completely. Others keep both accounts but gradually move most of their trading activity to Deriv. I noticed this trend while talking to beginner traders […]

Which Broker Has the Cleanest Interface? Real Comparison for Beginners in 2026
Looking for the cleanest trading interface in 2026? Compare Binomo, IQ Option, Quotex, Deriv, and more based on speed, layout, usability, mobile experience, and beginner friendliness. When most beginners choose a broker, they focus on bonuses, payouts, or deposit methods. But after testing multiple platforms for months, I realized something surprising: A messy interface can […]

Which Broker Has Faster Withdrawals? Real 2026 Comparison for Traders
When most beginners choose a broker, they focus on bonuses, signals, or flashy interfaces. But after trading for a while, you realize one thing matters more than almost anything else: How fast can you actually withdraw your money? A broker can look perfect until your first withdrawal request gets stuck in “processing” for three days. […]