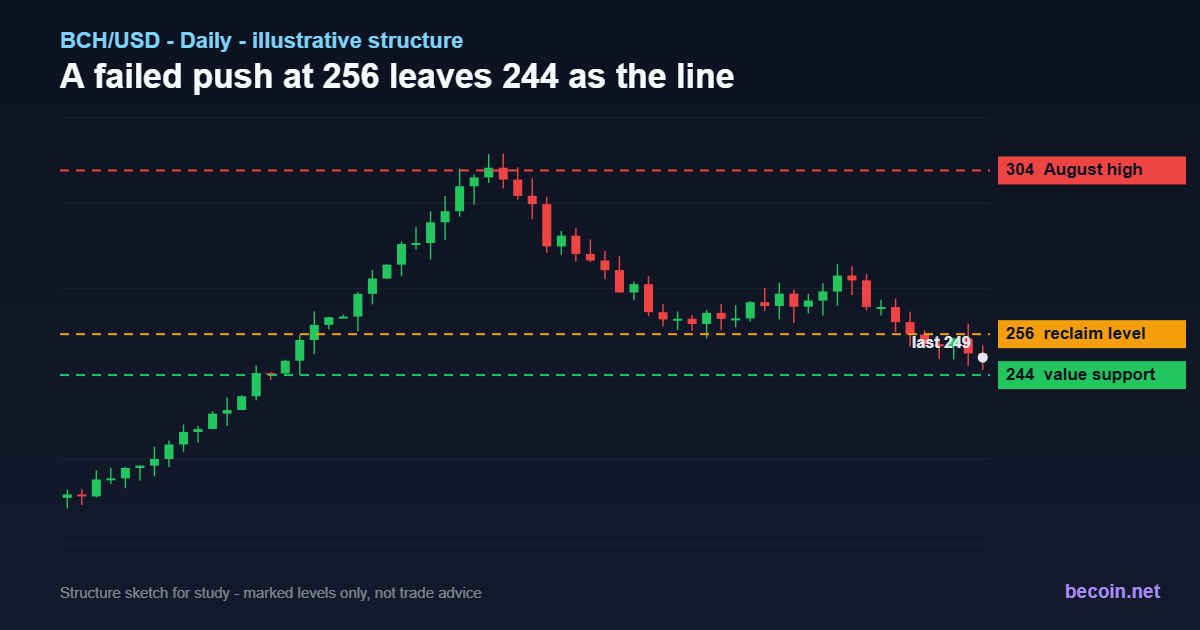
Bitcoin Cash Forecast: BCH Fades at 256 With 244 the Line
Bitcoin Cash forecast: a 29% week that ended badly
Bitcoin Cash spent August doing two contradictory things. It rallied roughly 29% over seven days and 21% over the month, taking price from a 205 low at the start of August up to 303.91 on 22 August. It also finished the month around 250, roughly 45% below where it stood six months ago and down more than half on the year.
Both facts are true, and the tension between them is the whole setup. This is a deeply damaged chart producing a violent counter-trend bounce, and the question the next fortnight answers is whether that bounce was the start of a base or the last gasp of a downtrend.
The 29 August session made the bear case concrete. Price failed at resistance, dropped roughly 7%, and liquidated more than a million dollars of leveraged longs in the process. That is the signature of a crowded bounce meeting real supply, not of accumulation.
The level map
256 is the level that decides the near-term bias. It is the seven-day exponential average and the price the failed breakout rejected from. Until BCH closes above it, every rally is a lower high.
251 is the midpoint of the whole August range and is where price is currently sitting. 244 is the value-area low underneath it, and it is the more meaningful support because it marks where volume actually traded rather than where a line sits.
239 is the deeper retracement level. Losing it would put the 205 low back in scope and would argue that the August rally was a relief rally inside a downtrend.
263.54 is the first genuine resistance above the reclaim level, and 303 is the August swing high. That is the real breakout line. Nothing above 256 changes the structural picture until 303 goes.
Underneath all of it sits a 185 to 240 band that has absorbed several months of selling, with longer-timeframe momentum readings near multi-year lows. That base is why bulls keep showing up.
What is actually driving it
Honestly, not much that is coin-specific. The May 2026 network upgrade activated four improvement proposals that widened what can be expressed on-chain, and node software received a meaningful performance release in late July. Both are real engineering, and neither is the kind of catalyst that reprices an asset by 30%.
What moved BCH in August was correlation. When hawkish central-bank commentary took a large slice off total crypto market capitalisation on 28 August, Bitcoin Cash fell around 9% with everything else. That is the honest read: BCH is currently trading as a high-beta expression of the broad crypto tape rather than as a story of its own.
Two things worth clearing up, because they circulate a lot. There is no Bitcoin Cash halving in 2026 - the last one was April 2024 and the next lands around 2028. And there is no ETF or institutional-flow angle here of the kind that has supported the majors. Traders who want the beta relationship expressed as conditional level plans rather than as narrative can work through the setups on the Becoin.net Premium Forecast desk.
Scenarios
Base building. BCH holds 244, reclaims 256, and grinds toward 263 and then the 285 to 303 supply band. This is the constructive path and needs the broad crypto tape to stabilise first.
Range. Price oscillates between 244 and 256 for several weeks while volatility drains out. Given how far the asset has fallen, this is arguably the healthiest outcome and the most common one after a failed breakout.
Breakdown. A close under 239 opens the 205 to 215 zone. That region is the multi-month base, and a retest of it would be normal rather than catastrophic, but it would confirm that the August rally was a bounce.
Note that feed prices for BCH vary meaningfully between venues right now, so anchor decisions to your own exchange's tape rather than to an aggregate.
How to use these levels
The practical framing is simple. Above 256, treat the August low as the invalidation and the 303 high as the objective. Below 244, treat rallies as supply. Between them, do less. High-beta altcoins punish oversized positions in exactly this kind of chop, and the cost of holding matters as much as the entry - traders comparing account tiers and fee structures for that kind of activity can review the options on Becoin.net Tariff Plans.
This analysis is educational and is not investment advice. Crypto markets are volatile and levels will need refreshing as new data arrives.

Bitcoin slips to $65,741 as oil and yields test the breakout
Bitcoin is near $65,741 as rising oil and Treasury yields test the $65.7K breakout floor. Here are the levels that confirm or invalidate the move.

Trading Currency Strength Instead of Single Pairs
It was a Tuesday afternoon when I realized I was fighting a losing battle against a ghost. My screen was a chaotic web of indicators. I had the EUR/USD chart open, a moving average crossing over here, a relative strength index flashing oversold there, and a price action setup that looked textbook perfect. I clicked […]

The Best Broker Without Complicated Features (And Why Simplicity Wins)
Most traders don’t fail because they lack knowledge. They fail because their platform buries them in noise before they even place their first trade. Here’s what actually works. It Started With a Confession From a $10 Trader A reader messaged us a few months back. He had been trying to trade for three weeks, had […]

Fastest Withdrawal Brokers (Real Test Results)
The first time I made a profitable trade, I wasn’t thinking about strategy anymore. I was thinking about one thing. Can I actually withdraw this? I requested my payout and waited. And waited. That “processing” label stayed there longer than my trade itself. That moment changed how I evaluate brokers. Since then, I’ve made it […]

EUR/USD holds 1.1414 before the ECB decision: three scenarios
EUR/USD traded near 1.1414 before the ECB’s July decision. Here is what a hold, hawkish hold or surprise hike could mean for 1.1350 and 1.1480.

WTI reaches $89.43 as Brent clears $95 on renewed supply risk
WTI traded near $89.43 while Brent moved above $95 as Middle East shipping risk lifted crude for a fifth session. Key levels, catalysts and invalidation.