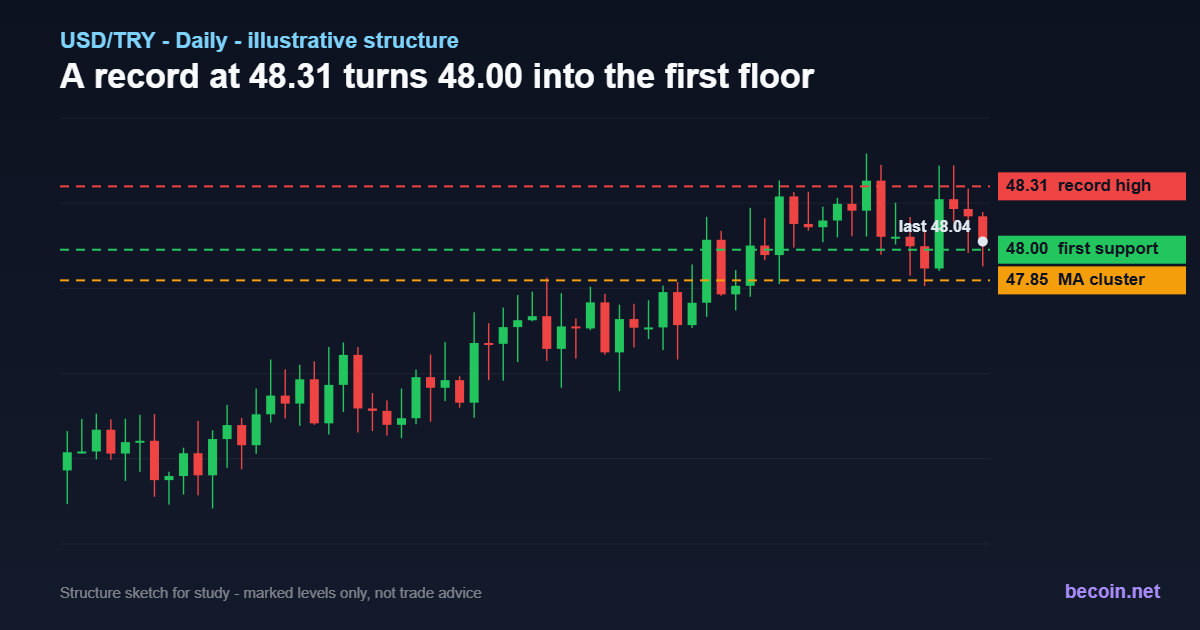
USD/TRY Forecast: A 48.31 Record With 48.00 the New Floor
USD/TRY forecast: where the pair actually sits
USD/TRY closed out the final full week of August around the 48.20 area, a stone's throw from the 48.31 print that stands as the highest level the pair has ever traded. The move above 48.00 on 21 August was the headline, but the more useful observation is how it happened: no gap, no panic candle, just another set of small-bodied green bars grinding a fraction of a percent higher.
That texture matters. A currency in crisis moves in jumps. The lira is not doing that. It is doing something quieter and, for traders, harder to fade - a managed depreciation in which every month prints a new high and no month prints a memorable low. January's record near 43.30 gave way to 45.50 in May, roughly 46.00 in June, 47.20 in July and now 48.31.
The level map
Three numbers frame the next few weeks.
48.31 is the ceiling by definition. There is no historical supply above it, which is exactly why breaks tend to extend rather than reverse - there is nobody trapped up there waiting to sell into a rally.
48.00 is the level that changed jobs. It capped the pair for most of August and now sits underneath it. A daily close back below 48.00 would be the first genuine sign that the crawl has paused.
47.85 to 47.95 is where the 50-, 100- and 200-day averages have compressed into a single band barely a tenth of a lira wide. That compression is not an accident. It is the mathematical signature of a market that trends at a near-constant rate, and it means the averages offer almost no cushion if a genuine reversal ever arrives - they would all break in the same session.
Momentum backs the trend without screaming: RSI in the low 60s, a positive MACD, and a Williams reading that has been pinned near the overbought boundary for weeks without producing anything resembling a top.
Policy is the whole story
The central bank has now held its policy rate at 37% through four consecutive meetings, with language pointing to a restrictive stance until price stability returns. July inflation came in at 31.75% year on year, down from 33.52%, and the bank nudged its own end-2026 projection up to 28% in mid-August, blaming energy costs.
The arithmetic looks fine on paper. It looks different from a household balance sheet. Household inflation expectations sit near 45%, firms are closer to 32.5%, and market economists nearer 24%. Only a small minority of households expect prices to fall at all. When rents are rising above 45% and transport above 50%, a 37% policy rate is not obviously restrictive for the people setting wages and lease renewals - and that gap between the official rate and lived inflation is precisely what keeps the currency drifting.
The carry trade underneath it
A 37% deposit rate against a currency depreciating in the low teens annually is a profitable trade until it suddenly is not. That is the position much of the foreign money in Turkish assets currently occupies, and it explains the shape of the chart better than any pattern would. Carry investors do not want a strong lira; they want a predictable one. The central bank's willingness to let the pair grind rather than jump is what keeps them there.
The vulnerability is equally clear. A trade deficit near 6% of GDP, a budget that swung back to a heavy shortfall in August, and modest net reserves mean the smoothing operation is expensive. Any shock that forces the pace to accelerate - an oil spike through the import bill, a political surprise, or a sharp global risk-off episode - turns a comfortable carry into a crowded exit. Traders working through structured level plans on the Becoin.net Premium Forecast desk tend to size lira exposure with that asymmetry in mind rather than with the volatility the chart currently displays.
Scenarios worth mapping
Continuation. The pair holds 48.00 on any dip and works toward the 48.50 to 49.00 zone through September. This remains the path of least resistance and is broadly where sell-side desks sit, with several looking for the high 40s into year end.
Pause. A close under 48.00 that also loses the 47.85 average band would signal that the authorities have slowed the pace deliberately, most likely around a reserve-building window. Expect a sideways grind rather than a reversal.
Break. Genuine lira strength would need a real-rate shift - either an unexpected hike or a faster disinflation than the central bank's own forecast. Nothing in the current data argues for it, which is why it belongs in the tail of the distribution rather than the base case.
How to use these levels
Treat 48.00 as the line that defines the regime and 48.31 as the trigger for continuation. Position size around the fact that carry currencies pay slowly and correct quickly. Traders comparing execution costs, spreads and account tiers before committing capital to a high-carry pair can review the options on Becoin.net Tariff Plans and match the structure to their holding period.
This analysis is educational and does not constitute investment advice. Levels are drawn from recent price action and will need refreshing as new data arrives.

EUR/USD holds 1.1414 before the ECB decision: three scenarios
EUR/USD traded near 1.1414 before the ECB’s July decision. Here is what a hold, hawkish hold or surprise hike could mean for 1.1350 and 1.1480.

Binomo Verification (KYC) for First Withdrawal: Exact Documents That Usually Trigger Rejection
The first time I tried to withdraw from Binomo, I was not worried about the trade. I was worried about the paperwork. That probably sounds strange if you are new. Most traders obsess over entries, expiry times, payout percentages, and strategy screenshots. I did too. But the moment I clicked my first withdrawal request, the […]

Is Capital Core Safe or a Scam? What Day Traders Should Know Before Depositing
I’ll be honest: the first time I landed on Capital Core, I didn’t feel excited. I felt suspicious. That might sound strange coming from someone who has spent years around day trading and offshore brokers, but if you’ve traded long enough, you know the pattern. A polished homepage. Big payout claims. A low minimum deposit. […]
Why Most Deriv Traders Blow Accounts: A Data-Driven Post-Mortem Analysis
The first time I blew a trading account on Deriv, it didn’t happen dramatically. There was no single catastrophic trade. It happened quietly. One loss turned into another. Then I increased the stake to recover the loss. Then the market moved again. Before I realized what had happened, an account balance that took weeks to […]

Bitcoin slips to $65,741 as oil and yields test the breakout
Bitcoin is near $65,741 as rising oil and Treasury yields test the $65.7K breakout floor. Here are the levels that confirm or invalidate the move.

Trading Currency Strength Instead of Single Pairs
It was a Tuesday afternoon when I realized I was fighting a losing battle against a ghost. My screen was a chaotic web of indicators. I had the EUR/USD chart open, a moving average crossing over here, a relative strength index flashing oversold there, and a price action setup that looked textbook perfect. I clicked […]