Metrics Every Trader Should Track
I sat in front of my monitors, my face glowing under the harsh light of three flickering screens. It was 3:15 PM on a rainy Tuesday, and my trading account was down nearly 18% for the month. The worst part was that I could not figure out why.
I had been following my charts, waiting for clean market structures, and reading liquidity sweeps. Every entry felt right when I clicked buy or sell, yet my account equity curve kept sloping downward.
Like most traders, I fell into the trap of measuring my progress purely by daily profit and loss. When I made $500, I was a genius. When I lost $400, I blamed bad luck, spread manipulation, or unpredictable market news.
Everything changed when I stopped treating my trading as a casino and started treating it as an analytical business. I opened a spreadsheet, pulled six months of raw execution data, and calculated six specific metrics. That single afternoon revealed why I was losing money and showed me exactly how to fix it.
If you want to trade professionally across major global markets, looking at your net profit at the end of the day is not enough. Here are the core metrics every serious trader must track to survive and grow a portfolio.
Expectancy: The Math Behind Your Trading Strategy
When I finally analyzed my data, I discovered my strategy was mathematically doomed. I had a decent win rate, but my losses were systematically chewing through my gains. That was when I calculated my trading expectancy.
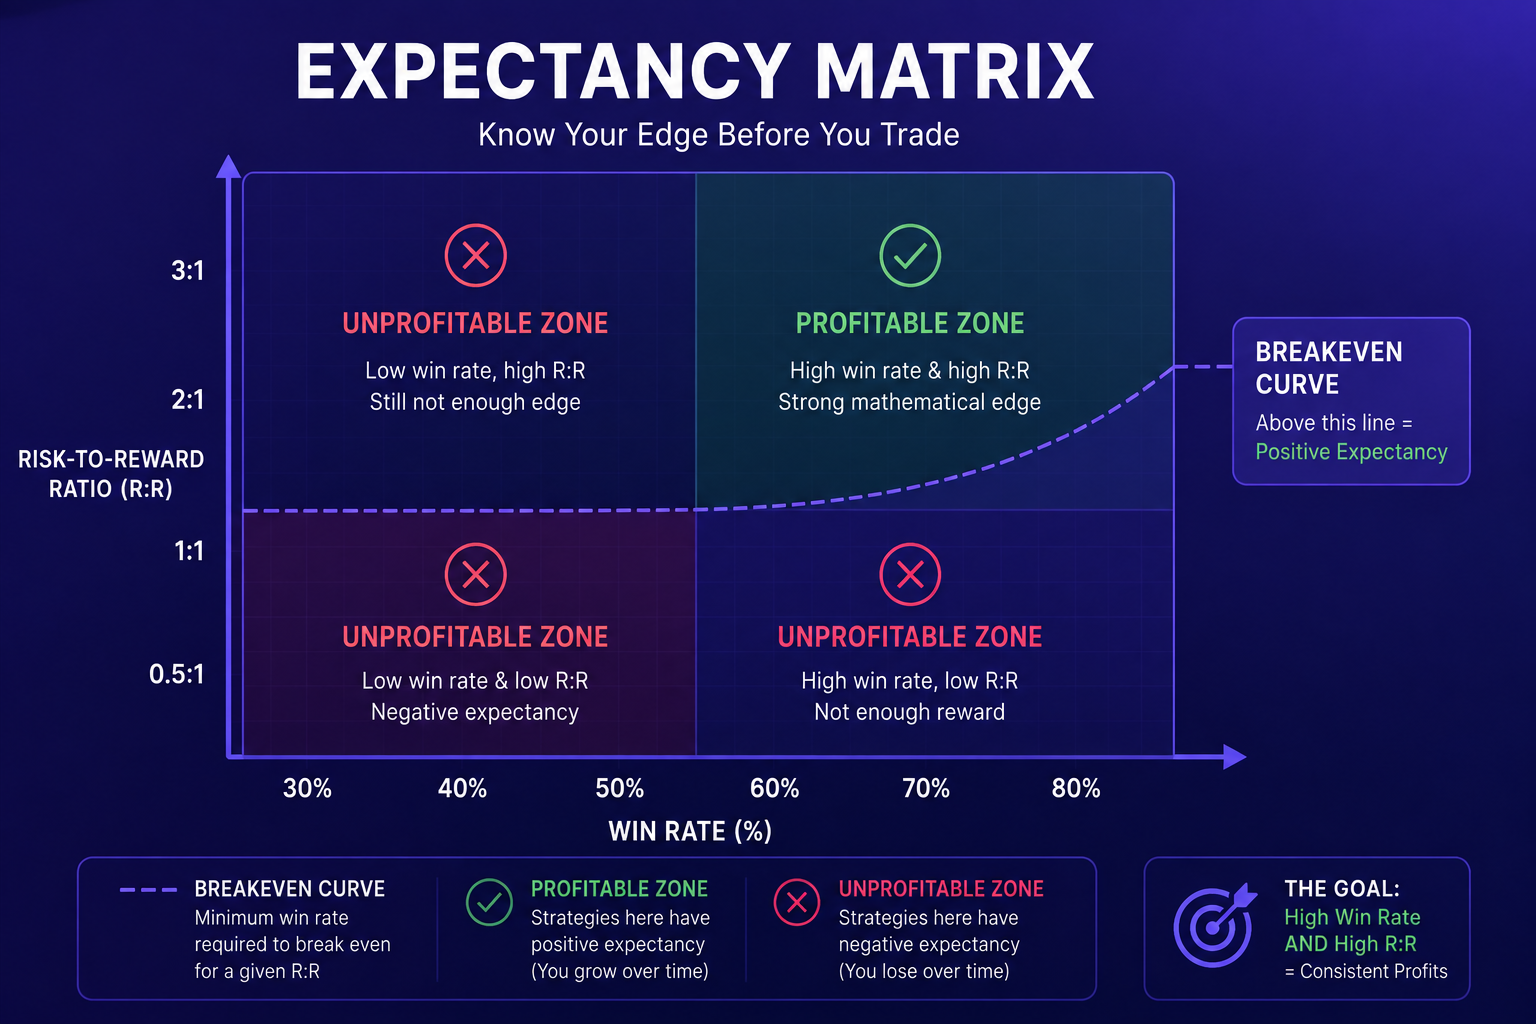
Expectancy tells you the average dollar amount you can expect to win or lose on every single dollar you risk. It combines your win rate with your average reward-to-risk ratio.
$$\text{Expectancy} = (\text{Win Rate} \times \text{Average Win}) - (\text{Loss Rate} \times \text{Average Loss})$$
If your expectancy is negative, you will eventually go broke, no matter how good your setups look. If your expectancy is positive, time and the law of large numbers become your greatest allies.
When I started tracking expectancy, I realized I needed platforms that provided execution precision and competitive spreads across multiple asset classes. Testing setups on reliable execution venues like Deriv allowed me to collect clean data without execution delays muddying my statistics.
To dive deeper into analyzing your operational baseline, read How to Measure Strategy Consistency in Trading on the BeCoin blog.
Maximum Drawdown and Recovery Factor: Understanding Your Risk Limits
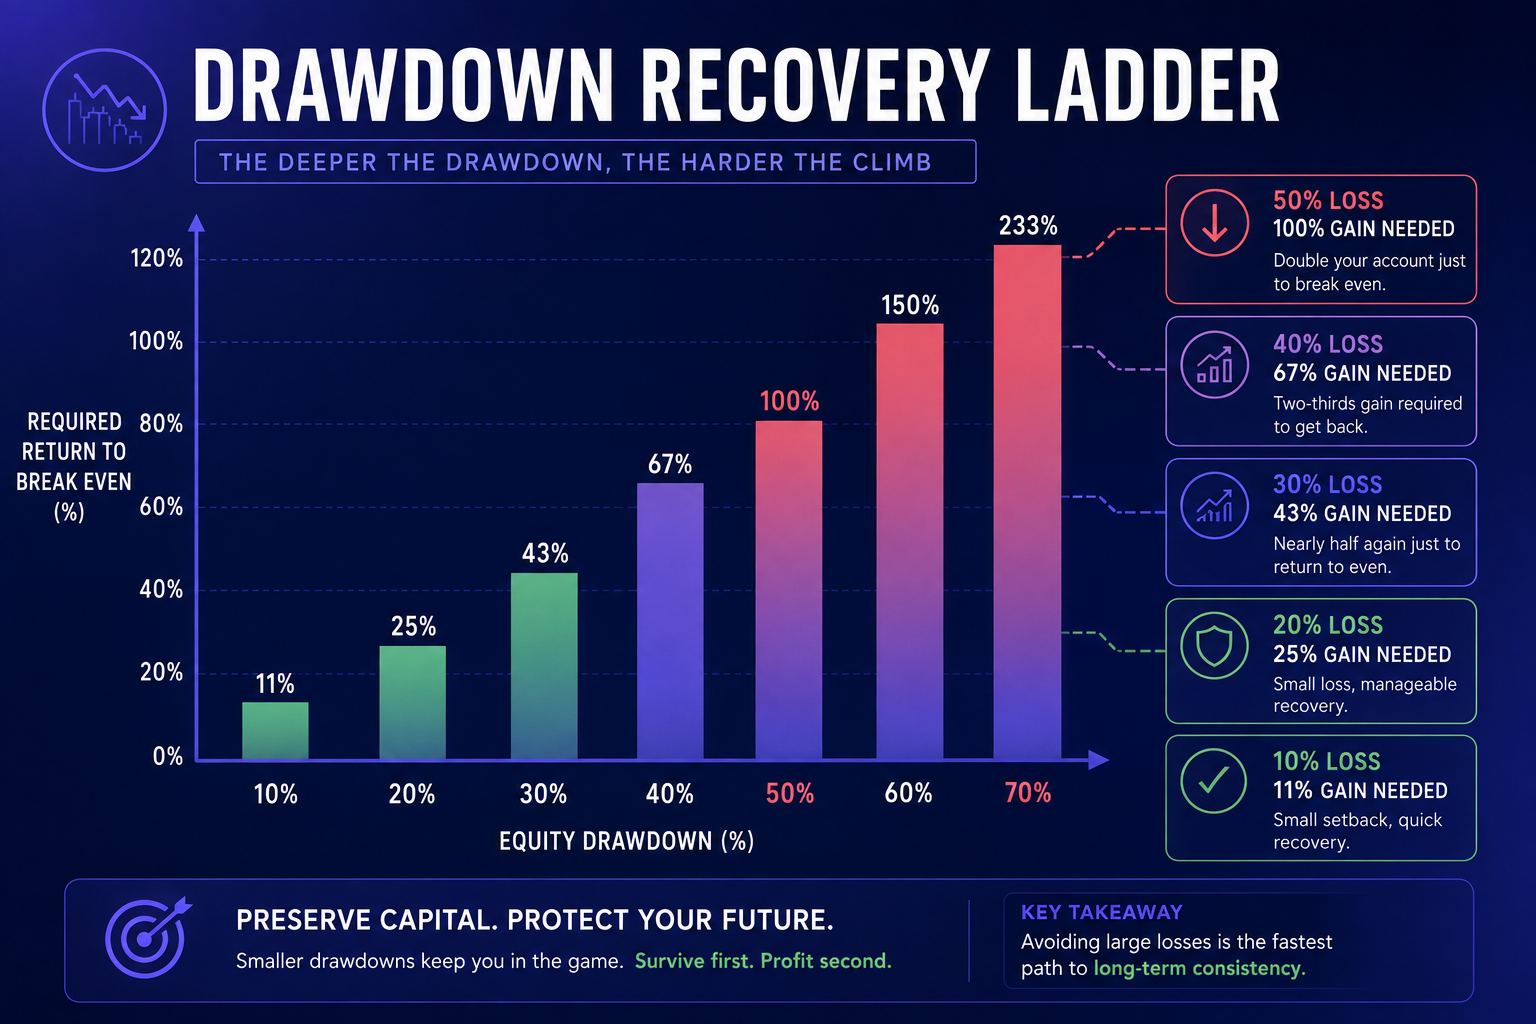
My early spreadsheet revealed a scary pattern. Every few weeks, I would hit a patch of five or six consecutive losses that wiped out two weeks of methodical gains. My maximum drawdown—the peak-to-trough decline in account equity—was reaching 22%.
Maximum drawdown is the ultimate indicator of your risk management discipline. It measures the biggest percentage drop your account experiences before hitting a new high.
$$\text{Maximum Drawdown \%} = \frac{\text{Peak Equity} - \text{Trough Equity}}{\text{Peak Equity}} \times 100$$
A high drawdown creates a severe psychological burden because of the math of recovery. If you lose 10% of your account, you need an 11.1% gain just to break even. If you lose 50% of your account, you need a 100% gain just to return to where you started.
To complement drawdown tracking, I use the Recovery Factor:
$$\text{Recovery Factor} = \frac{\text{Net Profit}}{\text{Maximum Peak-to-Trough Drawdown}}$$
A Recovery Factor above 3.0 shows that your strategy produces enough net gain to justify the drawdowns you endure along the way.
When I reframed my operational plan around drawdown limits, I adjusted my position sizing and switched to high-liquidity platforms like IQ Option to ensure fast trade management during choppy market conditions.
Win Rate vs. Risk-to-Reward Ratio: Finding Your Equilibrium
Beginner traders often obsess over having an 80% or 90% win rate. Early in my career, I was no different. I wanted to be right on every trade, so I took small profits early and let losing trades breathe, hoping they would turn back around.
Tracking my Win Rate alongside my Risk-to-Reward Ratio (RRR) showed me how dangerous that habit was.
$$\text{Win Rate \%} = \left( \frac{\text{Winning Trades}}{\text{Total Trades}} \right) \times 100$$
$$\text{Risk-to-Reward Ratio} = \frac{\text{Average Winning Trade Amount}}{\text{Average Losing Trade Amount}}$$
Here is the truth: a trader with a 35% win rate and a 1:3 RRR will outperform a trader with a 70% win rate and a 0.5:1 RRR over 100 trades.
- Trader A (High Win Rate): 70 wins at $50 = $3,500. 30 losses at $100 = $3,000. Net Profit = $500.
- Trader B (High RRR): 35 wins at $300 = $10,500. 65 losses at $100 = $6,500. Net Profit = $4,000.
When I recognized this relationship, I stopped cutting winners short. I began using flexible brokers such as Pocket Option and Quotex to practice fixed-risk entries across technical levels, matching my setups with realistic risk-reward parameters.
For a breakdown on choosing structural triggers over simple momentum indicators, see our article on Price Action vs Indicators: Which Actually Works? on the BeCoin blog.
Profit Factor and Sharpe Ratio: Measuring Efficiency
Once your strategy is profitable, the next challenge is evaluating efficiency. Are you making money efficiently, or are you taking massive risks for tiny returns?
Two metrics give you this insight:
Profit Factor
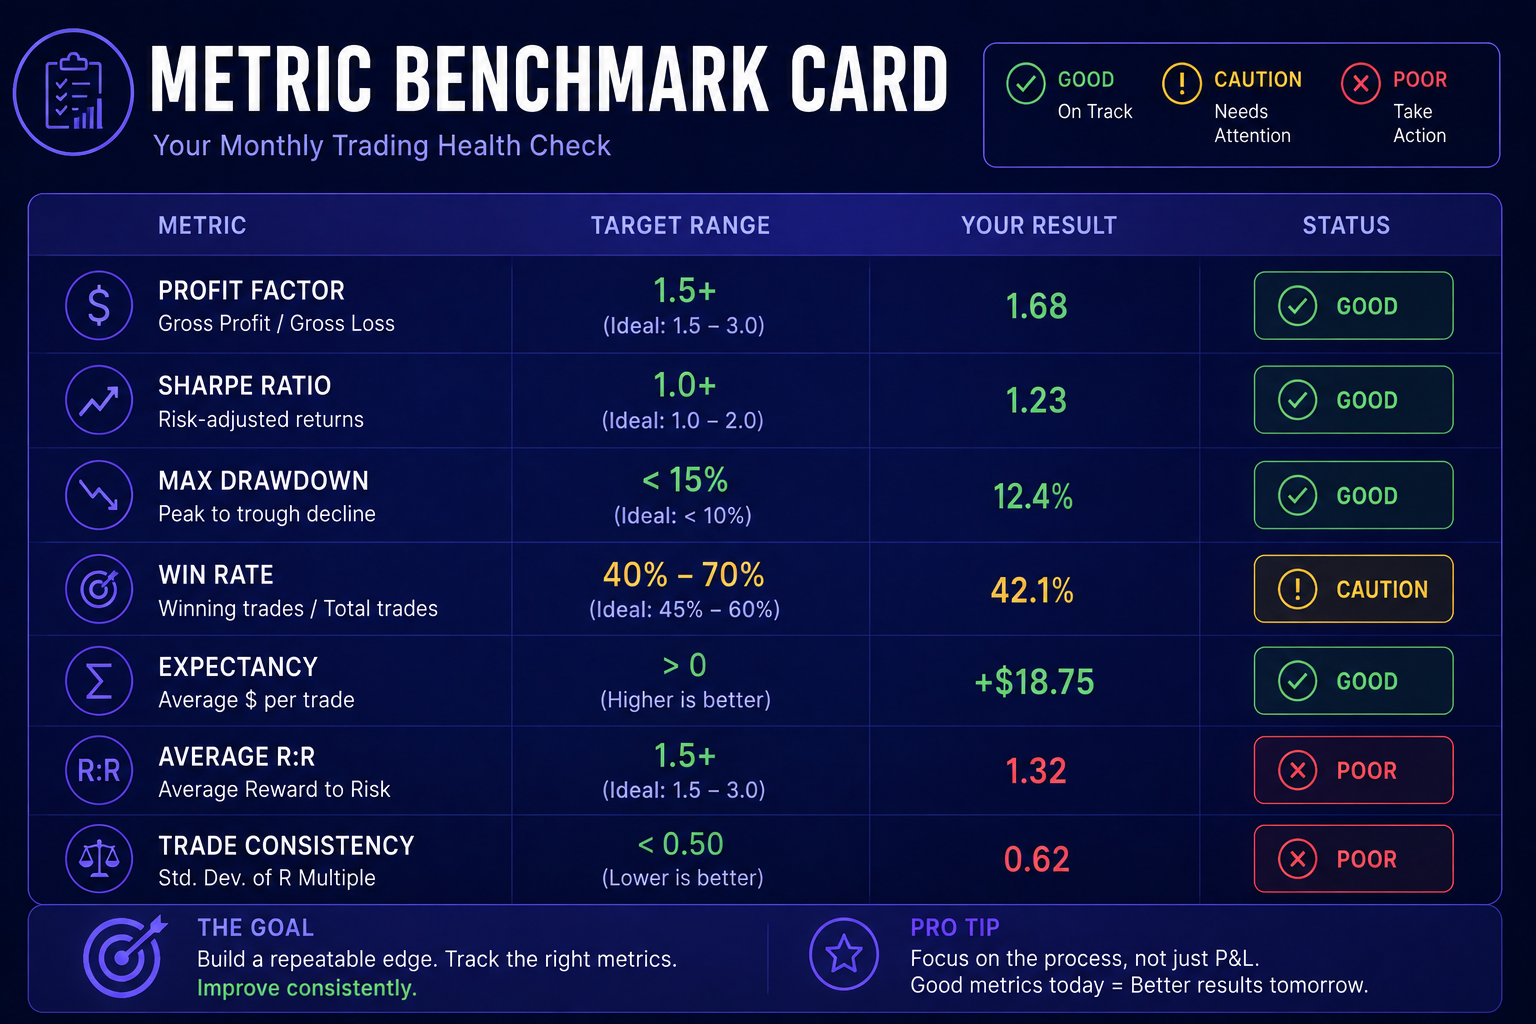
Profit Factor is the gross profits divided by gross losses over a specific period.
$$\text{Profit Factor} = \frac{\text{Sum of Gross Profits}}{\text{Sum of Gross Losses}}$$
- Below 1.0: Unprofitable strategy.
- 1.0 to 1.5: Moderately profitable, needs fine-tuning.
- 1.6 to 2.5: Healthy, professional-grade strategy.
- Above 2.5: Exceptional efficiency (or sample size is too small).
Sharpe Ratio
The Sharpe Ratio evaluates risk-adjusted return by comparing your average return against the volatility of those returns.
$$\text{Sharpe Ratio} = \frac{R_p - R_f}{\sigma_p}$$
(Where $R_p$ is portfolio return, $R_f$ is risk-free rate, and $\sigma_p$ is standard deviation of portfolio return.)
Tracking these figures across short-term execution setups on brokers like Binomo,Expert Option, and Olymp Trade helped me filter out volatile, low-yield trades and focus on high-probability setups.
Average Holding Time and Slippage: The Hidden Costs
Two overlooked metrics that quietly bleed trading accounts are Average Holding Time and Slippage.
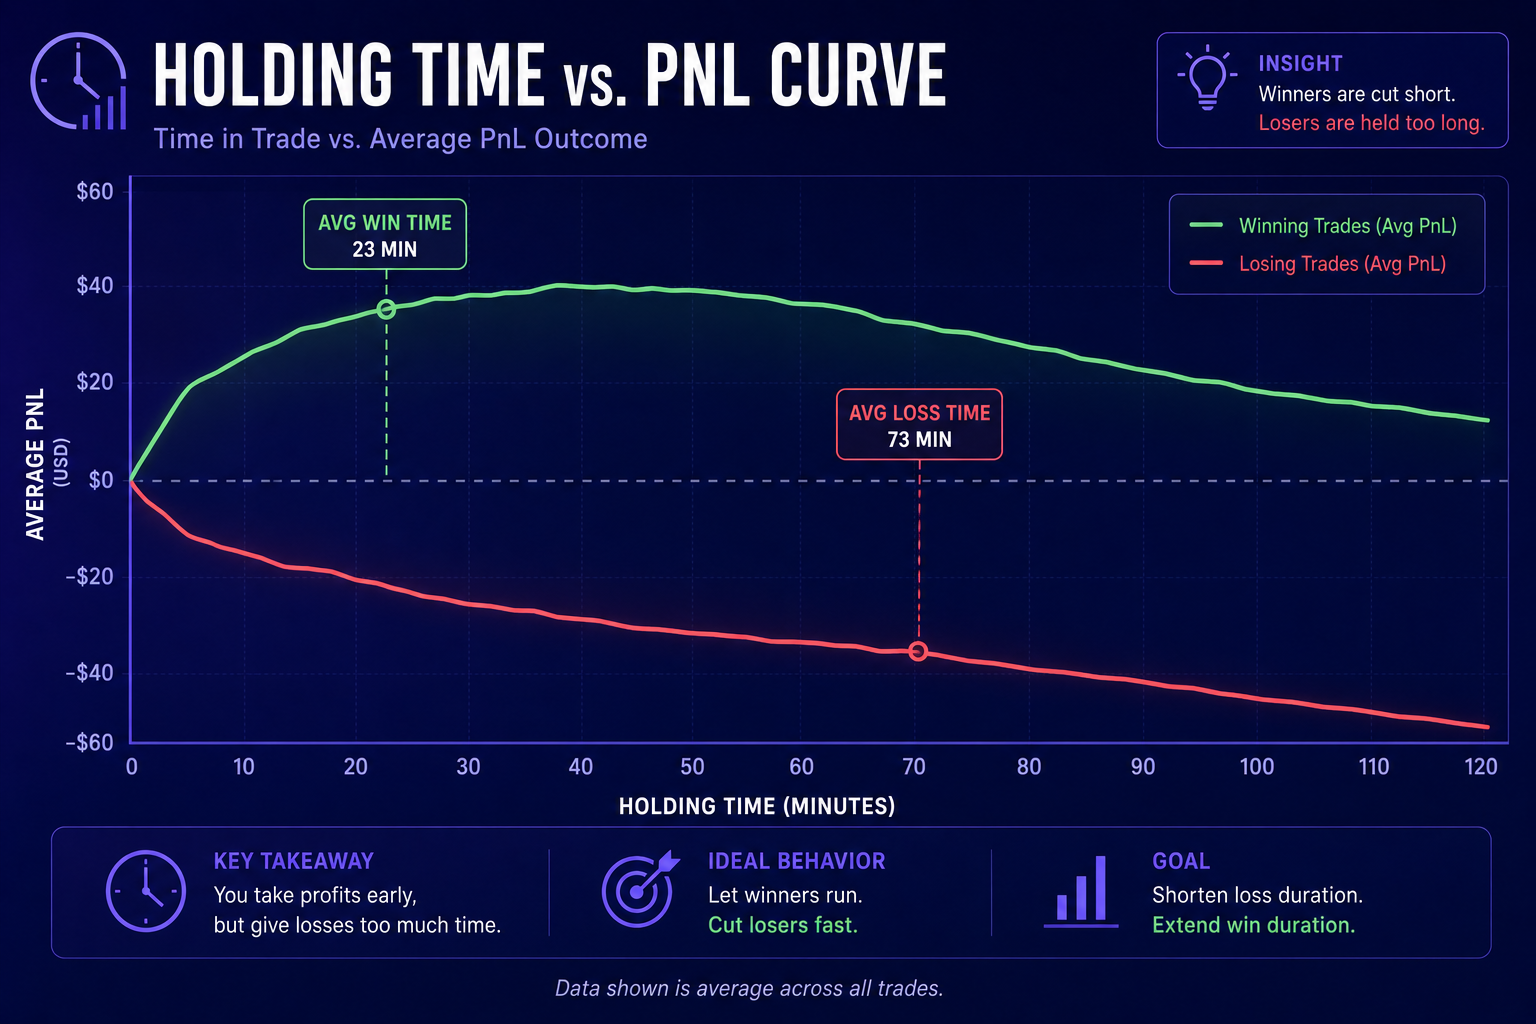
Average Holding Time tracks how long your trades remain open relative to their profitability. When I analyzed my logs, I found that my winning trades took an average of 45 minutes to hit their target, while my losing trades lingered open for over 3 hours. I was holding losers, hoping for a turnaround, while taking quick profits on winners.
Slippage measures the difference between your expected execution price and the actual fill price. High slippage eats directly into your expectancy.
$$\text{Slippage} = \text{Actual Execution Price} - \text{Requested Price}$$
By moving a portion of my portfolio to infrastructure-focused platforms like Capital Core, I reduced fill delays and reclaimed lost margin on fast-moving assets.
If you are expanding into automated setups to cut out execution delays, review Building Your First AI Trading Strategy for a structured overview.
Transform Your Data into an Unfair Market Edge
Tracking metrics transformed my trading from an emotional roller coaster into a structured process. Once I saw my execution statistics clearly, my focus shifted from trying to predict the next candle to managing my statistical edge.
Logging trades manually in a spreadsheet is a great place to start, but analyzing multi-asset setups across volatile markets requires real-time data, regime context, and probability forecasting.
That is why serious traders rely on institutional-grade tools to streamline analysis.
Take Your Trading to the Next Level with BeCoin PremiumIf you are ready to eliminate guesswork and trade with data-backed precision, upgrade to BeCoin Premium.
With a BeCoin subscription, you get direct access to real-time AI forecasts, multi-indicator signals, volatility metrics, and deep market breakdowns across crypto, forex, stocks, indices, and commodities.
- Real-Time AI Signals:Automated probability forecasts updated continuously across multiple timeframes.
- Comprehensive Forecast Hub: Access live market data, key support/resistance levels, and institutional sentiment through our Forecast Hub.
- Advanced Metric Filtering: Sort market setups by Sharpe Ratio, volatility levels, and directional trend strength before taking a trade.
Stop flying blind in the markets. Visit our Tariff Plan Page to pick the plan that fits your trading goals, lock in your edge, and start making decisions based on data today.

Binomo vs IQ Option for Small Accounts: Which Platform Is Better for Beginners in 2026?
Most people entering online trading do not start with thousands of dollars. They start small. Usually with $10, $20, or maybe $50. That small balance changes everything about how a trader behaves. Every loss feels bigger, every win feels emotional, and every mistake has a stronger impact on the account. This is exactly why beginner […]

Binomo First $10–$50 Test Deposit Plan: The Safest Way to Validate the Platform Before Scaling
I didn’t start with confidence. I started with doubt. Every time I searched for answers about Binomo, I found opinions, not proof. Some people claimed fast withdrawals. Others complained about delays. But almost nobody showed a complete journey from deposit to withdrawal using real money. So I stopped reading and started testing. Instead of risking […]

The Clock and the Cash: My Journey into the Hidden Rhythm of Session-Based Trading
There was a time when I thought the global financial market was a single, monstrous wave that never stopped moving. I believed that if I sat in front of my monitors long enough, clicking buttons whenever a pretty pattern appeared on my charts, the market would eventually reward my sheer endurance. I was dead wrong. […]

The Day I Stopped Trading and Finally Started Making Money
It was a rainy Tuesday morning, and I was staring at my screen with a familiar knot in my stomach. The previous three days had been a slow, agonizing slide into the red. I had given back two weeks of hard-earned profits in less than seventy-two hours. Every asset I clicked on looked like a […]

Finding the Best Trading Broker for Side Income: My Raw, First-Hand Journey to Consistent Daily Wins
Six months ago, I sat at my kitchen table staring at an accumulation of household bills, realizing my primary salary was no longer cutting it. I didn’t want a second job that required clocking into a physical location or taking endless boss mandates after hours. I needed a flexible, scalable side income. That night, I […]

The Best Broker Without Complicated Features (And Why Simplicity Wins)
Most traders don’t fail because they lack knowledge. They fail because their platform buries them in noise before they even place their first trade. Here’s what actually works. It Started With a Confession From a $10 Trader A reader messaged us a few months back. He had been trying to trade for three weeks, had […]