NZD/USD Forecast: 0.59551 as the RBNZ Carry Story Returns
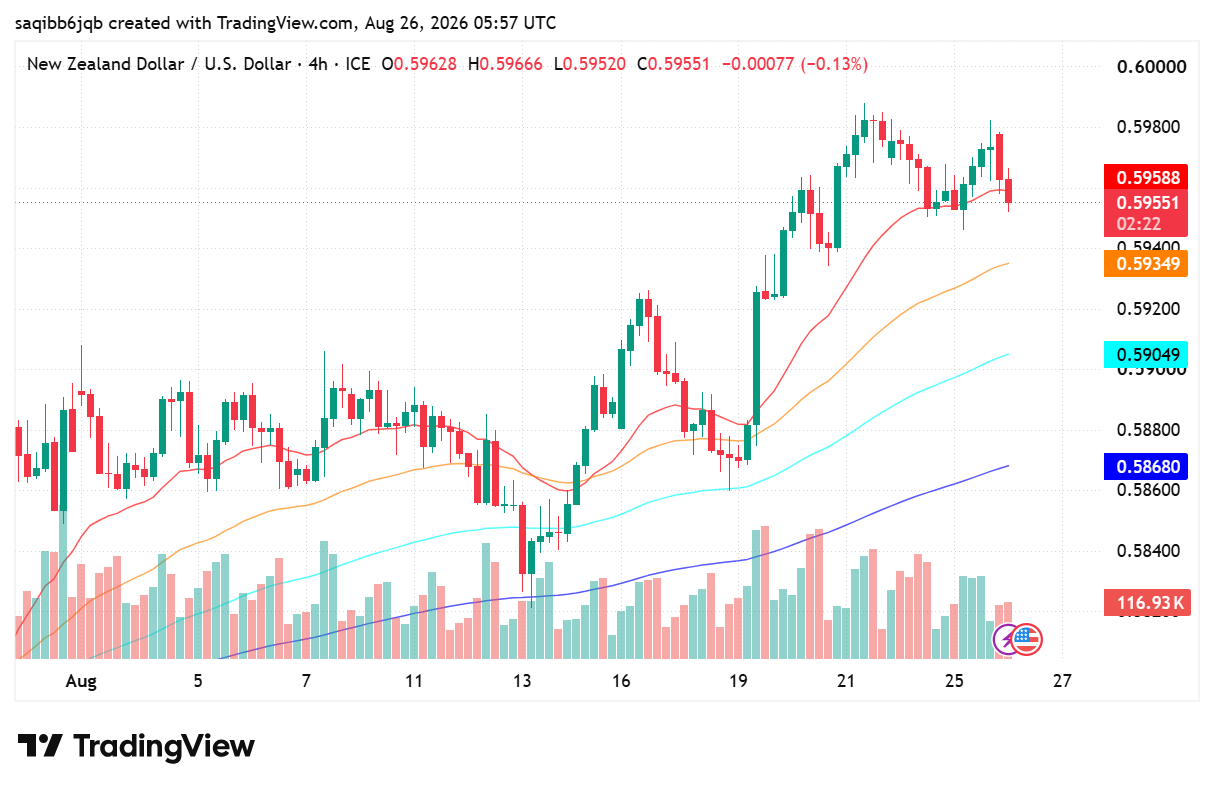
- 0.59551 on the 4-hour chart, down 0.23% on the session and still holding the upper half of August's range.
- The RBNZ lifted the Official Cash Rate to 2.50% on 8 July, its first increase in three years, quietly rebuilding the kiwi's carry appeal.
- 0.59349 is the level that decides whether this week's drift is a pause or a turn.
Fundamental Analysis: NZD/USD
The Reserve Bank of New Zealand raised the Official Cash Rate by 25 basis points to 2.50% on 8 July, ending three years in which the only direction had been down. Six consecutive cuts preceded it, so the move mattered less for its size than for what it signalled: the committee now judges domestic inflation risk to be tilted the other way. For a currency whose bid has depended on relative yield for most of the past decade, that is a structural change rather than a headline.
Against that, the rate gap still favours the dollar by a wide margin. The Federal Reserve held at 3.50-3.75% on 29 July for a fifth straight meeting, but three members dissented in favour of a 25 basis point increase, and futures currently assign roughly a 38% probability to a September hike. US inflation is cooperating only slowly: headline CPI eased to 3.4% in July from 3.5%, with core at 2.5%, the smallest annual increase since February.
What has tipped the balance in the kiwi's favour is neither side's policy rate but the dollar itself. The US Treasury's decision to double liquidity-support buyback operations for longer-dated notes and bonds has pushed the dollar to three-month lows and revived the debasement trade across the board. That makes the current NZD/USD level a dollar story more than a New Zealand one, and it means the upcoming PCE report carries more weight for this pair than anything on the domestic calendar.
Technical Analysis: NZD/USD
The advance that produced the current structure began in the middle of the month, when the pair based near 0.5825 and turned higher through a cluster of moving averages that had been capping it. Price ran to roughly 0.5987 by 25 August before this session's fade. The averages are now stacked in the correct order beneath spot at 0.59349, 0.59049 and 0.58680, which is the signature of a trend that is intact rather than one that is rolling over.
Resistance sits first at the 0.5987 swing high, with the 0.6000 handle immediately above it as a psychological marker. Support begins at 0.59349, then 0.59049. A sustained close beneath 0.58680 would invalidate the read, since that would put price back below the entire moving-average stack and return the pair to the range it spent the first half of August inside.

Trading Currency Strength Instead of Single Pairs
It was a Tuesday afternoon when I realized I was fighting a losing battle against a ghost. My screen was a chaotic web of indicators. I had the EUR/USD chart open, a moving average crossing over here, a relative strength index flashing oversold there, and a price action setup that looked textbook perfect. I clicked […]

EUR/USD holds 1.1414 before the ECB decision: three scenarios
EUR/USD traded near 1.1414 before the ECB’s July decision. Here is what a hold, hawkish hold or surprise hike could mean for 1.1350 and 1.1480.

$10 to $50 Trading Challenge – Strategy + Real Results (Case Study)
Turning $10 into $50 sounds easy until you actually try it. Small accounts expose every weakness in your trading. One bad decision can erase hours of progress, and emotional trading becomes much harder to control when every dollar matters. This case study breaks down how a $10 account was realistically grown to $50 using a […]

How Liquidity Affects Day Trading Results
When I first started trading day trading, I believed success was all about finding the perfect indicator. I spent weeks testing moving averages, RSI settings, support and resistance levels, and dozens of YouTube strategies that promised easy wins. Some worked for a few trades, but most failed. What confused me was that the same setup […]

How Understanding Market Structure Saved My Day Trading
I remember the exact moment my trading account hit zero for the third time in a single month. It was a rainy Tuesday evening, and I was staring at a 1-minute chart on my laptop screen. The price had been moving up aggressively. It looked like a flawless rocket ship to the moon. I clicked […]

The Clock and the Cash: My Journey into the Hidden Rhythm of Session-Based Trading
There was a time when I thought the global financial market was a single, monstrous wave that never stopped moving. I believed that if I sat in front of my monitors long enough, clicking buttons whenever a pretty pattern appeared on my charts, the market would eventually reward my sheer endurance. I was dead wrong. […]