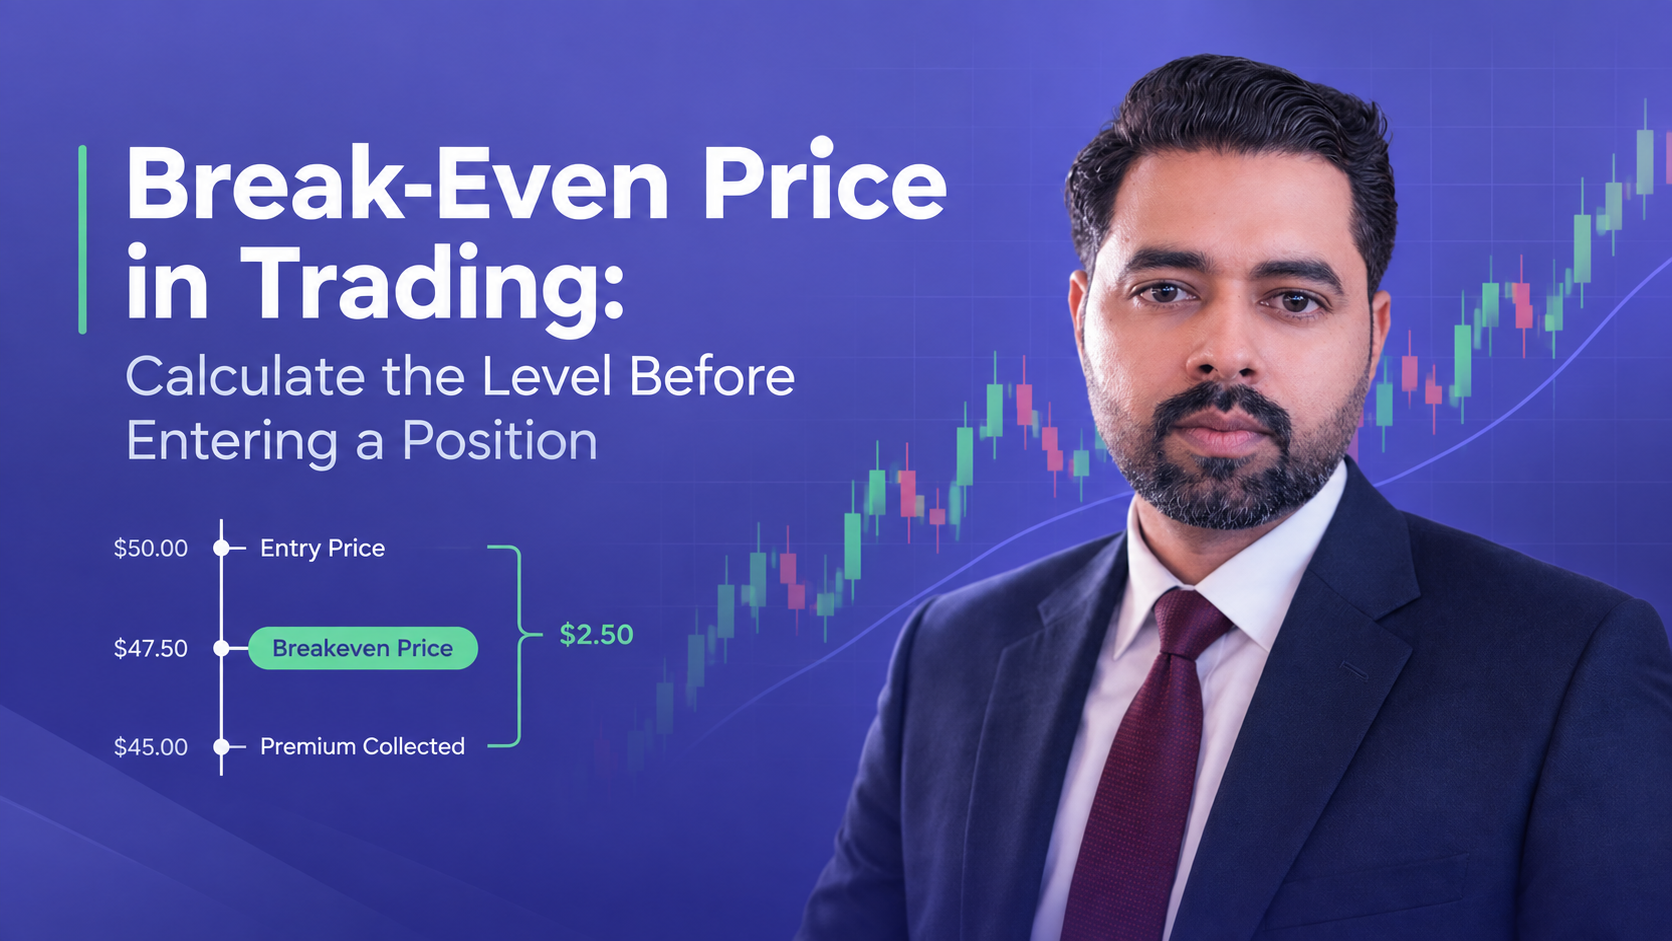
Break-Even Price in Trading: Calculate the Level Before Entering a Position
When I first started trading, I thought making a profit was simple: buy low, sell high. The first time I bought a stock at $100 and sold it at $100.10, I felt like a genius. But when I checked my account balance, my money had actually gone down. Broker fees, exchange costs, and the spread had eaten my entire gain and taken extra cash from my pocket.
That painful lesson taught me that entry price is almost never your real starting point. Your real target is your break-even price. To trade with an edge and access deep market research, check out Becoin Premium to sharpen your strategy today.
What Is the Break-Even Price in Trading?
The break-even price is the exact market price where your trade covers its entry price plus all your trading costs, leaving you with zero profit and zero loss.
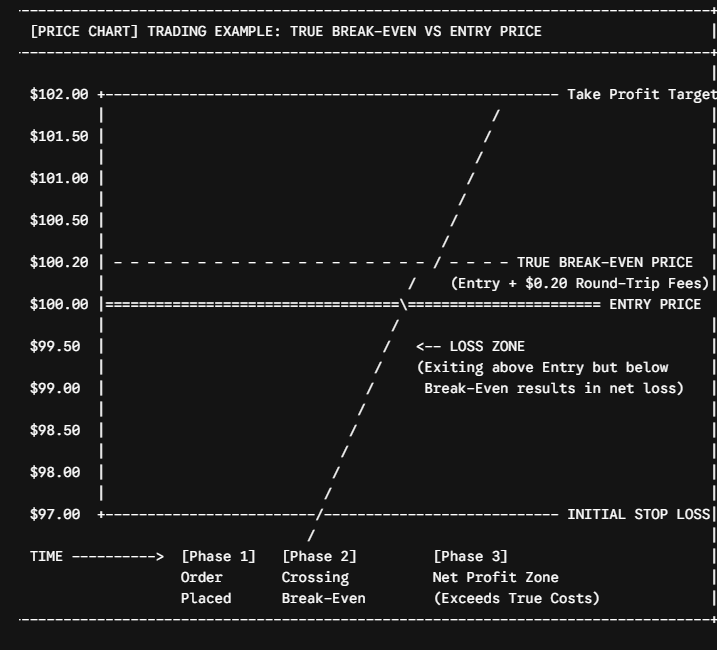
Entry price does not equal your true break-even price.
If you buy a stock at $100 and pay $0.20 per share in total round-trip costs, your true break-even price is $100.20. For a short position, your true break-even level sits below your entry price because you need the price to drop to make money. Spreads, commissions, and overnight fees constantly push your true break-even point further away.
How to Calculate Break-Even Price
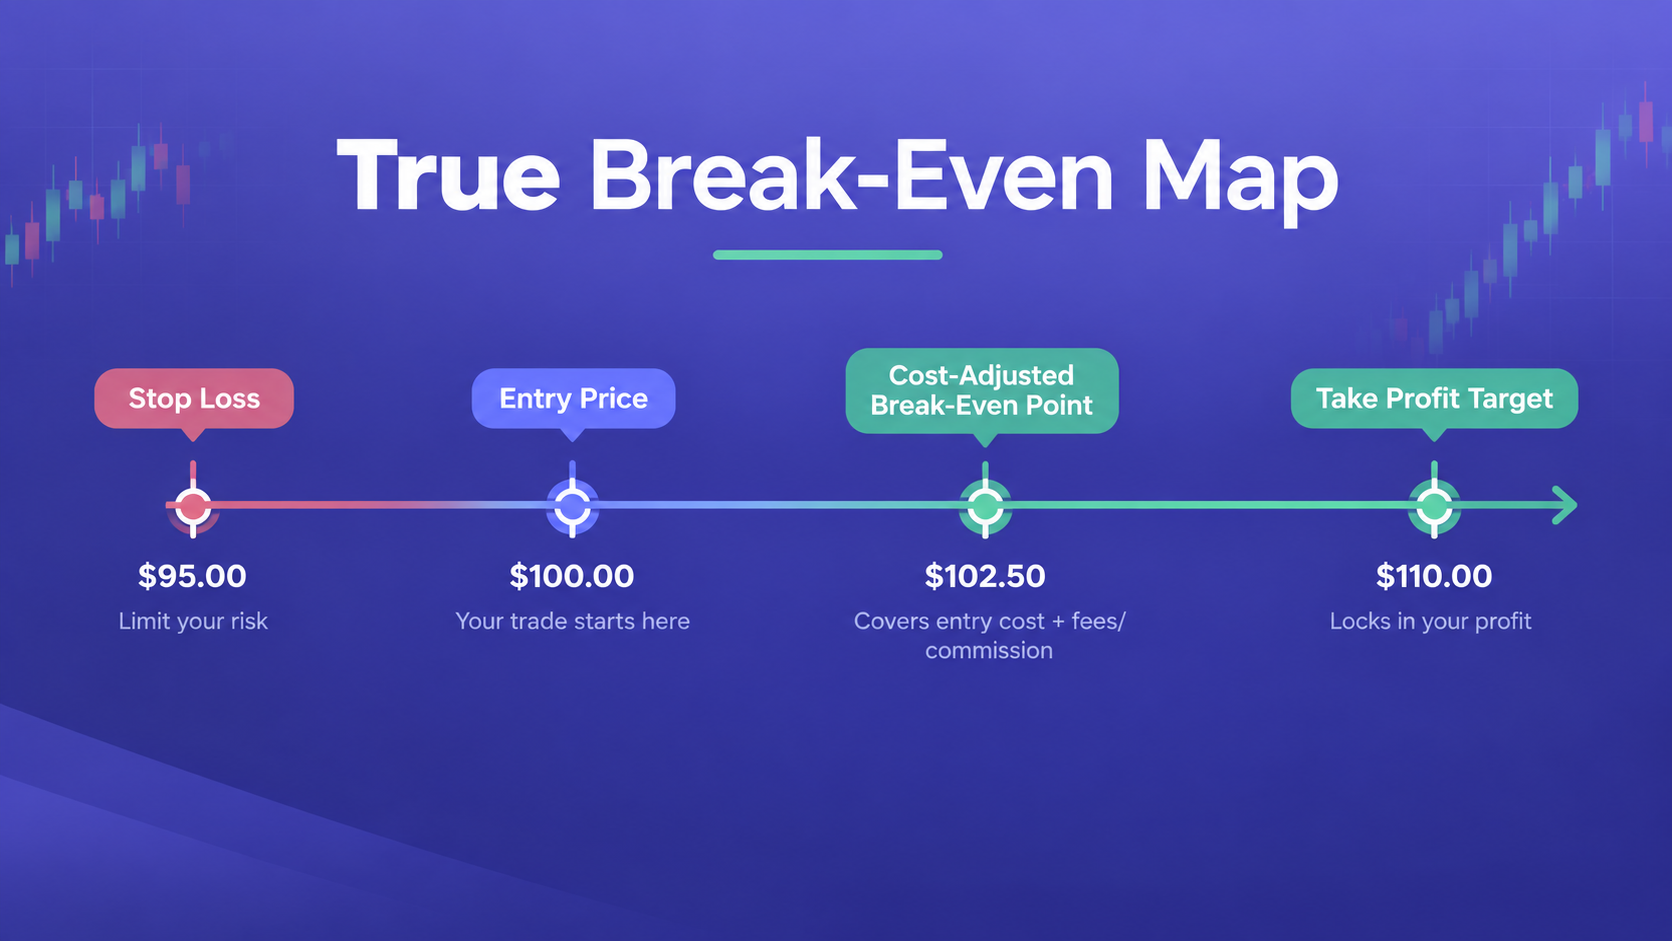
Calculating your break-even level means adding up every cost before you click the buy or sell button.
Basic Formula for Long Trades
Break-Even Price = Entry Price + (Total Trading Costs / Position Size)
Basic Formula for Short Trades
Break-Even Price = Entry Price - (Total Trading Costs / Position Size)
Required Move Formula
Required Move % = (Break-Even Price - Entry Price) / Entry Price x 100
Here is a real example from one of my stock trades:
- My Entry Price: $100
- My Position Size: 100 shares
- Total Round-Trip Costs: $20
- Cost Per Share: $20 / 100 = $0.20
- My True Break-Even Price: $100 + $0.20 = $100.20
- Required Move %: ($100.20 - $100) / $100 x 100 = 0.20%
I needed the stock to move up by at least 0.20% just to get my original money back.
How Break-Even Works With Call and Put Options
Options trading uses specific break-even math because options have upfront fees called premiums.
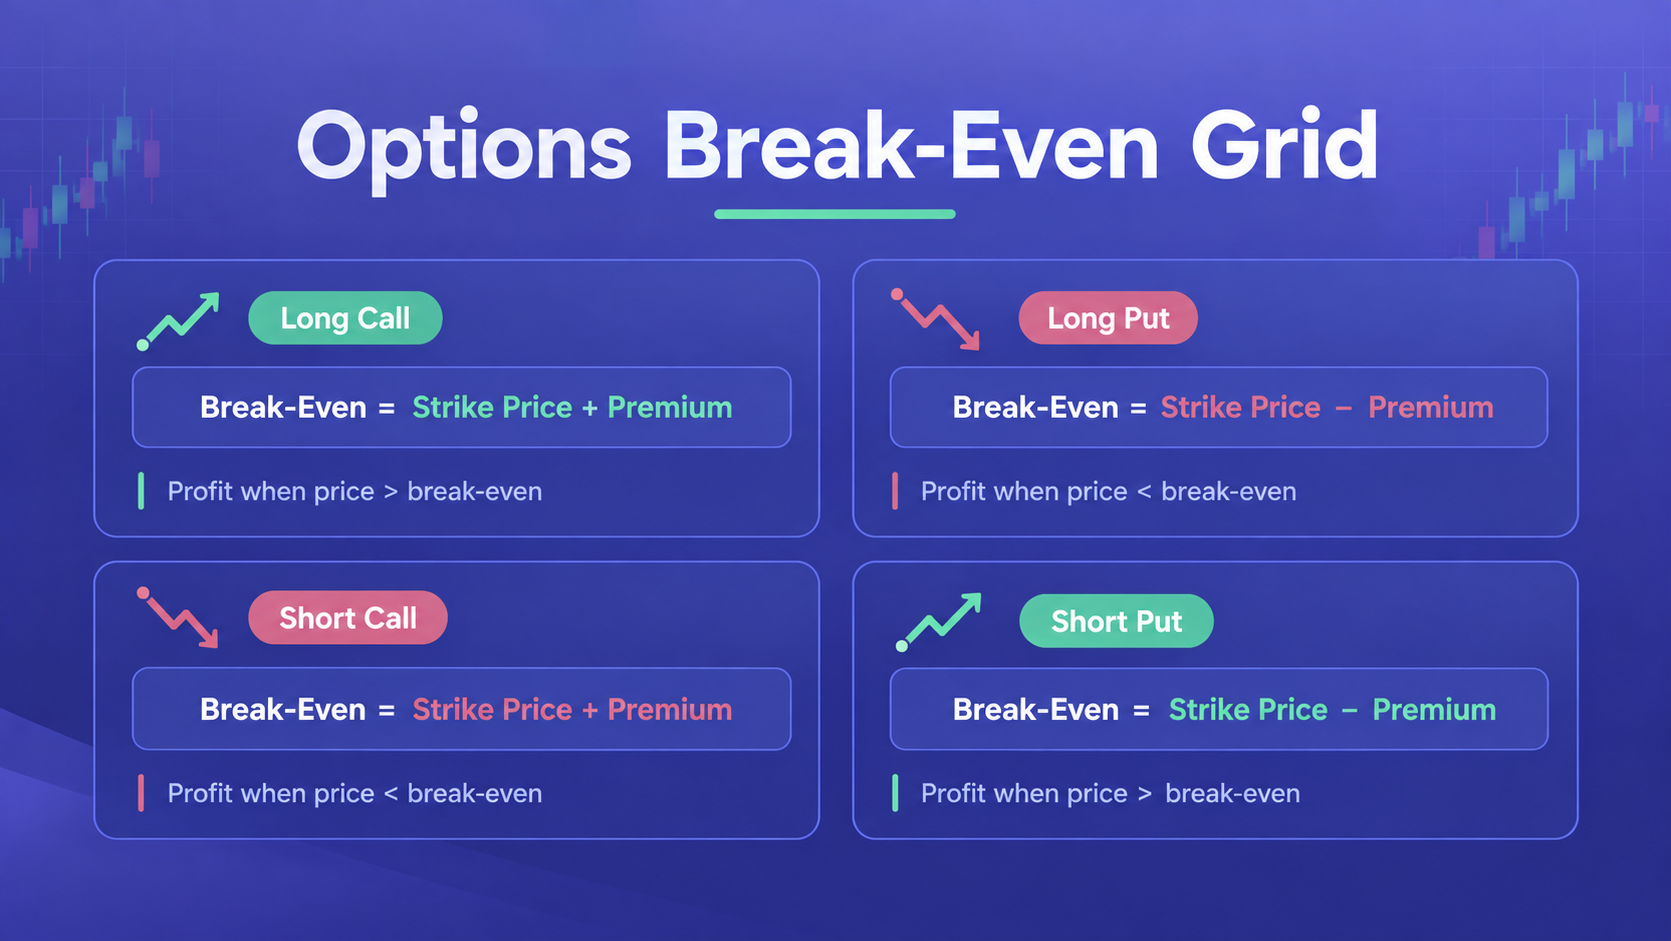
| Position Type | Break-Even Price at Expiration | Price Direction Needed |
|---|---|---|
| Long Call | Strike Price + Premium Paid | Price must go higher |
| Long Put | Strike Price - Premium Paid | Price must go lower |
| Short Call | Strike Price + Premium Received | Price must stay lower |
| Short Put | Strike Price - Premium Received | Price must stay higher |
Long Call Example
I buy a $100 call option for a $5 premium. My break-even price at expiration is 105(100 + $5).
- Below $105: I lose money
- At $105: I break even
- Above $105: I make a profit
Long Put Example
I buy a $100 put option for a $4 premium. My break-even price at expiration is 96(100 - $4).
- Above $96: I lose money
- At $96: I break even
- Below $96: I make a profit
Short Put Example
I sell a $100 put option and collect a $4 premium up front. My break-even price is 96(100 - $4). As long as the stock stays above $96, my trade stays safe.
Keep in mind that these rules apply at expiration. Before expiration day, changes in time and volatility can allow an option to turn a profit early.
What Costs Should You Include in Break-Even?
Small hidden costs quickly stack up and ruin a good trade plan. You should always count:
- Entry and Exit Commissions: Fees your broker charges to open and close orders.
- Bid-Ask Spread: The difference between the buy price and sell price on the screen.
- Slippage: The unexpected price difference when market prices jump fast.
- Overnight Swap Fees: Daily interest charges for holding leveraged trades or crypto positions overnight.
The more fees you ignore, the less accurate your break-even level becomes.
How to Use ATR With Break-Even
The Average True Range (ATR) indicator shows the average price movement of a market over a chosen time period. Comparing your break-even distance to the ATR tells you if your trade goal is realistic.
Break-Even Distance in ATR = Absolute Value of (Break-Even Price - Entry Price) / ATR
Let us compare two different assets:
Asset A (Low Fees)
- Entry Price: $100
- Break-Even Price: $100.50
- Required Move: $0.50
- Daily ATR: $2.00
- Break-Even Distance: $0.50 / $2.00 = 0.25 ATR
Asset A only needs to move a quarter of its daily range to clear costs.
Asset B (High Fees)
- Entry Price: $100
- Break-Even Price: $103.00
- Required Move: $3.00
- Daily ATR: $2.00
- Break-Even Distance: $3.00 / $2.00 = 1.50 ATR
Asset B needs 150% of its normal daily volatility just to hit zero profit. That is a risky trade to take.
Research published in the Journal ofRisk and Financial Management shows that traders who calculate clear risk boundaries and fee thresholds before entering a trade achieve significantly higher consistency than those who rely on emotional exits
When I test cost-adjusted setups across different platforms, I like to practice order execution on IQ Option or analyze quick chart setups on Deriv.
Break-Even Trading Strategy: Use It Before You Enter
I use a simple 6-step pre-trade routine before opening any chart position:
- Find Entry Price: Pick my chart entry level (e.g., $100).
- Add Up Total Costs: Estimate round-trip fees (e.g., $0.20 per share).
- Find True Break-Even: Add fees to entry ($100 + $0.20 = $100.20).
- Calculate Needed Move %: Check percentage distance (0.20%).
- Check ATR Score: Compare needed moves against market volatility.
- Check Net Profit Room: Subtract break-even level from target price.
If my chart target is $101 and my break-even level is $100.20, my net room is only $0.80. If that $0.80 net reward is too small for my risk, I skip the trade.
Traders testing different strategy workflows often try trading tools on Pocket Option, check platform mechanics on Quotex, test chart setups on ExpertOption, review execution on Olymp Trade, practice setups on Binomo, or check leverage controls on CapitalCore.
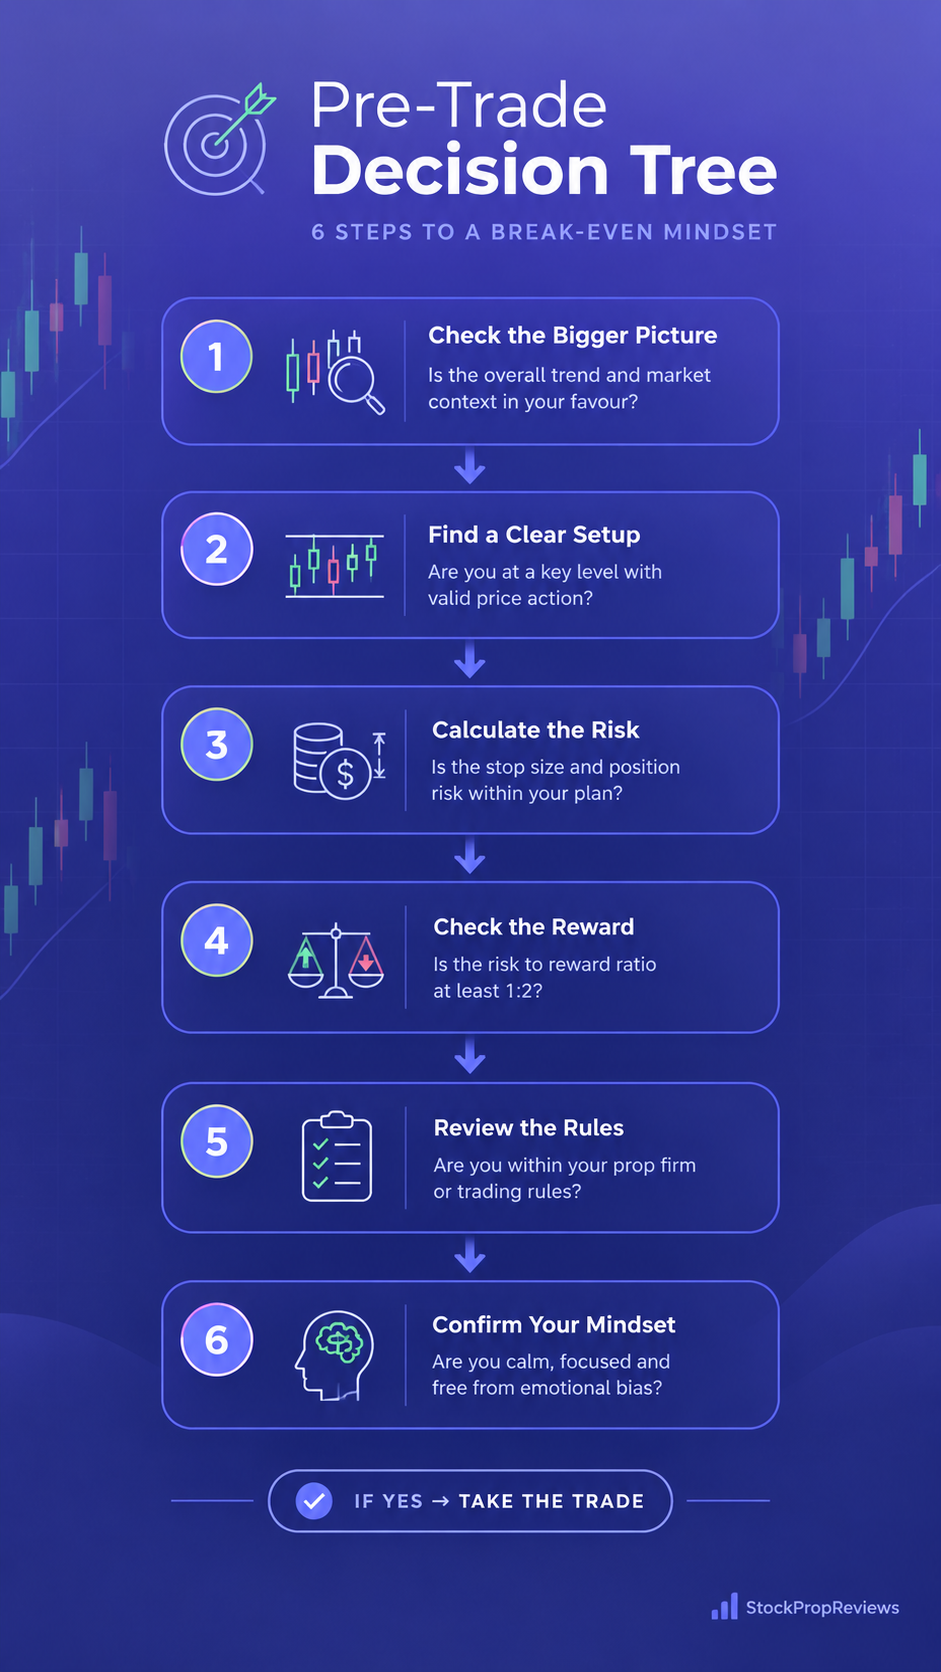
Benefits, Limitations, and Break-Even Checklist
Benefits
- Shows your real cost threshold before you enter.
- Uncovers hidden broker fees and spreads.
- Helps option traders pick realistic strike prices.
- Uses ATR to filter out high-cost, low-probability trades.
Limitations
- Break-even levels do not predict market direction.
- Unexpected slippage during fast market news can alter your final costs.
- Reaching break-even does not guarantee a profitable trade.
Pre-Trade Checklist
- Did I calculate entry and exit fees?
- Did I include bid-ask spreads?
- What is my exact break-even price?
- Is my required move percentage small?
- Is my required move less than 0.5 ATR?
- Does my profit target leave enough net profit after covering fees?
FAQs
What is the break-even price in trading?
The break-even price is the exact market price where a trade recovers its initial cost and transaction fees, resulting in zero profit and zero loss.
How do you calculate break-even price?
For long trades, add your total round-trip costs per share to your entry price. For short trades, subtract total costs per share from your entry price.
What is the break-even formula for long calls and long puts?
For a long call, break-even is Strike Price + Premium Paid. For a long put, break-even is Strike Price - Premium Paid.
Why should I compare break-even distance with ATR?
ATR measures normal market volatility. Comparing your break-even distance to ATR tells you if the move needed to cover trading fees is realistic given recent price action.
To read more guides and upgrade your market knowledge, check out our latest posts on the Becoin Blog today.
Ready to level up your trading skills with in-depth analysis and smart risk management tools? Join Becoin Premium today to get the edge you need!

EUR/USD holds 1.1414 before the ECB decision: three scenarios
EUR/USD traded near 1.1414 before the ECB’s July decision. Here is what a hold, hawkish hold or surprise hike could mean for 1.1350 and 1.1480.

Trading Currency Strength Instead of Single Pairs
It was a Tuesday afternoon when I realized I was fighting a losing battle against a ghost. My screen was a chaotic web of indicators. I had the EUR/USD chart open, a moving average crossing over here, a relative strength index flashing oversold there, and a price action setup that looked textbook perfect. I clicked […]

How Understanding Market Structure Saved My Day Trading
I remember the exact moment my trading account hit zero for the third time in a single month. It was a rainy Tuesday evening, and I was staring at a 1-minute chart on my laptop screen. The price had been moving up aggressively. It looked like a flawless rocket ship to the moon. I clicked […]

IQ Option vs Deriv Chart Comparison
The Night I Realized My Charts Were Lying to Me It was three in the morning, the exact hour when the market looks either like a goldmine or a psychological hazard. I was sitting in front of two monitors, a lukewarm mug of coffee in hand, watching a critical support level on EUR/USD. On my […]

The Best Broker Without Complicated Features (And Why Simplicity Wins)
Most traders don’t fail because they lack knowledge. They fail because their platform buries them in noise before they even place their first trade. Here’s what actually works. It Started With a Confession From a $10 Trader A reader messaged us a few months back. He had been trying to trade for three weeks, had […]

Best Broker for Learning Price Action in 2026 (Tested by Real Traders)
Most traders think they need a better strategy. What they actually need is a better understanding of price. A few years ago, one of our community members had over ten indicators on his chart. RSI. MACD. Moving averages. Bollinger Bands. Stochastic. Every new YouTube video added another indicator. The result? More confusion. Not more profits. […]