The MACD Indicator for Day Trading
Three years ago, I stared at my screen in total disbelief as a $2,500 trading balance vanished into thin air over a single afternoon. I had read every generic article on the web claiming that trading day trading with the Moving Average Convergence Divergence indicator was as simple as buying a CALL when lines crossed upward and a PUT when they crossed downward.
Following those textbook rules blindly on a standard 60-second chart led to endless false signals. The market would spike briefly, tricking my indicator into a crossover, only to reverse violently three seconds before my contract expired. That painful lesson taught me a hard truth: standard indicator strategies designed for traditional spot forex or equities fail in day trading unless you account for the fixed expiration clock.
In day trading, you do not just need to be right about the price direction; you need to be right about the precise timing. Standard settings are inherently lagging because they calculate moving averages based on historical price data. Once I realized I needed to modify MACD parameters, filter out noise with trend alignment, and confirm entries with raw price action, my win rate transformed. Here is the exact blueprint I built through trial, error, and thousands of real trades.
Deconstructing the MACD: What Your Chart Is Actually Trying to Tell You
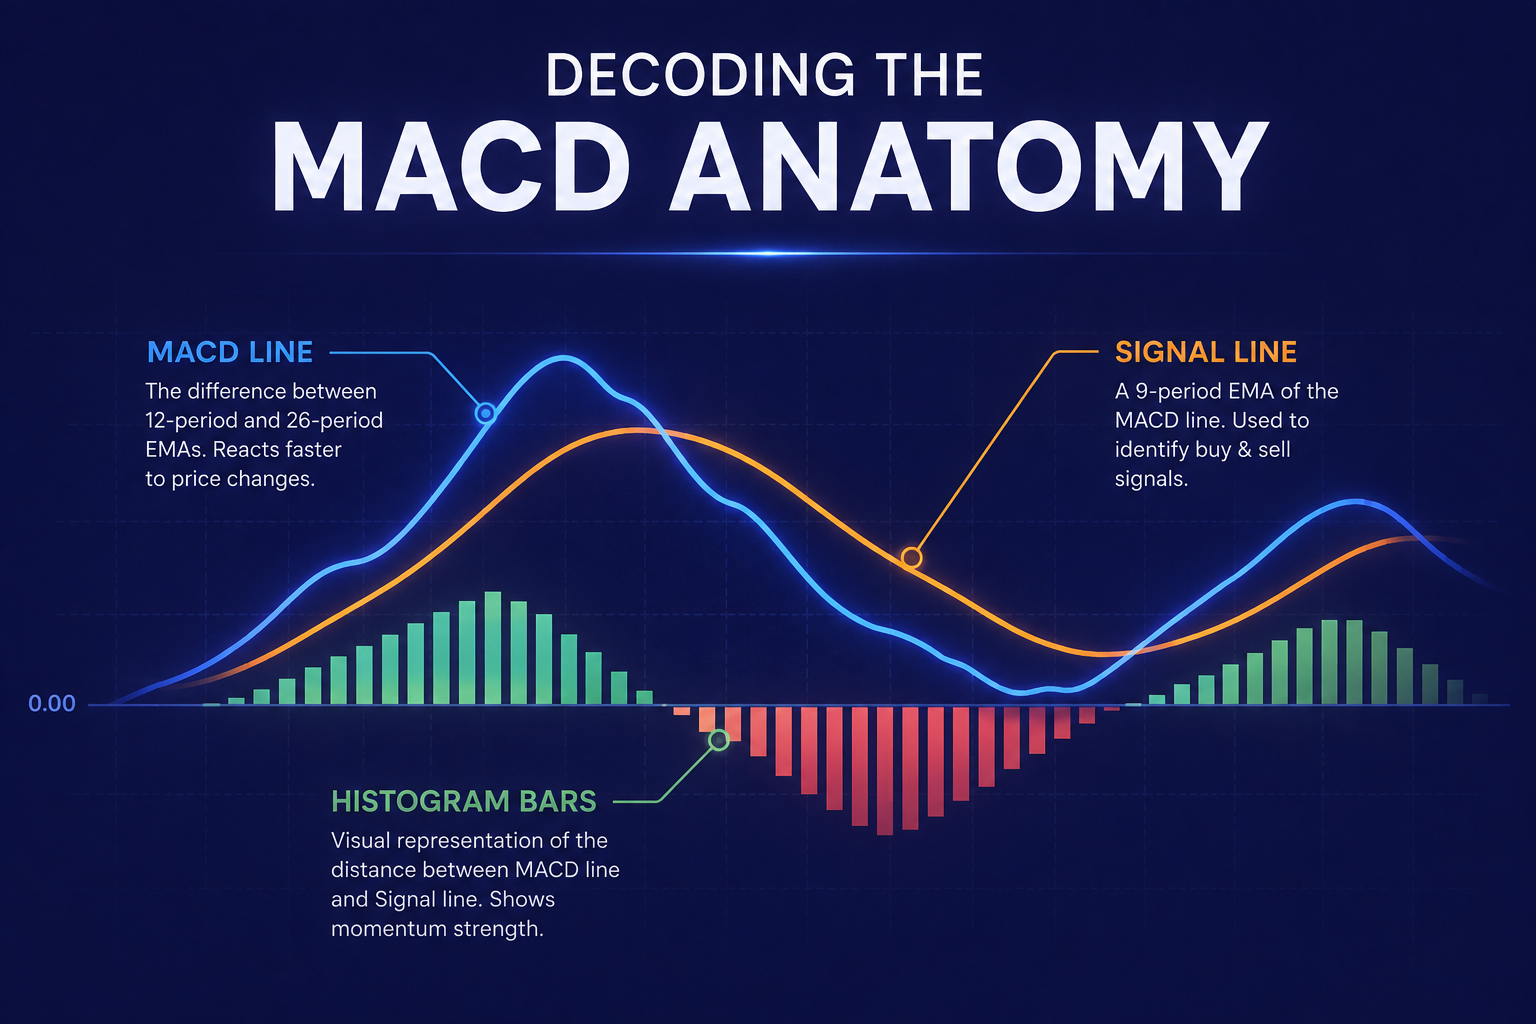
Before applying any entry rules, it is vital to understand what happens beneath the surface of the indicator. The default configuration uses two Exponential Moving Averages, typically the 12-period fast EMA and the 26-period slow EMA. The main MACD line represents the mathematical difference between these two averages. When price momentum accelerates upward, the fast line pulls away from the slow line, forcing the MACD line higher.
The secondary line, often called the Signal Line, is a 9-period EMA of the MACD line itself. It acts as a smoothed trigger to highlight momentum shifts. Meanwhile, the vertical bars forming the Histogram display the exact gap between the MACD line and the Signal Line. When the histogram bars cross the center Zero Line from below to above, buyers are taking aggressive control of the order book.
In my early trading days, I ignored the Zero Line entirely. I was solely focused on line crossovers happening anywhere on the chart. That was a costly mistake. If you want a deeper breakdown of how technical indicators function under different market conditions, feel free to explore our comprehensiveday trading indicators guide. Understanding the structural mechanics of an indicator prevents you from trading against dominant market forces.
The 3-Step MACD Strategy That Turned My Trading Around
Once I stopped treating the indicator like a magic prediction box and started using it as a momentum filter, my results stabilized. I structured my entries into three non-negotiable validation steps before opening any trade.
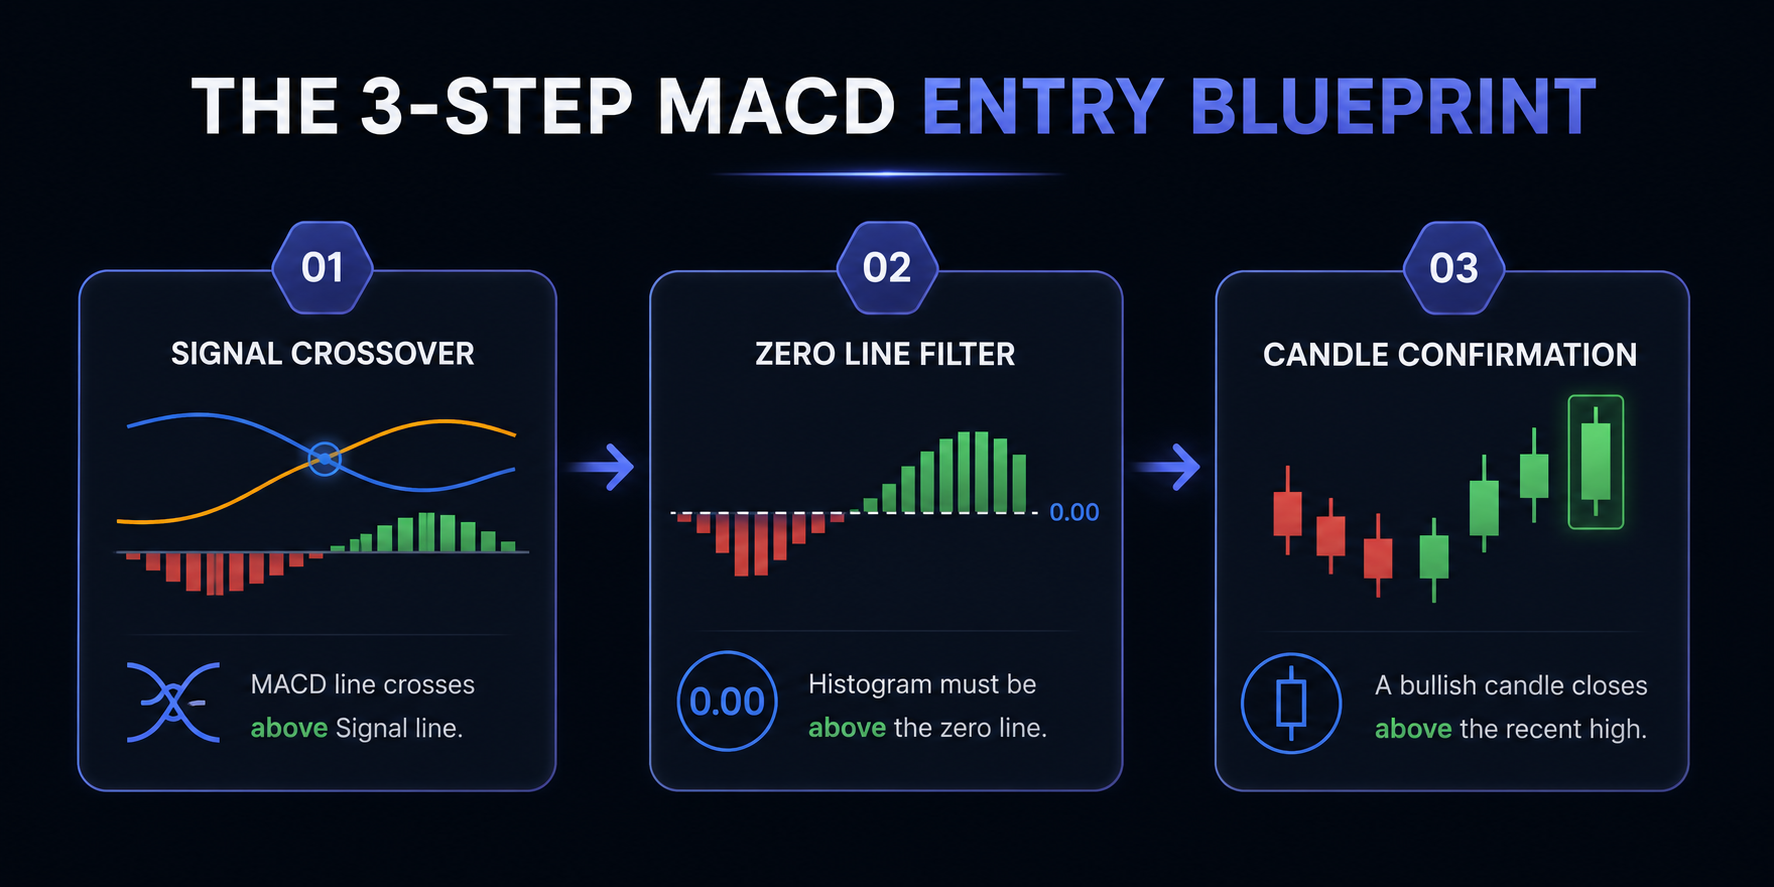
Step 1: Identify the Macro Trend with the Zero Line
Never take a trade that contradicts the MACD's position relative to the center Zero Line. When both the MACD line and Signal line sit comfortably above the Zero Line, the broader momentum favors buyers. In this environment, I strictly look for CALL options. Conversely, when both lines reside below the Zero Line, the path of least resistance is downward, meaning I only look for PUT options.
Step 2: Wait for a Clean Line Crossover and Histogram Expansion
For a CALL entry, I look for the faster MACD line to cross above the Signal line from below. Simultaneously, the histogram bars must turn green and expand upward. For a PUT entry, I require the MACD line to cross below the Signal line, accompanied by expanding red histogram bars underneath the zero baseline.
Step 3: Require Price Action Confirmation
Indicators lag, but price action is instantaneous. Before clicking any purchase button, I inspect the current candlestick. For a CALL signal, the signal candle must close as a strong bullish body, ideally breaking above a local micro-resistance level. For a PUT signal, I demand a strong bearish close beneath local micro-support. If you want to refine your candle reading skills alongside indicator setups, check out our guide on candlestick patterns for traders.
When all three conditions align, the statistical edge tilts heavily in your favor.
Fine-Tuning the Settings for 1-Minute and 5-Minute Expirations
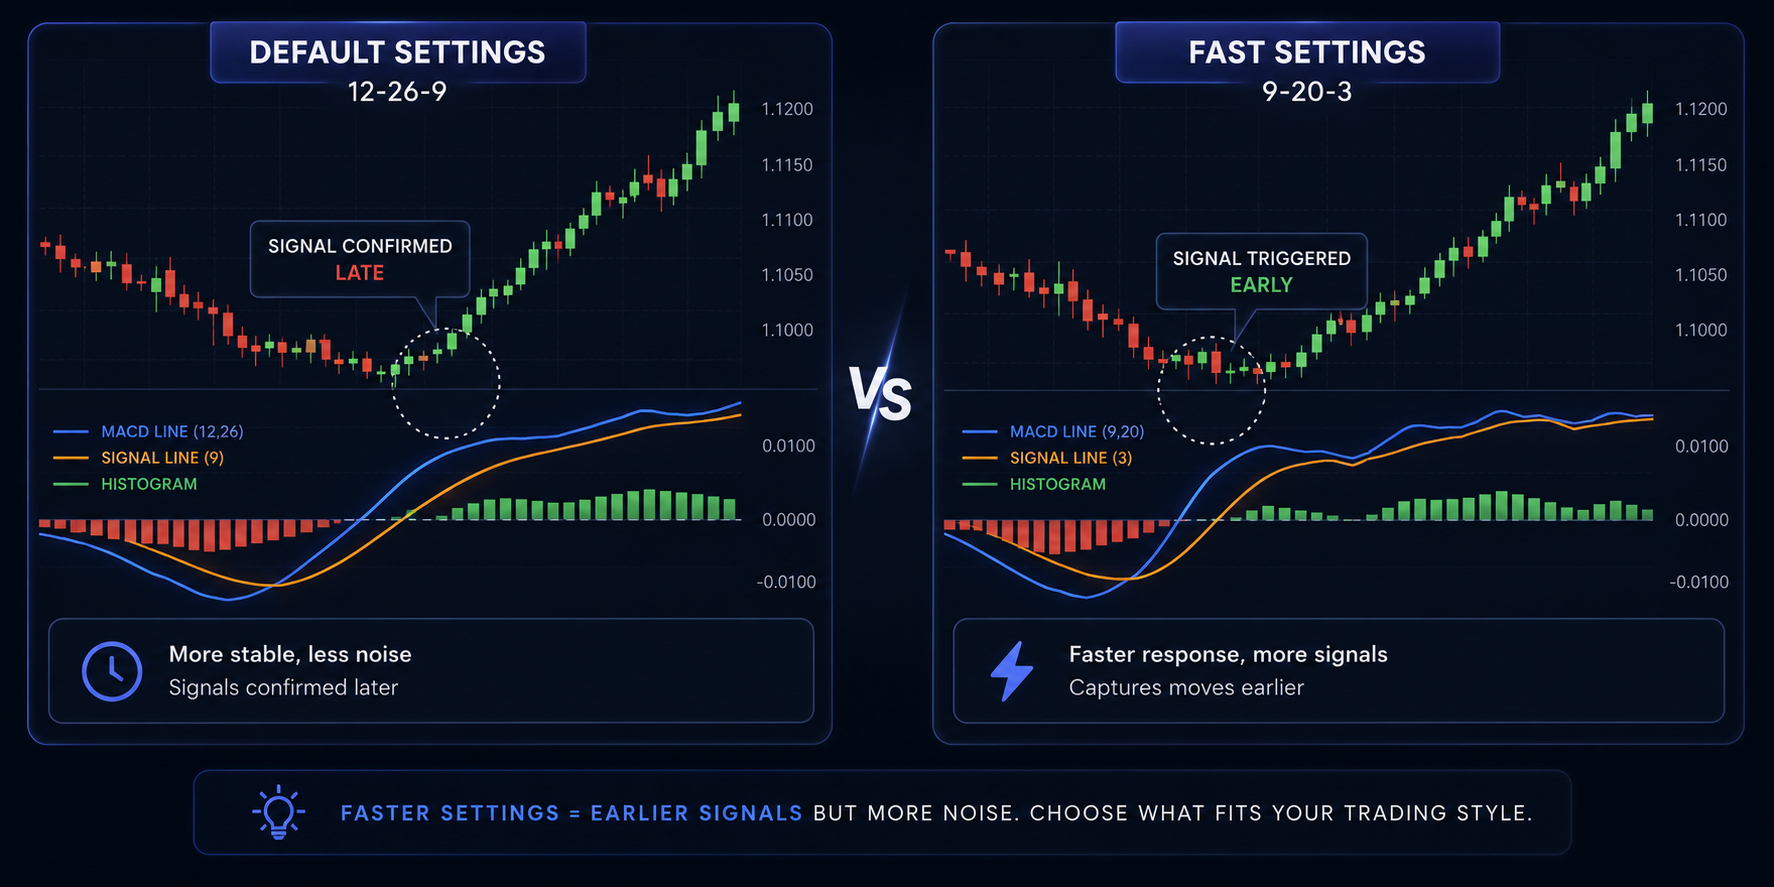
The default settings of 12, 26, 9 were engineered in the 1970s for daily stock charts. Applying those exact parameters to a 1-minute day trading chart is like trying to race a cargo truck through a tight agility course. The signals simply arrive too late.
Through extensive testing, I found that adjusting the parameters based on contract duration dramatically improves reaction speed:
- For 60-Second to 2-Minute Contracts: Change the settings to 9, 20, 3. The faster fast-length (9) and reduced signal smoothing (3) eliminate indicator lag, delivering crisp signals right as price momentum begins to explode.
- For 5-Minute to 15-Minute Contracts: Use 12, 26, 9 or 10, 22, 7. On 5-minute charts, market noise drops significantly, allowing standard or slightly tightened parameters to capture sustained directional moves smoothly.
Matching your timeframes to expiration times is essential. When trading a 1-minute chart with fast settings, set your option expiration to 2 or 3 candles (2 to 3 minutes). This cushion gives the asset price enough room to move into profit before the contract settles.
Navigating the Platforms: Where to Execute Your Trades
A strategy is only as effective as the platform you execute it on. Fast execution speeds, reliable charts, and accurate payout rates are crucial when trading tight timeframes. Over the years, I have tested dozens of platforms to find environments with clean technical analysis tools.
When trading fast momentum breakouts using short-term MACD signals, I frequently use the sleek interface on IQ Option due to its responsive charts and customizable technical tools. For traders seeking broad asset coverage and smooth execution on short-term expirations, Pocket Option offers advanced charting capabilities directly built into the trading terminal.
If you prefer straightforward asset navigation and minimalist chart layouts, Quotex provides an excellent trading engine for applying fast indicator settings. Similarly, platforms like Olymp Trade and ExpertOption deliver rapid order placement, which is vital when trading 60-second momentum setups.
For traders who prefer multi-asset flexibilities across forex and synthetic indices, Deriv and Capital Core offer stable platforms with reliable payouts and flexible expiry configurations. Diversifying your trading environment ensures you always trade under optimal market conditions.
Advanced Divergence Tricks and Avoiding Fakeouts
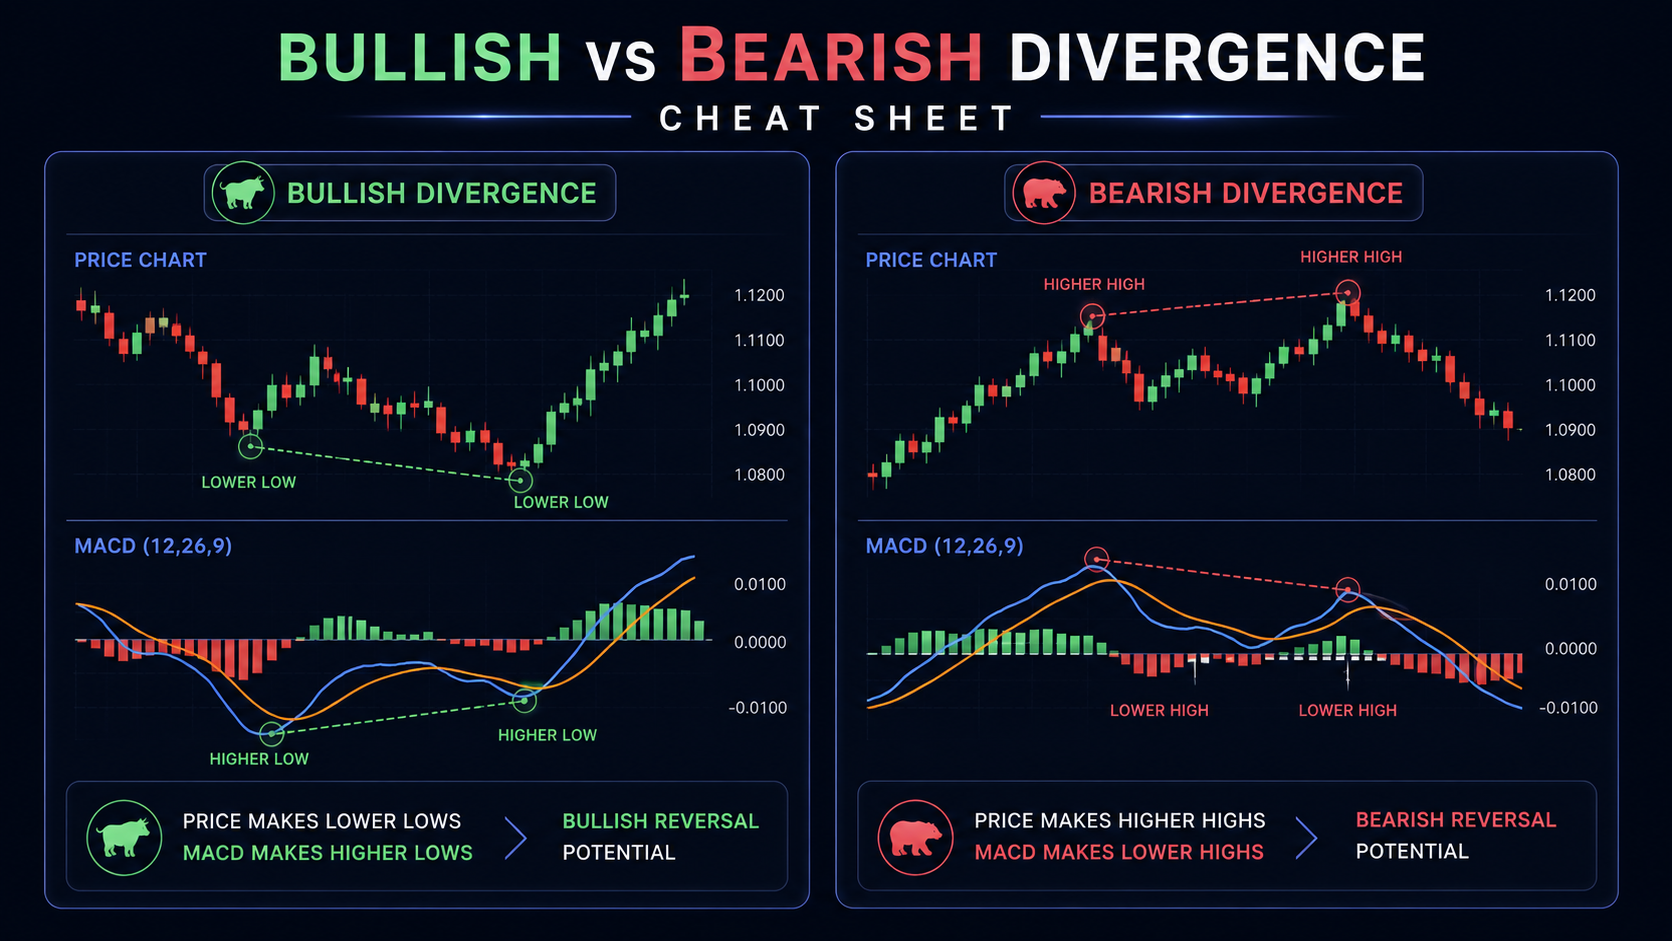
The absolute highest-probability trade setup in my arsenal is MACD Divergence. Divergence occurs when asset price action disagrees with indicator momentum, signaling that a major trend reversal is imminent.
- Bullish Divergence: The price makes a lower low, but the MACD indicator forms a higher low. This tells you that despite falling prices, selling pressure is exhausting. I prepare to buy a CALL option as soon as the MACD lines cross back upward.
- Bearish Divergence: The price hits a higher high, but the MACD indicator registers a lower high. Sellers are secretly stepping in. I prepare to purchase a PUT option once the fast line crosses below the signal line.
To avoid fakeouts during low-volatility Asian sessions or high-impact economic news releases, I cross-reference my technical setups with daily market forecasts. Utilizing dedicated analytical resources like the Becoin Forecast Hub helps you spot macro economic trends before taking short-term trades.
Additionally, protecting your capital during chop is non-negotiable. Even the highest win-rate indicator strategy will suffer losing streaks. Incorporating strict rules from our risk management guide ensures you never risk more than 2% to 5% of your account balance on a single day trade.
Final Thoughts: Elevate Your Edge Beyond Indicators
Mastering the MACD strategy transformed my trading from reckless gambling into a disciplined, structured business. By adjusting default parameters, respecting zero-line trend alignment, confirming entries with candlestick bodies, and managing risk strictly, you can build a consistent statistical edge in day trading.
However, mechanical indicators are only one piece of the puzzle. Real trading mastery requires real-time market insights, deeper institutional flow analysis, and professional guidance.
If you are ready to take your trading edge to the highest level, stop relying on guesswork. Join Becoin Premium today to gain access to in-depth technical analysis, high-probability trade setups, VIP market forecasts, and expert strategy breakdowns tailored to help you consistently outperform the market.
Best Capital Core Day Trading Strategy for 1-Minute and 5-Minute Trades
I did not build my short-expiry strategy on Capital Core from a perfect week, a flashy YouTube setup, or some “secret indicator” thread. I built it by making the same mistakes most traders make when they first touch 1-minute and 5-minute day trading. I entered too early. I forced trades because the candles looked exciting. […]
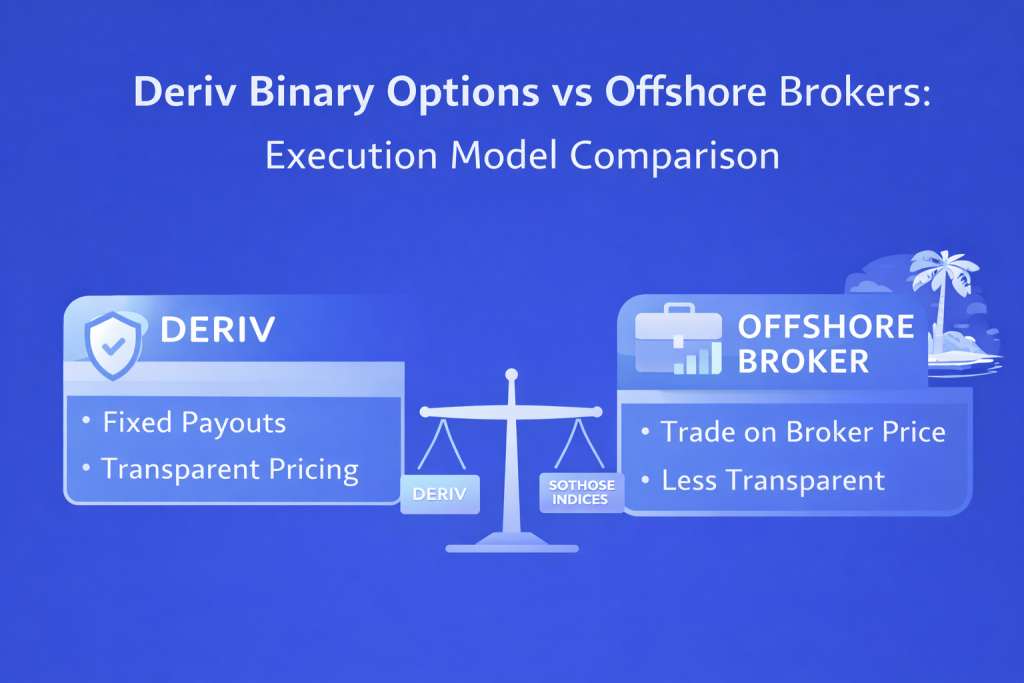
Deriv Day Trading vs Offshore Brokers: Execution Model Comparison
I did not start my trading journey thinking about execution models. Like most beginners, I started with charts, indicators, and the belief that if I could just find the right entry signal, profits would follow. My early trading notebook was full of screenshots of RSI signals, candlestick patterns, and support levels. What it did not […]

How Liquidity Affects Day Trading Results
When I first started trading day trading, I believed success was all about finding the perfect indicator. I spent weeks testing moving averages, RSI settings, support and resistance levels, and dozens of YouTube strategies that promised easy wins. Some worked for a few trades, but most failed. What confused me was that the same setup […]

How Understanding Market Structure Saved My Day Trading
I remember the exact moment my trading account hit zero for the third time in a single month. It was a rainy Tuesday evening, and I was staring at a 1-minute chart on my laptop screen. The price had been moving up aggressively. It looked like a flawless rocket ship to the moon. I clicked […]

The Clock and the Candle: How I Stopped Guessing the Best Time to Trade Day Trading
I still remember the night I blew my third trading account. It was 11:30 PM. The house was completely quiet, the market charts on my screen were barely crawling, and I was forcing trades out of pure impatience. I kept staring at a flatline asset, placing one-minute positions, convinced that the market owed me a […]

Best Broker for Learning Price Action in 2026 (Tested by Real Traders)
Most traders think they need a better strategy. What they actually need is a better understanding of price. A few years ago, one of our community members had over ten indicators on his chart. RSI. MACD. Moving averages. Bollinger Bands. Stochastic. Every new YouTube video added another indicator. The result? More confusion. Not more profits. […]