
Price Rejection Trading Strategy
I still vividly remember the evening my trading account hit a record low. My screen looked like a neon Jackson Pollock painting. I had Stochastic Oscillators crossed at the bottom, a Relative Strength Index squeezing through middle bands, three Moving Averages tangling like spaghetti, and MACD bars flickering in red and green. Every time I thought I had a clear buy signal, the market would surge briefly, reverse hard, and knock out my stop loss.
I was trading the indicators, not the market. I was reacting to lagging mathematical formulas derived from past prices, rather than paying attention to what price was telling me in real time.
That realization hit me after losing three consecutive breakout trades on a Thursday afternoon. Exhausted, I did something radical. I opened my chart settings, deleted every single indicator from my template, and was left with raw, naked Japanese candlesticks. That was the day I began studying price rejection, and it fundamentally shifted how I read institutional order flow, risk management, and market dynamics.
Here is the exact story of how I mastered the Price Rejection Trading Strategy, how you can spot high-probability setups, and why reading candle wicks will give you an immediate edge over retail traders who are still drowning in indicator clutter.
Decoding Price Rejection: What the Wick is Really Telling You
When you strip away indicators and look at a clean candlestick chart, every candle tells a psychological story between buyers and sellers. A price rejection occurs when market participants push price aggressively toward a specific level, but encounter an overwhelming wall of opposing liquidity that violently repels price back toward where it started.
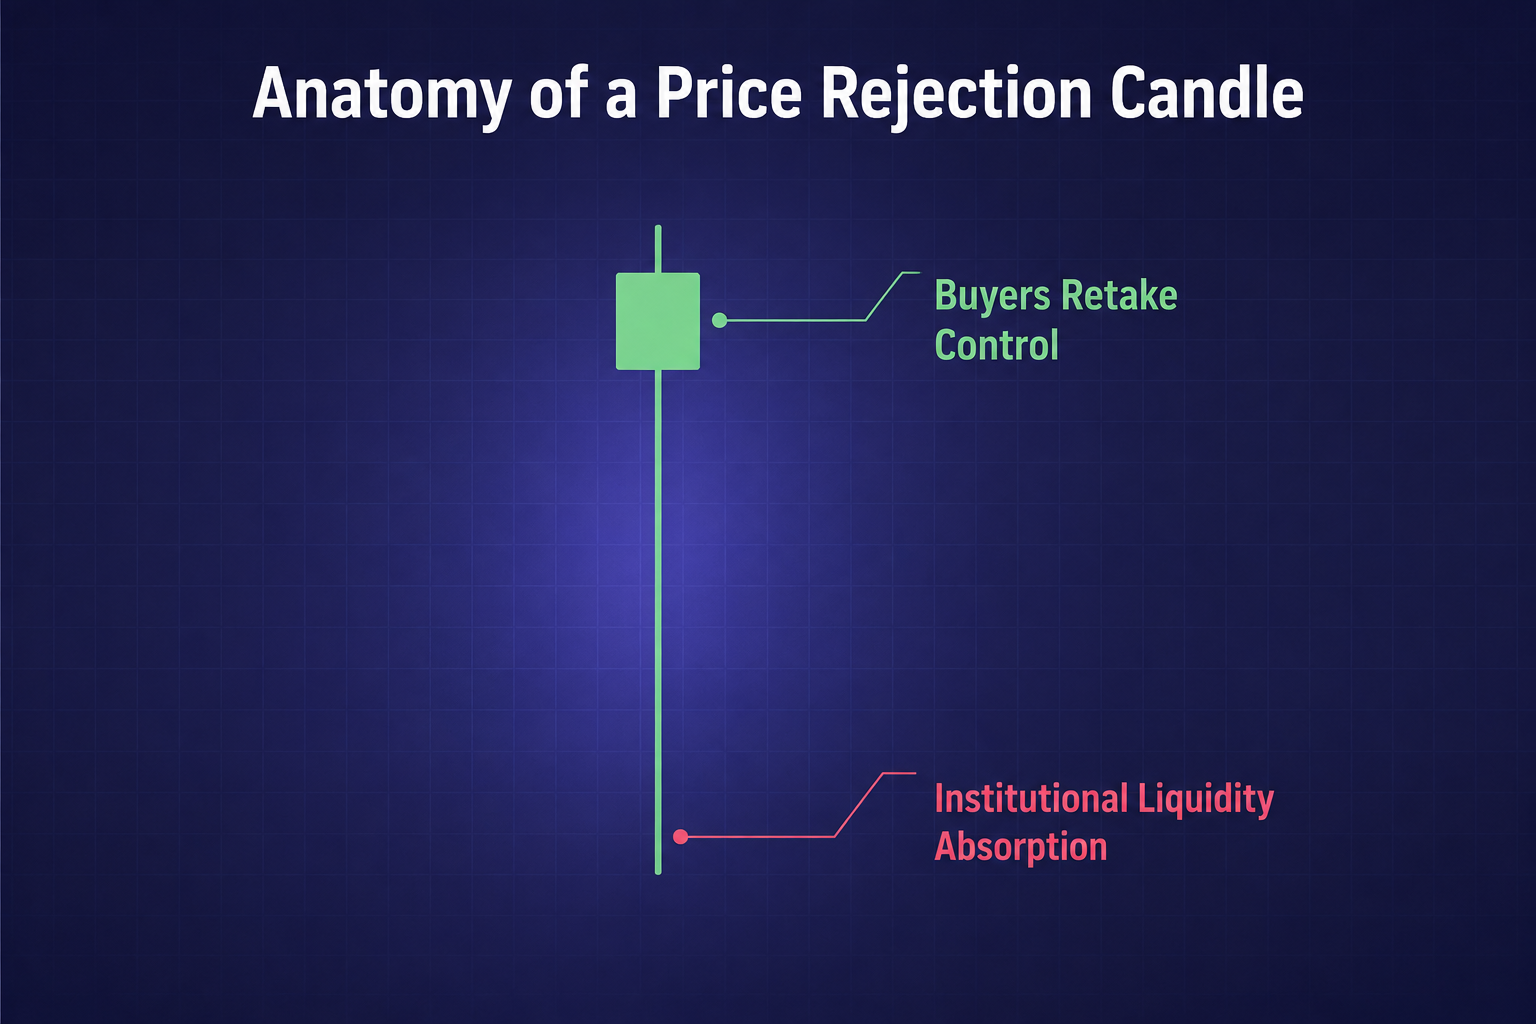
Visually, this battle leaves behind a long wick or tail.
For months, I used to view wicks as minor details. In reality, a long wick is the most explicit footprint of institutional intervention on a price chart.
When price moves rapidly upward toward a major resistance level and suddenly leaves a long upper wick, it tells us that buyers attempted to push higher, but institutional sellers stepped in, absorbed all the buy orders, and hammered price back down before the session closed. The result is a rejection of higher prices.
Conversely, when price plunges into a strong support zone and forms a long lower wick, it reveals that aggressive sellers were met with institutional buy orders, rejecting lower prices and springing back upward.
When practicing this pattern on clean execution platforms like IQ Option or testing fast execution speeds on Pocket Option, you quickly begin noticing how price rejection happens across every timeframe, from 1-minute charts to daily timeframes.
The Anatomy of a High-Probability Rejection Setup
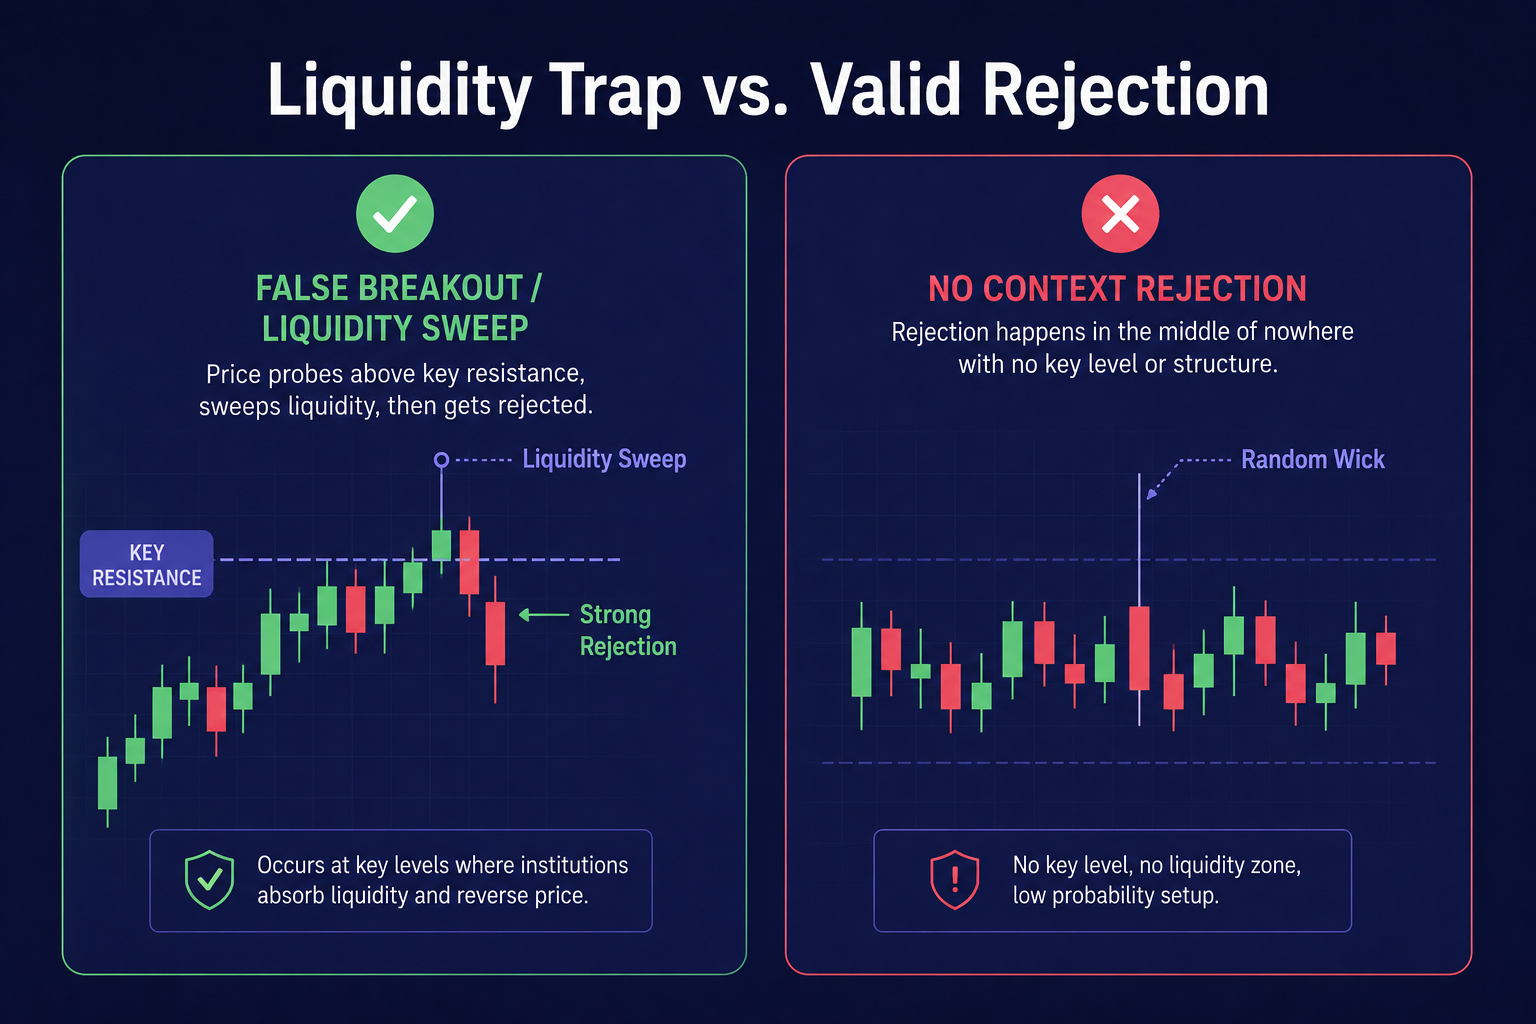
Not every long wick is worth trading. In my early days of price action trading, I made the costly mistake of taking every single Pin Bar or long-tailed candle I spotted. I soon learned that context is everything. A price rejection candle standing alone in the middle of a consolidation zone is often just noise.
A high-probability price rejection trade requires three confluence factors:
1. Location at a Key Level
Price rejection must occur at a structure that market participants care about. This could be a horizontal support or resistance line, a previous day high or low, a key Fibonacci retracement level, or a dynamic trendline. When price probes into these key zones and gets rejected, it signals that large orders are defending that exact area.
2. The Rejection Candle Structure
The ideal rejection candle, often called a Pin Bar or Hammer/Shooting Star, should feature a wick that is at least two to three times the size of the candle body. The body of the candle should close near the opposite end of the rejection. For instance, in a bullish price rejection, the long wick extends downward, while the small body closes near the high of the candle.
3. Liquidity Sweep Context
Institutions need liquidity to fill their massive positions. They often push price just beyond obvious swing highs or swing lows to trigger retail stop losses and lure breakout traders into the wrong side of the trade. Once that liquidity is swept, the market sharply reverses, leaving behind a massive price rejection wick.
To sharpen your chart reading skills, practicing order placement on reliable platforms like Quotex,Olymp Trade, or Deriv allows you to execute trades seamlessly while keeping your charts clean and responsive.
My 3-Step Execution Strategy for Rejection Trades
Once I established my rules, my consistency improved dramatically. Here is the exact execution process I use every single day to capture high-reward price rejection trades.
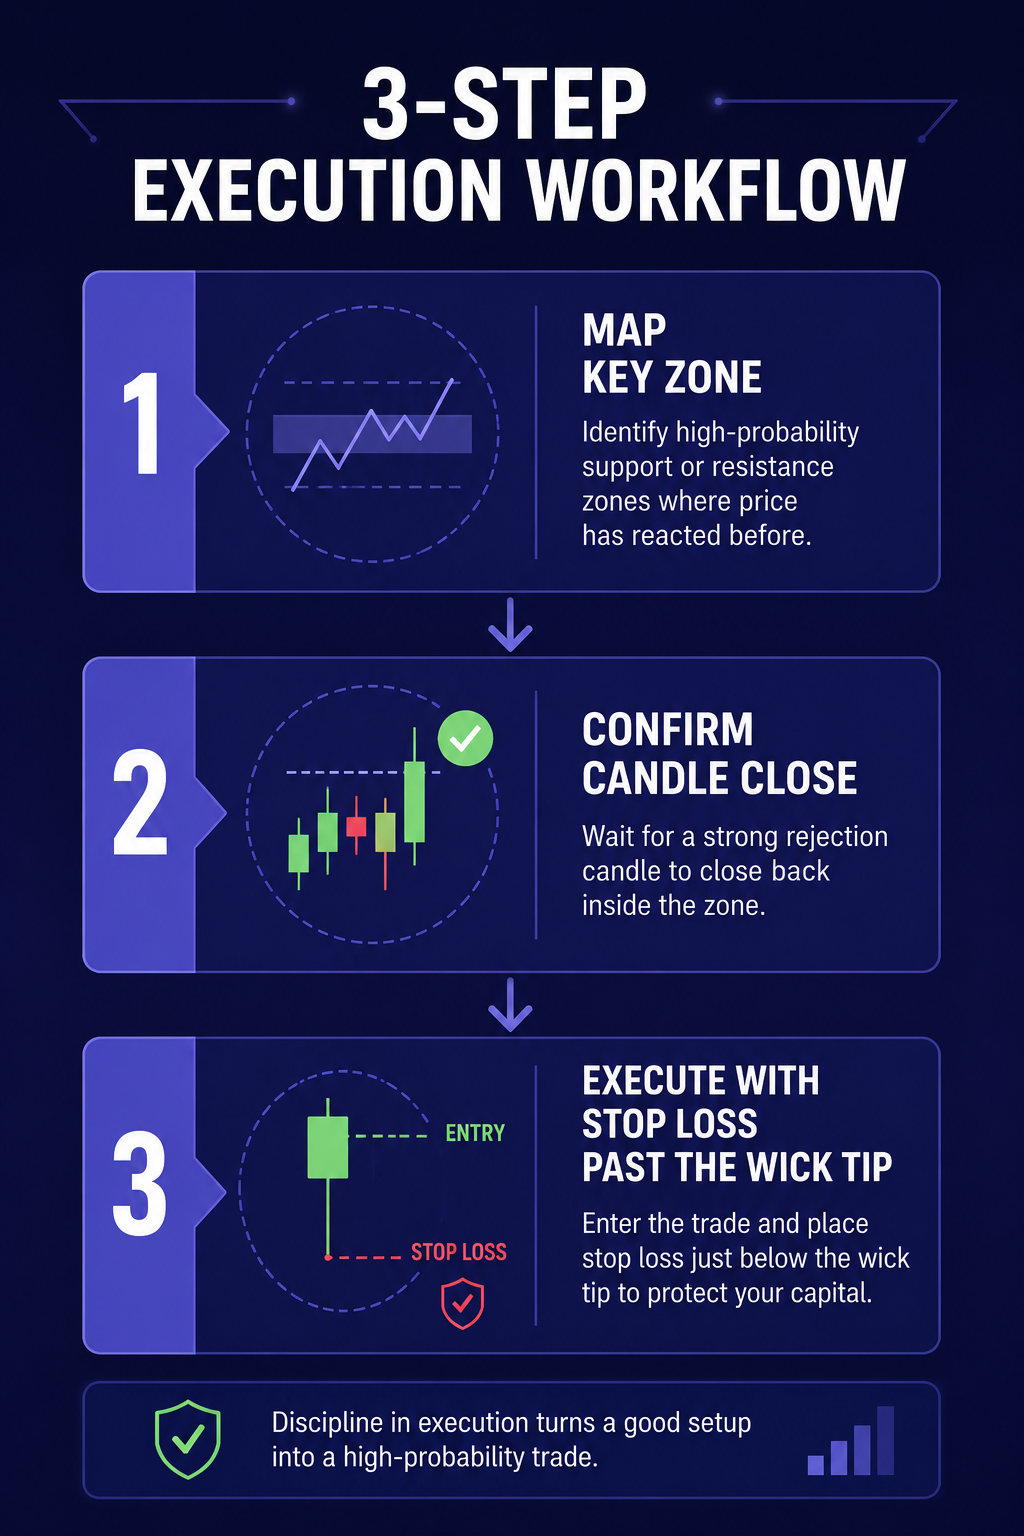
Step 1: Identify the Higher Timeframe Bias and Key Zones
Before entering any trade, I mark key support and resistance zones on the 4-hour or daily charts. I want to know where the big players are likely to react. If the overall trend is bullish, I focus primarily on bullish price rejections at key support levels.
Step 2: Wait for the Rejection Bar to Complete
Patience is mandatory. One of the easiest ways to lose money is entering a trade while the candle is still forming. A candle might look like a beautiful rejection bar with two minutes left, only to fill out into a full breakout body before closing. Always wait for the candle close to confirm that price rejection has taken place.
Step 3: Precise Entry, Stop Loss, and Profit Targets
Once the rejection candle closes:
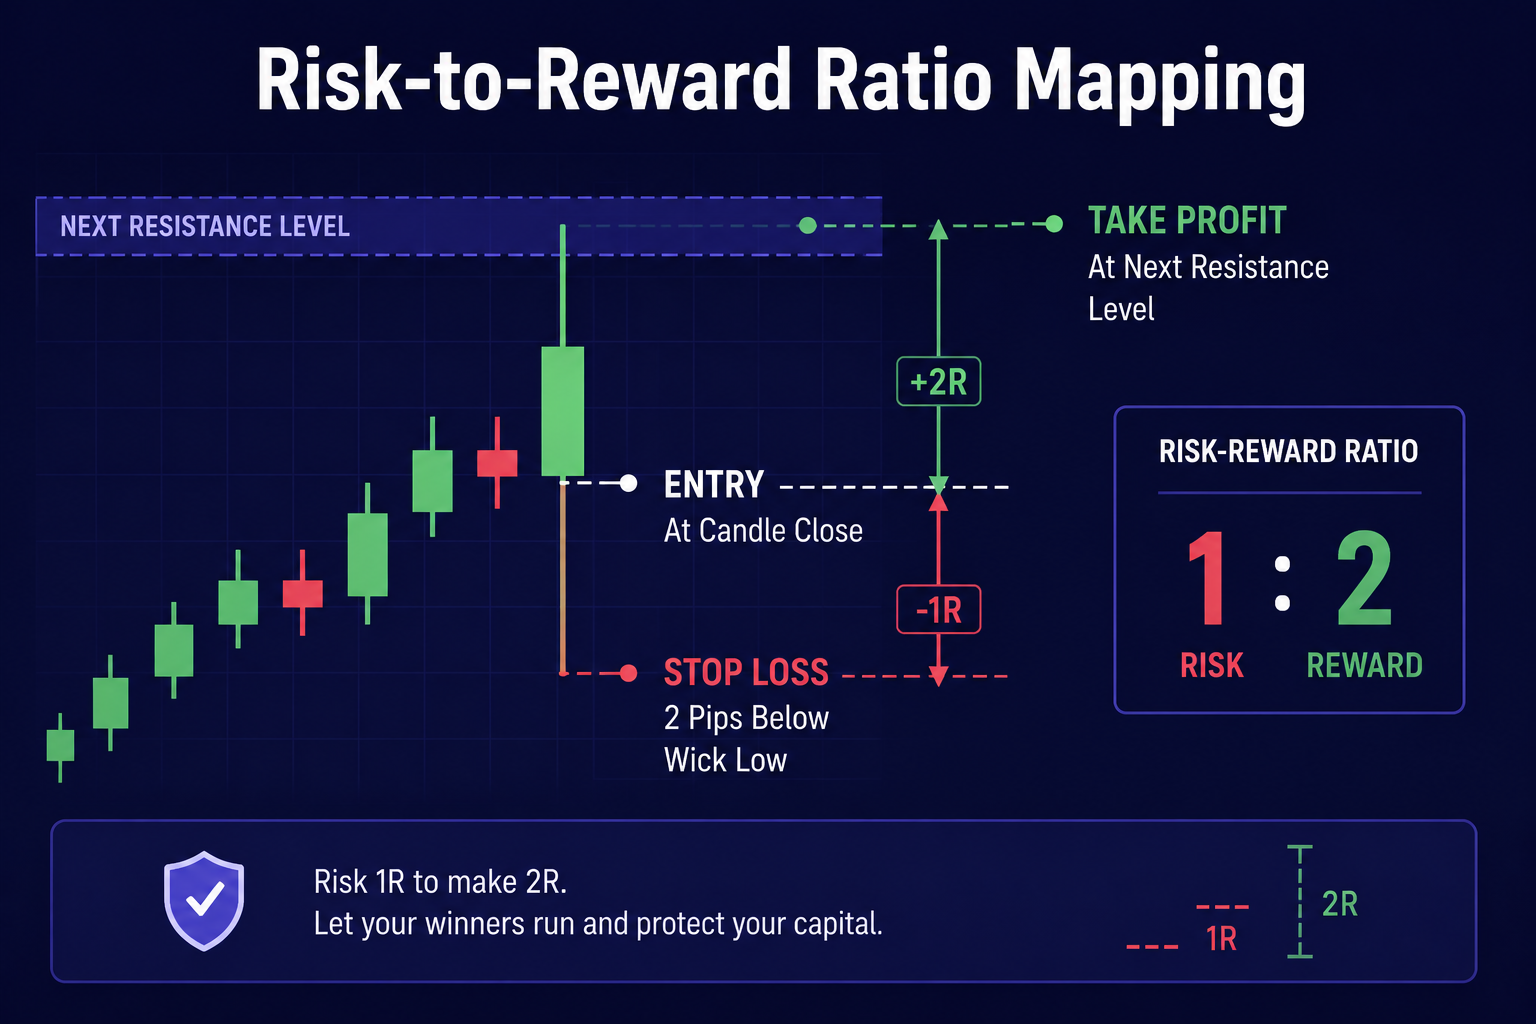
- Entry: I place a market entry on the open of the next candle or set a limit order at the 50% Fibonacci retracement level of the rejection wick for a tighter entry.
- Stop Loss: I place my stop loss slightly beyond the tip of the rejection wick. If price breaks past that tip, the rejection thesis is invalid.
- Take Profit: I target the next major structural high or low, ensuring a minimum Risk-to-Reward ratio of 1:2.
When managing multi-asset portfolios, traders often test these strategies across modern platforms such as ExpertOption or CapitalCore, which offer versatile charting tools for fast order execution. If you want to explore more technical trading guides, check out our insights on the Becoin Blog.
Common Pitfalls That Nearly Blew Up My Account Again
Even with a proven strategy, discipline is your ultimate gatekeeper. In my first six months of trading price rejections, I fell into two major traps that you must avoid:
- Trading Rejections in Low-Volatility Markets: Rejection signals work best when there is sufficient market volume. During quiet sessions with low volume, wicks can be misleading and lead to sideways whipsaws.
- Ignoring Market Structure: A price rejection against a powerful, runaway momentum trend usually fails. Trying to catch a falling knife just because a small wick formed on a 5-minute chart is a quick way to drain your equity.
To stay ahead of major market moves and avoid taking trades during unfavorable market conditions, I regularly consult market forecasts on the Becoin Forecast Hub to align my technical price action setups with broader macroeconomic expectations.
Take Your Trading to the Next Level with Becoin Premium
Mastering price action trading is a journey of refining your patience, emotional control, and analytical precision. Deleting the clutter from my charts and focusing purely on price rejection gave me the clarity I needed to stop guessing and start trading with institutional logic.
However, reading charts independently can feel overwhelming when you are sifting through hundreds of market pairs every single day.
If you want an unfair advantage, real-time market breakdowns, and institutional-grade analytical insights, join our elite trading community today. Upgrade to Becoin Premium to get daily in-depth technical analysis, precision trade setups, key price action levels, and step-by-step guidance designed to help you trade with confidence.

Trading Currency Strength Instead of Single Pairs
It was a Tuesday afternoon when I realized I was fighting a losing battle against a ghost. My screen was a chaotic web of indicators. I had the EUR/USD chart open, a moving average crossing over here, a relative strength index flashing oversold there, and a price action setup that looked textbook perfect. I clicked […]

How Understanding Market Structure Saved My Day Trading
I remember the exact moment my trading account hit zero for the third time in a single month. It was a rainy Tuesday evening, and I was staring at a 1-minute chart on my laptop screen. The price had been moving up aggressively. It looked like a flawless rocket ship to the moon. I clicked […]

Best Broker for Learning Price Action in 2026 (Tested by Real Traders)
Most traders think they need a better strategy. What they actually need is a better understanding of price. A few years ago, one of our community members had over ten indicators on his chart. RSI. MACD. Moving averages. Bollinger Bands. Stochastic. Every new YouTube video added another indicator. The result? More confusion. Not more profits. […]

Can You Start Trading with $10 on Deriv?
A lot of beginners enter trading with the same question: “Is $10 actually enough to start trading on Deriv?” The short answer is yes. But the real answer is more complicated. You can start with $10 on Deriv, but whether you can survive, learn, and grow that account depends entirely on your expectations, discipline, and […]

Deriv vs IQ Option for Synthetic Indices: Which Platform Is Better in 2026?
Synthetic indices have become one of the most talked about trading categories among beginners and experienced traders alike. Unlike forex or crypto markets that depend on real world events, synthetic indices operate 24/7 using algorithm driven price movements. That means traders can access opportunities at any time without waiting for market openings or major news […]

$10 to $50 Trading Challenge – Strategy + Real Results (Case Study)
Turning $10 into $50 sounds easy until you actually try it. Small accounts expose every weakness in your trading. One bad decision can erase hours of progress, and emotional trading becomes much harder to control when every dollar matters. This case study breaks down how a $10 account was realistically grown to $50 using a […]