
Stock Market Crashes History: Major Crashes & Lessons From the Past
Stock Market Crashes History: What the Biggest Market Crashes Can Teach Investors
Stock market crashes are among the most dramatic events in financial history. Prices can fall rapidly, investor confidence can disappear within days, and years of gains can seemingly vanish in a matter of weeks.
But there is something important about studying the stock market crashes history: crashes rarely happen in exactly the same way.
Some begin with excessive valuations. Others are triggered by financial crises, economic shocks, rising interest rates, speculation, or sudden changes in investor sentiment. What they often have in common is that fear spreads faster than investors expect.
Looking at major crashes through history therefore isn't just a trip into the past. It is a useful market history and data study that can help investors understand risk, volatility, recovery, and market behavior.
What Is a Stock Market Crash?
A stock market crash is generally understood as a severe and rapid decline in stock prices across a broad market.
There is no single percentage that officially defines a crash. A market decline of 10% is often called a correction, while a fall of 20% or more is commonly considered a bear market. A crash usually refers to a much faster and more disorderly decline.
The important point is that speed matters as much as size.
A market that falls 30% over several years behaves very differently from one that loses 30% in a few weeks.
History gives us several examples of both.
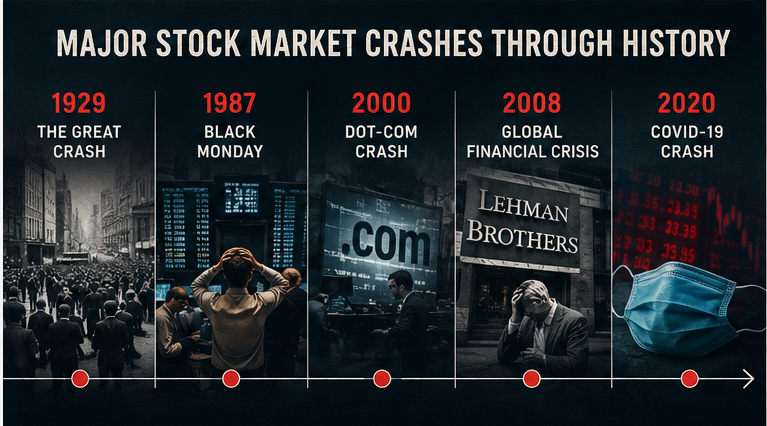
1. The Wall Street Crash of 1929
The 1929 crash is one of the most famous events in stock market history and is closely associated with the beginning of the Great Depression.
During the 1920s, optimism and speculation pushed U.S. stocks dramatically higher. Investors increasingly believed that rising prices would continue, and buying stocks with borrowed money became widespread.
That optimism eventually reversed.
In October 1929, heavy selling hit the market, producing the famous Black Tuesday decline. The market weakness continued well beyond the initial crash, and the broader economic crisis became much more severe.
The lesson from 1929 is bigger than one terrible week in October: a market decline can become an economic crisis when financial stress spreads into banks, businesses, employment, and consumer spending.
It also demonstrates why valuation, leverage, and investor psychology matter when studying market history.
2. Black Monday — 1987
Nearly six decades later, markets experienced another extraordinary event.
On October 19, 1987, the S&P 500 fell approximately 20% in a single trading session. The Federal Reserve describes the event as a major systemic shock that exposed weaknesses in trading systems and market infrastructure.
This crash is particularly interesting because it happened extremely quickly.
Program trading, portfolio insurance, derivatives, investor selling, and market liquidity problems interacted with one another. As selling accelerated, trading systems struggled to handle the enormous volume.
The lesson was clear: modern financial markets can amplify movements when investors and automated strategies all respond in the same direction.
Black Monday also changed how regulators and market participants thought about liquidity and market stability.
3. The Dot-Com Crash — 2000–2002
The next major episode was driven by a very different form of speculation.
During the late 1990s, internet companies became the center of an enormous investment boom. Investors were willing to pay extremely high prices for companies based largely on expectations of future growth.
The excitement eventually became unsustainable.
When confidence changed, technology stocks suffered enormous losses. The dot-com crash became one of the major financial disturbances identified in Federal Reserve research covering historical market stress.
The key lesson was valuation risk.
A great technology story does not automatically make every technology stock a good investment. Even a company operating in a promising industry can become a poor investment if investors pay an unrealistic price.
This distinction remains important today: a good business and a good investment are not always the same thing.
4. The Global Financial Crisis — 2008
The 2008 financial crisis is one of the most important events in modern market history.
Problems in the U.S. housing and mortgage markets eventually spread through the financial system. As losses increased and confidence in major financial institutions weakened, the crisis became global.
The bankruptcy of Lehman Brothers in September 2008 became a major turning point, after which global equity markets declined sharply. Federal Reserve records show the substantial deterioration in global equity markets and credit conditions following the Lehman failure.
Unlike Black Monday, this was not simply a one-day market shock.
It was a deep financial crisis involving banks, credit markets, housing, businesses, employment, and the broader economy.
The lesson from 2008 is perhaps one of the most important in stock market crashes history:
Financial problems can spread through interconnected systems much faster than investors expect.
It also showed why liquidity and leverage are critical when assessing financial risk.
5. The COVID-19 Market Crash — 2020
The 2020 crash was different again.
This time, the initial shock came from a global health crisis and the extraordinary economic restrictions that followed.
The S&P 500 reached a then-record high on February 19, 2020, before falling approximately 33.8% by March 23. What made the episode particularly remarkable was the speed of the decline.
S&P Global noted that the market's fall happened in less than a month, making the speed of the decline one of its defining characteristics.
Yet the recovery was also unusually fast compared with many historical crashes.
Massive fiscal and monetary support, expectations of economic reopening, and changing investor sentiment helped drive a powerful rebound.
The 2020 experience demonstrated another important feature of markets:
The speed of a crash does not necessarily tell you how long the recovery will take.
What Does the Data Tell Us?
Looking across major crashes, several patterns become visible.
| Market Event | Main Driver | Key Lesson |
|---|---|---|
| 1929 Crash | Speculation and financial stress | Leverage can magnify losses |
| 1987 Black Monday | Selling pressure and market structure | Liquidity matters |
| 2000 Dot-Com Crash | Excessive valuations | Great industries can still become overpriced |
| 2008 Financial Crisis | Credit and banking problems | Financial contagion can spread quickly |
| 2020 COVID Crash | Global economic shock | Markets can fall and recover with extraordinary speed |
This comparison shows why simply asking, “How much did the market fall?” isn't enough.
Investors should also ask:
- What caused the decline?
- How quickly did prices fall?
- Was the financial system under pressure?
- How leveraged were investors?
- How long did recovery take?
- What happened to the broader economy?
These questions turn historical market data into something much more useful.
The Most Important Pattern: Crashes Are Not Identical
One of the biggest mistakes investors can make is assuming that every market crash follows the same script.
The 1929 crash developed into a prolonged economic depression. Black Monday was extraordinarily severe but remarkably concentrated in a short period. The dot-com crash was largely associated with technology valuations. The 2008 crisis was deeply connected to credit and financial institutions. The 2020 decline was caused by an extraordinary global shock and was followed by a rapid rebound.
The causes were different.
The market structures were different.
The policy responses were different.
And the recovery periods were different.
That is why historical data should be used to understand patterns, not to predict an exact future outcome.
What Investors Can Learn From Stock Market Crashes History
The greatest value of studying crashes isn't predicting the next crash.
It is preparing for the possibility that one will eventually happen.
History repeatedly shows that markets can remain calm for long periods before volatility suddenly increases. It also shows that investor psychology can shift extremely quickly.
Three lessons stand out.
First, diversification matters.
Concentrating too much wealth in one company, industry, or asset class can make a portfolio especially vulnerable during a crisis.
Second, leverage increases risk.
Borrowed money can magnify gains, but it can also turn a temporary market decline into a permanent loss if positions have to be sold.
Third, time matters.
A crash can look catastrophic when viewed day by day. Historical data provides a longer perspective and helps separate temporary price shocks from lasting changes in economic fundamentals.
Final Takeaway
The history of stock market crashes is not simply a collection of frightening charts and dramatic headlines.
It is a record of how investors behave when confidence, liquidity, valuations, and economic expectations collide.
From 1929 to 1987, 2000, 2008, and 2020, every major crash had its own trigger. Yet the recurring themes are surprisingly familiar: excessive optimism, leverage, changing expectations, liquidity pressure, and fear.
That is what makes stock market crashes history such a valuable area of market research.
The goal isn't to assume that the next crash will look like the last one.
The goal is to understand what history has already shown us—so that when markets become unusually calm, unusually expensive, or suddenly chaotic, investors can recognize the risks with a clearer perspective.

Deriv vs IQ Option for Synthetic Indices: Which Platform Is Better in 2026?
Synthetic indices have become one of the most talked about trading categories among beginners and experienced traders alike. Unlike forex or crypto markets that depend on real world events, synthetic indices operate 24/7 using algorithm driven price movements. That means traders can access opportunities at any time without waiting for market openings or major news […]
Biggest Beginner Mistakes That Kill Trading Accounts
Trading looks simple from the outside. Open an account, place a few trades, and grow your balance. But reality is different. Most beginners do not lose because markets are impossible. They lose because they repeat the same avoidable mistakes. A small account can survive bad market conditions. What usually kills it is poor decision-making, emotional […]

Why Market Open Hours Create the Best Trading Opportunities
I used to think trading was a 24-hour conveyor belt of endless cash. In my earliest days, armed with a laptop, a hot cup of coffee, and far too much unearned confidence, I would stare at charts at 11:00 PM on a Tuesday. The candles barely moved. They crawled across my screen like snails on […]

The Clock and the Cash: My Journey into the Hidden Rhythm of Session-Based Trading
There was a time when I thought the global financial market was a single, monstrous wave that never stopped moving. I believed that if I sat in front of my monitors long enough, clicking buttons whenever a pretty pattern appeared on my charts, the market would eventually reward my sheer endurance. I was dead wrong. […]

The Rookie Dashboard: My Raw Hunt for the Best Beginner Broker in 2026
We have all been there. It is late at night, your morning coffee is hours away, and you are staring at a screen pulsing with bright green and red lines. You have twenty dollars burning a hole in your digital wallet and a sudden, burning desire to conquer the financial markets. That was me exactly […]

Finding My Perfect Workspace: The Search for the Best Broker for My Daily Trading Routine
The alarm goes off at 6:00 AM. By 6:30 AM, I am sitting in front of my monitors with a steaming mug of black coffee. The house is completely quiet, the market is preparing its next major move, and my charts are completely bare. This is my daily sanctuary. For a long time, this morning […]