
How to Use Economic Calendars Effectively
The screen of my laptop cast a cold, blue glow across my desk. It was 6:29 PM, and I was staring at a USD/JPY chart that looked entirely peaceful. The price was moving sideways in a tight, predictable range. Having spent weeks studying price action, I felt confident. I loaded up a position, expecting a clean breakout based on my support levels.
At exactly 6:30 PM, the peaceful chart turned into a financial horror story.
A single red candle materialized out of nowhere, slicing through my stop loss like a hot knife through butter. Within three seconds, my account balance took a massive hit. I sat there in absolute silence, my heart hammering against my ribs, completely bewildered by what had just occurred. I had done everything right according to my technical analysis.
What I didn't realize back then was that the United States Core Consumer Price Index (CPI) numbers had just dropped. The entire global market didn't care about my support lines; it was reacting to raw macroeconomic data. That devastating evening taught me a lesson that altered my entire approach to the markets: ignoring fundamental data is the fastest way to blow an account.
That experience marked the turning point when I stopped guessing and started studying how to integrate macro events into my routine. If you want to dive deeper into my early struggles with finding the right workspace, check out my journey in finding my perfect workspace and the search for the best broker for my daily trading routine.
Decoding the Blueprint of Global Markets
After that brutal reality check, the economic calendar became the very first tool I opened every single morning before looking at a single chart. Think of the calendar not as a boring spreadsheet of numbers, but as a map showing exactly when the market is going to experience a massive wave of volatility.
When you look at a modern calendar, it breaks down data into columns that tell a story. You have the time of the release, the currency or country affected, and the asset's historical performance. However, the true mechanics of news-driven price action lie in three specific columns:
- Previous: The economic figure reported during the last release cycle.
- Forecast (or Consensus): What the collective world of institutional analysts expects the new number to be.
- Actual: The real-time figure that drops at the exact second of the release.
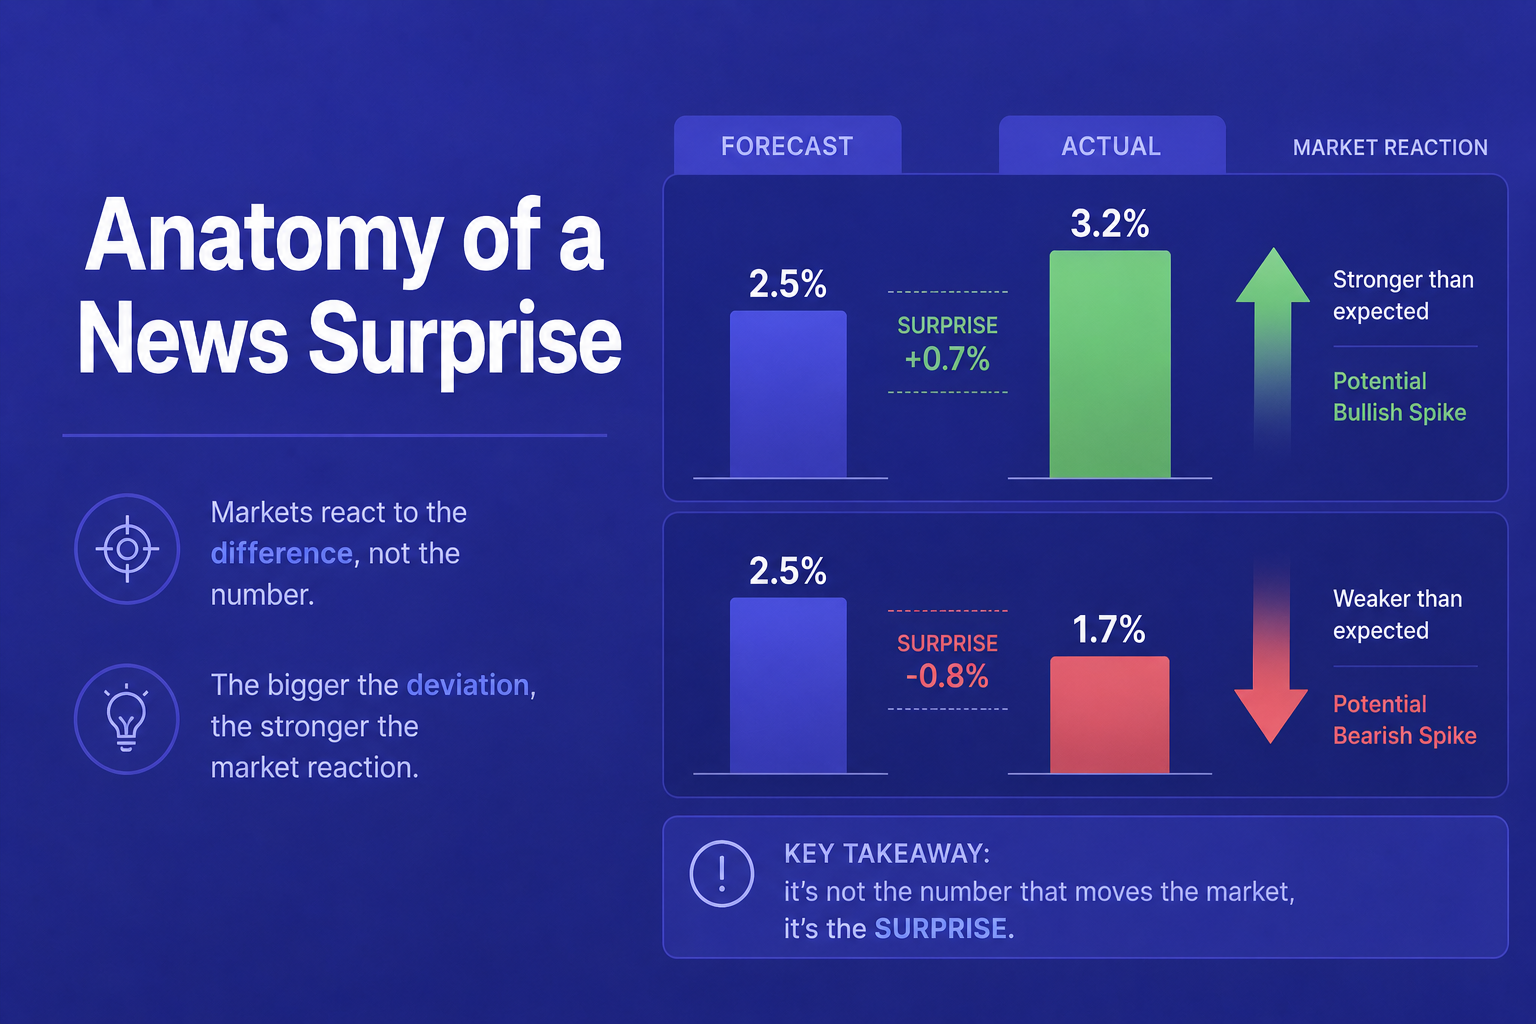
The market is a forward-looking machine that constantly prices in the future. The forecast represents what the market already believes to be true. Volatility is not necessarily caused by a bad economic number; it is caused by the gap between the forecast and the actual release.
If the market expects an unemployment rate of 3.5% and the actual number drops at 3.2%, the economy is stronger than anticipated. The currency will almost always spike instantly. If you are trying to build consistency, you must understand these core metrics. Beginners often struggle because they treat every asset the same, but as I learned later,why some assets are easier to predict than others comes down to how they respond to these precise economic triggers.
Filtering Out the White Noise
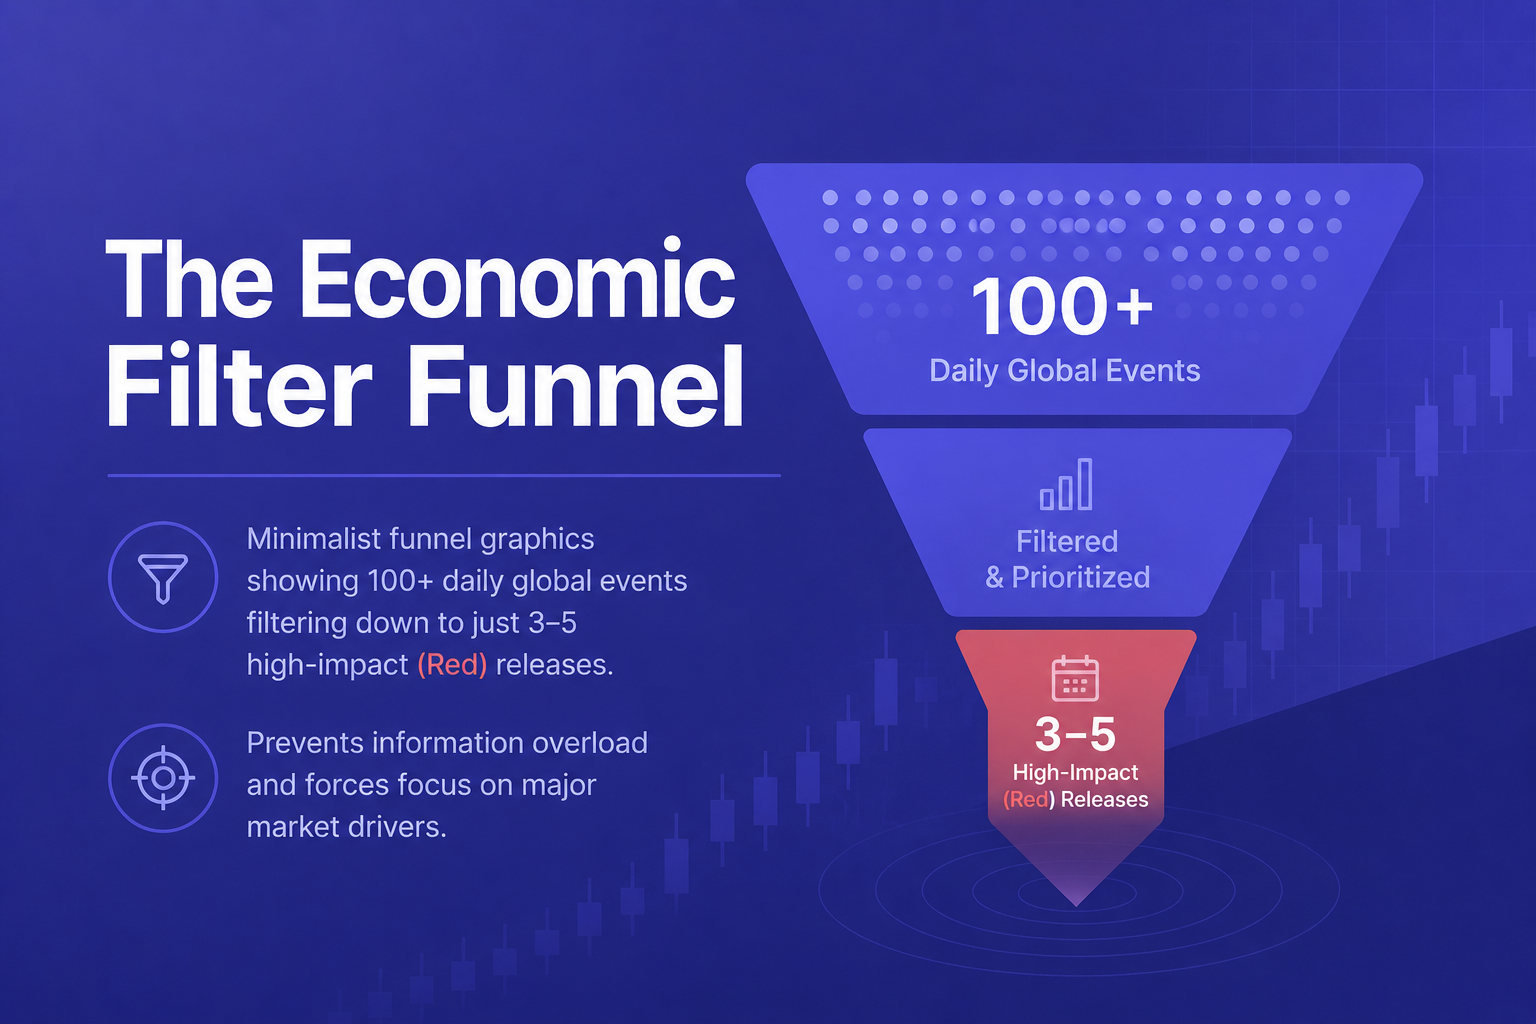
When I first committed to using the calendar, I made a massive rookie mistake: I tried to track every single event. My screen was a chaotic mess of German retail sales, Australian consumer confidence, and Canadian wholesale trade. It resulted in severe analysis paralysis. I was terrified to take any trades because something was constantly being released.
I quickly learned to utilize filters to isolate the data that actually impacts my specific portfolio. Most calendars classify events into three tiers of expected volatility:
Low Impact (Yellow/Gray)
These are minor surveys or secondary reports. They rarely move the needle, and you can safely ignore them during your daily planning.
Medium Impact (Orange)
These reports can cause moderate, temporary fluctuations. They are worth noting if you are actively scalping, but they rarely alter a major trend.
High Impact (Red)
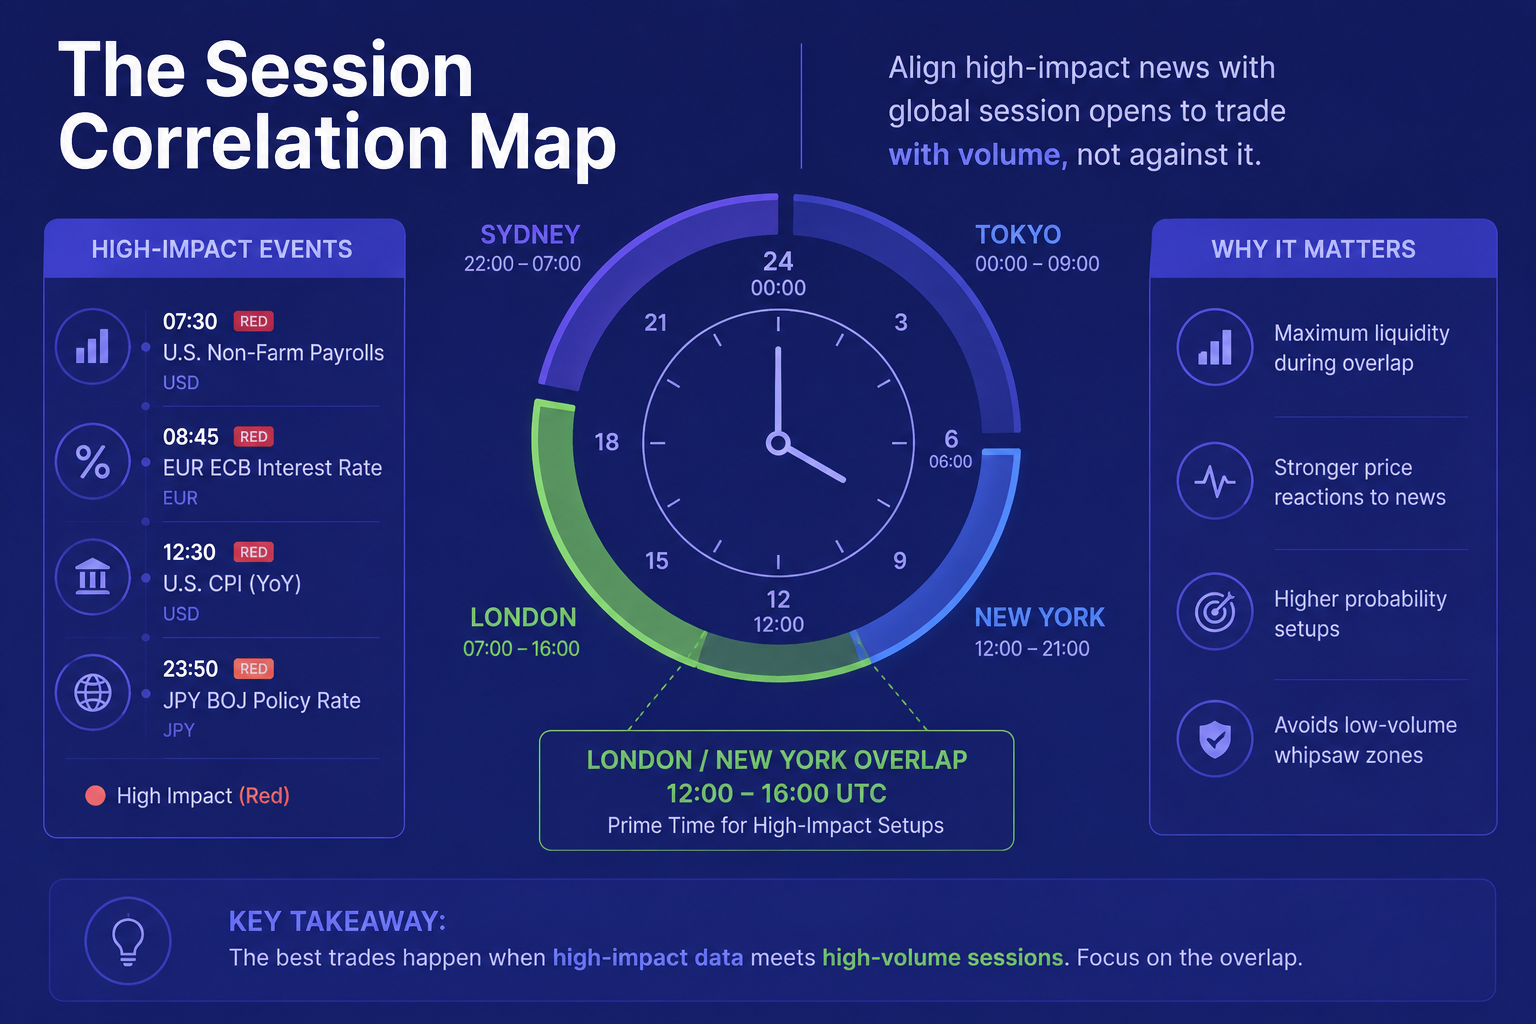
These are the heavy hitters. We are talking about Central Bank Interest Rate Decisions, the U.S. Non-Farm Payrolls (NFP), and inflation data like the CPI. These events alter global capital flows, redefine structural trends, and can cause immense slippage if you are caught on the wrong side.
By filtering my view to show only high-impact events for the specific currencies I intended to trade, my workspace transformed from a chaotic mess into an efficient dashboard. I could easily plan my day around the moments when the big institutional players were active. For anyone just starting out, keeping things visually clean is critical. If you are still searching for a platform that won't overwhelm you, take a look at my analysis on which broker has the cleanest interface with a real comparison for beginners in 2026.
Crafting Your News Trading Framework
Once I understood how to read the data, I had to develop a practical routine to execute around it. Over years of trial and error, I found that the best approach relies on clear, structured rules before, during, and after a high-impact release. Here is the exact playbook I use today.
Step 1: The Pre-Session Filter
Before I open my execution platform, I look at the high-impact calendar events for the next twelve hours. If I am looking to trade Euro pairs, and the European Central Bank has an interest rate decision in the afternoon, I mark that exact time down and treat it as a hard deadline. This quick step helps you avoid catastrophic surprises.
Step 2: Choosing Your Strategic Stance
You have two primary ways to handle a high-impact news event. The first option is to protect your capital by stepping away. If I have an open position nearing a major red event, I will either close the trade completely or aggressively trail my stop loss to secure profits. The second option is to actively trade the volatility, but never at the exact second the news drops.
Step 3: Executing the Post-Release Retest
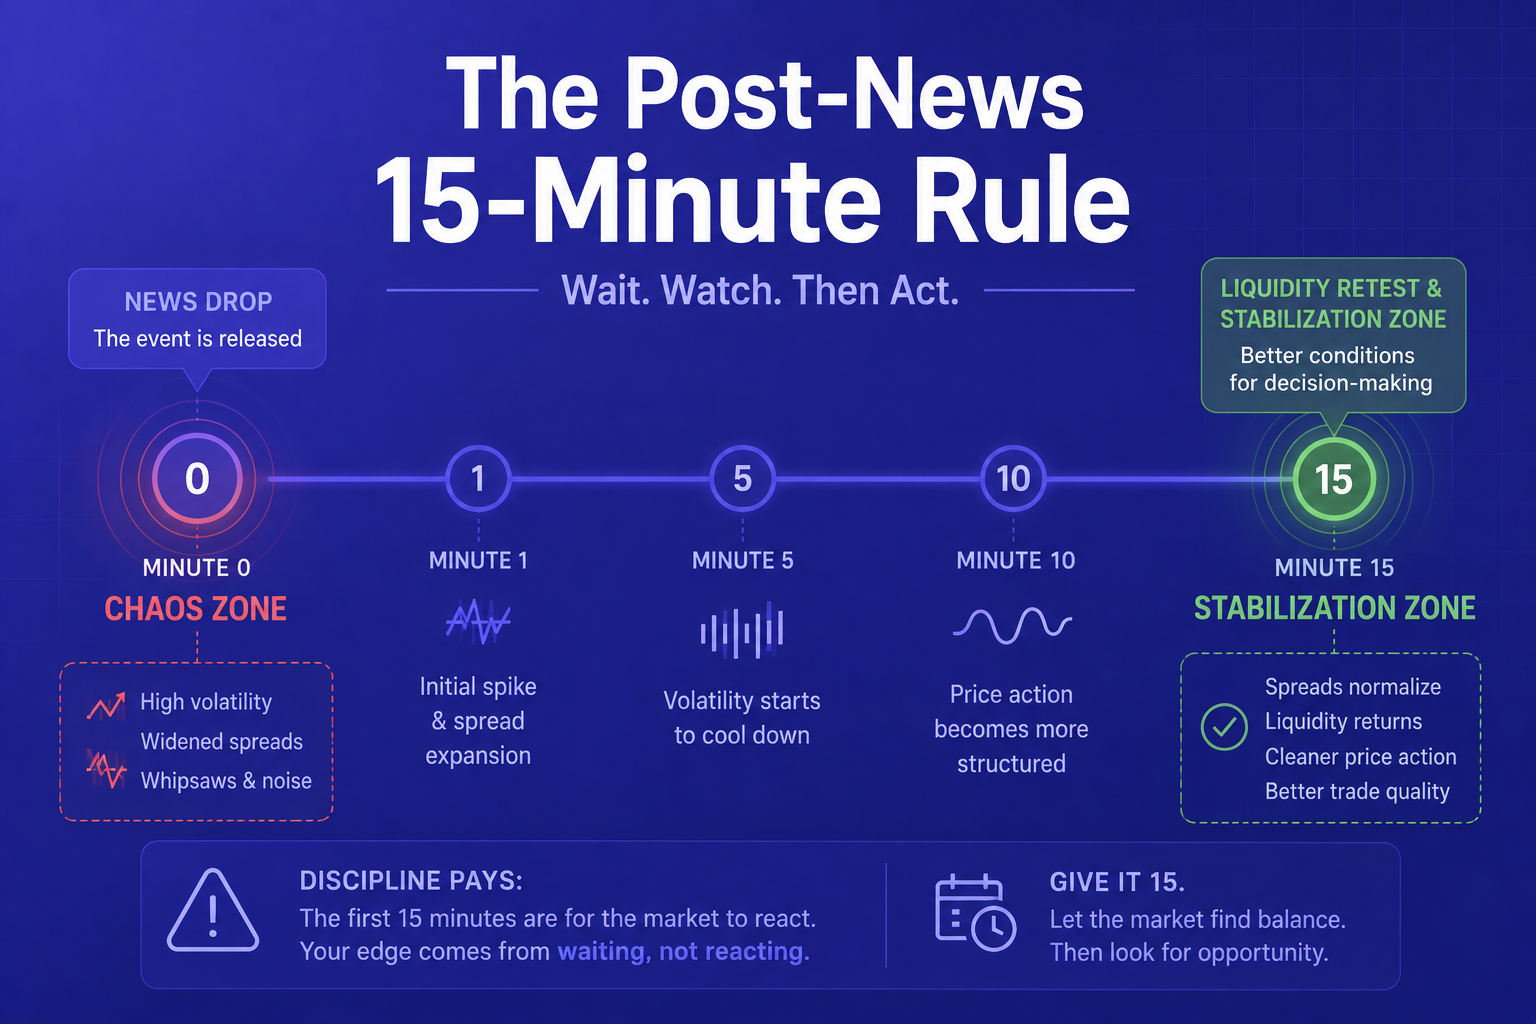
When a high-impact number hits the wires, the first three to five minutes are usually characterized by wild, erratic spikes in both directions as algorithmic systems battle for liquidity. Trading during these initial minutes is pure gambling. Instead, I wait for the initial dust to settle.
I look for the market to establish a clear directional push, and then I wait for a pullback to a major technical structure or a fair value gap. This allows me to use technical analysis on a micro level while trading in alignment with the freshly established fundamental momentum.
Learning to sit out the initial chaos was a massive hurdle for me. If you struggle with the urge to trade every single market tick, you might find solace in my personal experience on how I learned to sit on my hands during choppy markets.
Selecting the Right Tools for Your Routine
Having a solid fundamental strategy won't mean much if your execution venue fails you when volatility spikes. During high-impact news events, spreads can widen drastically, and slow platforms can suffer from severe execution delays.
If you are looking for a reliable environment to practice matching your chart setups with upcoming economic releases, choosing a well-optimized, user-friendly interface makes an immense difference. Platforms like IQ Option provide exceptionally clean charts that allow you to track asset prices smoothly as news breaks. Alternatively, options like Binomo offer a highly streamlined experience for traders who prefer execution without complex, distracting features.
For those who want to compare how these platforms stack up head-to-head in terms of user experience and layout, check out my deep-dive breakdown on the rookie dashboard and my raw hunt for the best beginner broker in 2026.
From Guesswork to Calculated Edge
Integrating an economic calendar into my trading plan took me out of the cycle of emotional guessing and placed me firmly into the realm of structured, professional risk management. I stopped being a victim of sudden market moves and started using them to my advantage.
However, looking at a schedule of times is only the first step. True profitability comes from knowing how to synthesize that data with market structure, order flow, and long-term liquidity targets. It requires moving past basic definitions and mastering the nuances of macroeconomic trends.
If you want to stop trading blindly and finally establish a real, data-backed edge in the markets, you don't have to navigate the complex world of institutional data on your own. Join Becoin Premium to gain access to our expert, in-depth fundamental analysis and premium market forecasts. For a closer look at our daily insights and advanced setups, explore the Becoin Forecast Hub and elevate your execution strategy today.

Deriv vs IQ Option for Synthetic Indices: Which Platform Is Better in 2026?
Synthetic indices have become one of the most talked about trading categories among beginners and experienced traders alike. Unlike forex or crypto markets that depend on real world events, synthetic indices operate 24/7 using algorithm driven price movements. That means traders can access opportunities at any time without waiting for market openings or major news […]

Deriv Volatility 75 Strategy Backtest: What Actually Works After 1,000 Trades?
The first time I tried trading Volatility 75, I thought I had found the perfect market. No news shocks. No central banks. Just clean, continuous price movement. Within two weeks, I blew my first account. That experience forced me to stop guessing and start testing. Instead of chasing indicators or copying strategies from forums, I […]

Which Broker Has Better Risk Management Tools?
The burning smell of my own account blowing up is a scent I will never forget. It was a rainy Tuesday afternoon a few years back. I sat huddled over my laptop, watching a currency pair oscillate. Confident, arrogant, and entirely unprotected, I clicked buy. Minutes later, a sudden market spike completely wiped out my […]

Safest Broker for Small Deposits in 2026
Looking for the safest broker for small deposits in 2026? Discover beginner-friendly trading platforms with low minimum deposits, reliable withdrawals, risk controls, and the best options for starting safely with limited capital. Starting trading with a small amount of money sounds easy until you actually deposit real funds. Most beginners quickly realize that choosing the […]
Best Trading Platform for Slow Internet in 2026
A slow internet connection can ruin trades faster than a bad strategy. Charts freeze, apps reload, and delayed execution creates unnecessary losses. This is especially common for traders using mobile data, shared WiFi, or older smartphones. Most broker reviews ignore this issue completely. After testing multiple platforms on weaker connections and low-end Android devices, some […]
Can You Use Signals or Bots With Capital Core? What Actually Works
If I had to name one trap that almost pulled me off course on Capital Core, it would be this: believing that someone else’s signals or some “smart bot” would make short-expiry trading easier than it really is. That idea is everywhere. You see it in Telegram groups. You see it in YouTube comments. You […]