GBP/USD Forecast: 1.3540 Resistance Keeps the 1.3453 Retest Alive
Cable Keeps Failing at the Same Address
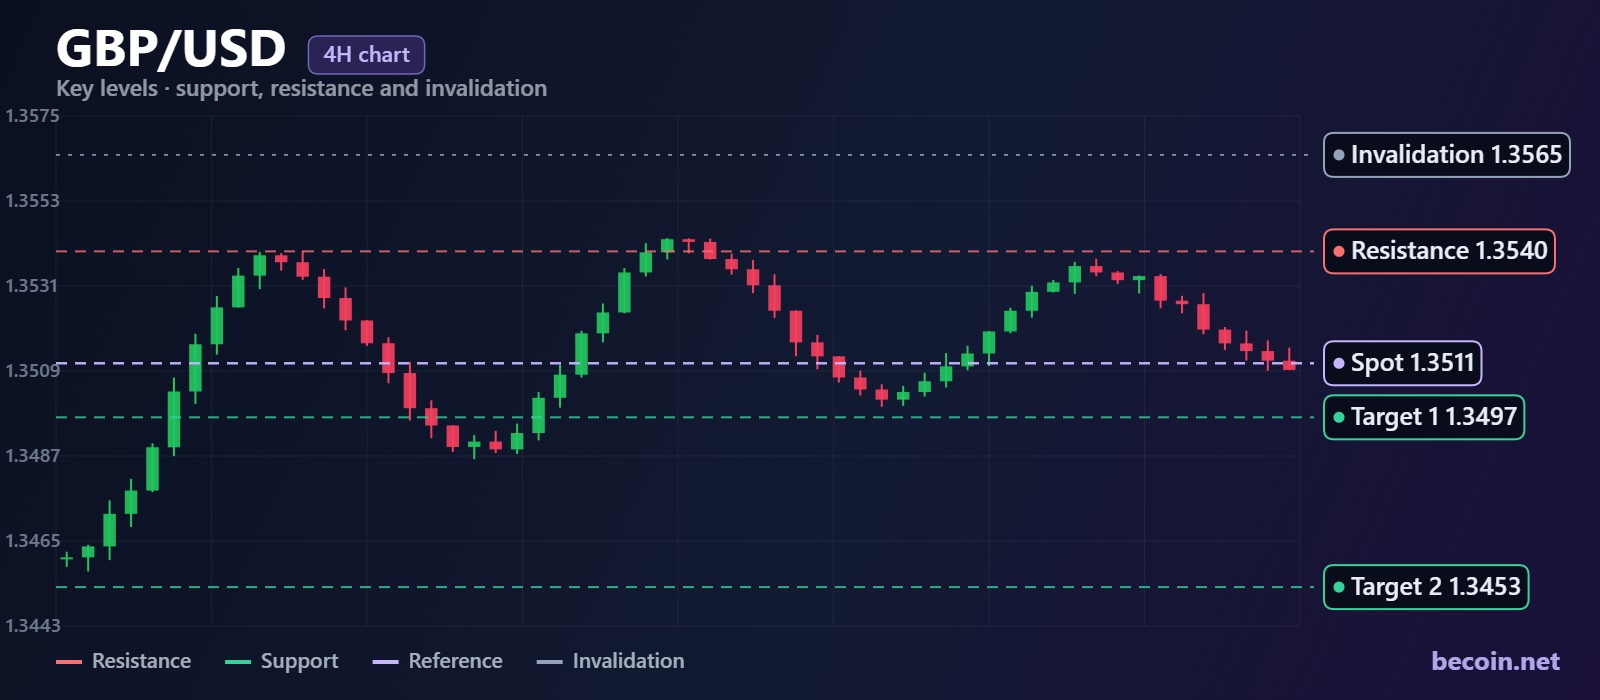
GBP/USD has developed an expensive habit. Price pushes into the 1.3530 to 1.3540 band, produces a candle with an upper wick, and slides back toward the mid-1.3490s. It has now done this often enough that the zone deserves to be treated as structure rather than coincidence.
The interesting part is that each failure has been shallower than the last on the downside. Sellers are getting their rejection but not their follow-through, which is why this looks more like a pullback inside a larger advance than the start of a trend reversal.
Why the GBP/USD Forecast Hinges on 1.3540
The 1.3530 to 1.3540 band is where the last distribution occurred, and it sits directly beneath a cluster of prior highs. That combination gives it two sources of supply: participants trapped from the last attempt and fresh sellers using the round number as a reference.
Until a four-hour candle closes above 1.3545 and the next one holds, any read that assumes a breakout is fighting the evidence. The zone has not merely capped price; it has reversed it quickly each time, which is a stronger signal than a slow stall.
1.3497 and 1.3453 Are the Working Targets
On the downside, the structure points at two specific numbers rather than a vague area. The first is 1.34967, which lines up with the shallow retracement of the last leg higher and has already acted as a magnet on two occasions. The second is 1.34531, a deeper retracement that coincides with the origin of the move.
The distinction matters for how you manage the trade. The first target is where a normal pullback ends inside a healthy uptrend. The second is where the uptrend starts having to prove itself again. Reaching 1.3497 is routine. Reaching 1.3453 would be a change in tone.
The Rate Story Behind the Chart
Sterling has been caught between a domestic inflation picture that refuses to normalise cleanly and a dollar that has not been given a reason to trend. UK data has been just firm enough to keep aggressive easing bets off the table and just soft enough to prevent a genuine rally.
The result is a pair trading on positioning rather than conviction. That is precisely the environment that produces repeated failures at the same level, because nobody has enough confidence to pay through a known supply zone. It also means the break, whenever it comes, is more likely to follow a data release than to develop gradually.
A Practical Way to Frame the Setup
The higher-probability structure is selling rejections in the 1.3530 to 1.3540 band with invalidation above 1.3565, taking the first objective at 1.3497 and holding a portion for 1.3453. The counter-trade only becomes valid on a confirmed close above resistance, at which point the whole pullback thesis is finished and the prior highs come back into play.
Anyone who prefers to have these bands maintained rather than redrawn each session can follow the currency scenarios published in Becoin.net Premium Forecast, which tracks the same resistance zones and retracement targets across the majors. The coverage tiers are detailed on Becoin.net Tariff Plans for anyone weighing up what they actually need.
What Would Break This Idea
A four-hour close above 1.3565 invalidates the pullback read. It would confirm that the repeated rejections were absorption rather than distribution, and it would put the prior highs back within reach quickly.
The bearish extension risk sits below 1.3453. A close beneath that level would take the move out of pullback territory and into reversal territory, and the structure would need rebuilding from scratch. Between those two lines, cable remains a level-to-level market, and the levels have been reliable enough to trust.

Which Broker Has Better Risk Management Tools?
The burning smell of my own account blowing up is a scent I will never forget. It was a rainy Tuesday afternoon a few years back. I sat huddled over my laptop, watching a currency pair oscillate. Confident, arrogant, and entirely unprotected, I clicked buy. Minutes later, a sudden market spike completely wiped out my […]

EUR/USD holds 1.1414 before the ECB decision: three scenarios
EUR/USD traded near 1.1414 before the ECB’s July decision. Here is what a hold, hawkish hold or surprise hike could mean for 1.1350 and 1.1480.

WTI reaches $89.43 as Brent clears $95 on renewed supply risk
WTI traded near $89.43 while Brent moved above $95 as Middle East shipping risk lifted crude for a fifth session. Key levels, catalysts and invalidation.

Trading Currency Strength Instead of Single Pairs
It was a Tuesday afternoon when I realized I was fighting a losing battle against a ghost. My screen was a chaotic web of indicators. I had the EUR/USD chart open, a moving average crossing over here, a relative strength index flashing oversold there, and a price action setup that looked textbook perfect. I clicked […]

How Liquidity Affects Day Trading Results
When I first started trading day trading, I believed success was all about finding the perfect indicator. I spent weeks testing moving averages, RSI settings, support and resistance levels, and dozens of YouTube strategies that promised easy wins. Some worked for a few trades, but most failed. What confused me was that the same setup […]

How Understanding Market Structure Saved My Day Trading
I remember the exact moment my trading account hit zero for the third time in a single month. It was a rainy Tuesday evening, and I was staring at a 1-minute chart on my laptop screen. The price had been moving up aggressively. It looked like a flawless rocket ship to the moon. I clicked […]