
Dogecoin Forecast: DOGE at 0.08167 Under 0.08251
- DOGE trades at 0.08167, effectively flat on the day and beneath three of its four moving averages.
- Large holders bought roughly 376 million tokens, around $32 million, in a single 24-hour window on 1 September.
- 0.08251 is the level that decides the next move: the nearest average, and the floor of the cluster capping price.
Fundamental Analysis: Dogecoin (DOGE)
The most concrete recent development is on-chain rather than corporate. Large holders accumulated approximately 376 million DOGE, worth around $32 million, within a 24-hour window on 1 September, coinciding with a technical reversal attempt. Concentrated buying of that size usually precedes either a breakout or a distribution, and which of the two it turns out to be depends entirely on whether price can clear the 0.09 area that has capped every attempt since late August.
The offsetting developments are smaller but point the other way. MyDoge is discontinuing support for Doginals and DRC-20 tokens on 17 September after its infrastructure provider shut down its Dogecoin interface, which trims an already narrow utility layer. Wider fund flows have also favoured the largest assets: August's inflows concentrated in bitcoin and ether products, with the dominant bitcoin fund absorbing roughly 62% of the month's total, leaving little spillover for the memecoin complex.
The balance leaves Dogecoin dependent on liquidity conditions rather than any internal catalyst. It remains one of the highest-beta expressions of crypto risk appetite, which is useful when the tape is rising and punishing when it is not. Signals that platforms may broaden memecoin listings would help sentiment, but nothing scheduled changes the asset's fundamentals.
Technical Analysis: Dogecoin (DOGE)
The 4-hour chart shows a base near 0.0700 through mid-August, a near-vertical advance into the 0.0995 spike on 22 August, and a controlled decline since that has retraced most of the move. Price at 0.08167 sits below the 0.08251, 0.083141 and 0.08415 averages, which have rolled over and now form a descending ceiling, while the 0.079419 line rises from beneath.
Resistance is 0.08251, then the 0.083141-0.08415 band, with 0.0900 the level that would confirm the whale accumulation as a genuine reversal. Support is 0.079419, the slowest average, and beneath that the 0.0750 shelf. A close under 0.079419 would invalidate the accumulation read and put the pre-rally 0.0700 base back into play.

The Clock and the Candle: How I Stopped Guessing the Best Time to Trade Day Trading
I still remember the night I blew my third trading account. It was 11:30 PM. The house was completely quiet, the market charts on my screen were barely crawling, and I was forcing trades out of pure impatience. I kept staring at a flatline asset, placing one-minute positions, convinced that the market owed me a […]

The Day I Lost My First Ten Dollars: My Hunt for the Best Mobile Trading App for Beginners
I still remember the exact shape of the cloud outside my window when my first live trade ended in the red. It was a crisp morning, and I was sitting on my couch with a lukewarm cup of coffee, staring at a flashing line on my smartphone screen. I had just deposited ten bucks, convinced […]

Is Capital Core Safe or a Scam? What Day Traders Should Know Before Depositing
I’ll be honest: the first time I landed on Capital Core, I didn’t feel excited. I felt suspicious. That might sound strange coming from someone who has spent years around day trading and offshore brokers, but if you’ve traded long enough, you know the pattern. A polished homepage. Big payout claims. A low minimum deposit. […]
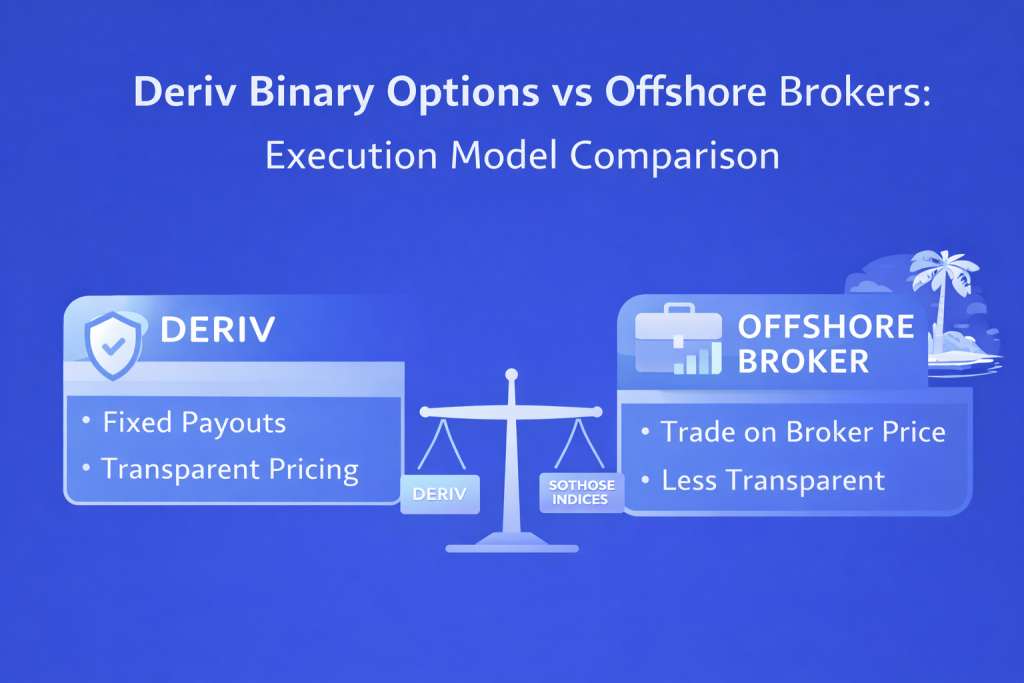
Deriv Day Trading vs Offshore Brokers: Execution Model Comparison
I did not start my trading journey thinking about execution models. Like most beginners, I started with charts, indicators, and the belief that if I could just find the right entry signal, profits would follow. My early trading notebook was full of screenshots of RSI signals, candlestick patterns, and support levels. What it did not […]

EUR/USD holds 1.1414 before the ECB decision: three scenarios
EUR/USD traded near 1.1414 before the ECB’s July decision. Here is what a hold, hawkish hold or surprise hike could mean for 1.1350 and 1.1480.

How Liquidity Affects Day Trading Results
When I first started trading day trading, I believed success was all about finding the perfect indicator. I spent weeks testing moving averages, RSI settings, support and resistance levels, and dozens of YouTube strategies that promised easy wins. Some worked for a few trades, but most failed. What confused me was that the same setup […]