2008 Financial Crisis Statistics: The Numbers Behind the Global Market Crash
2008 Financial Crisis Statistics: The Numbers Behind the Global Market Crash
The 2008 financial crisis remains one of the most important events in modern market history. What began with weaknesses in the U.S. housing and mortgage markets developed into a global financial shock, sending stocks lower, freezing credit markets, increasing unemployment and triggering a deep recession.
Looking at the 2008 financial crisis statistics helps explain just how severe the collapse was—and why its effects continued long after the market bottom.
The 2008 Financial Crisis at a Glance
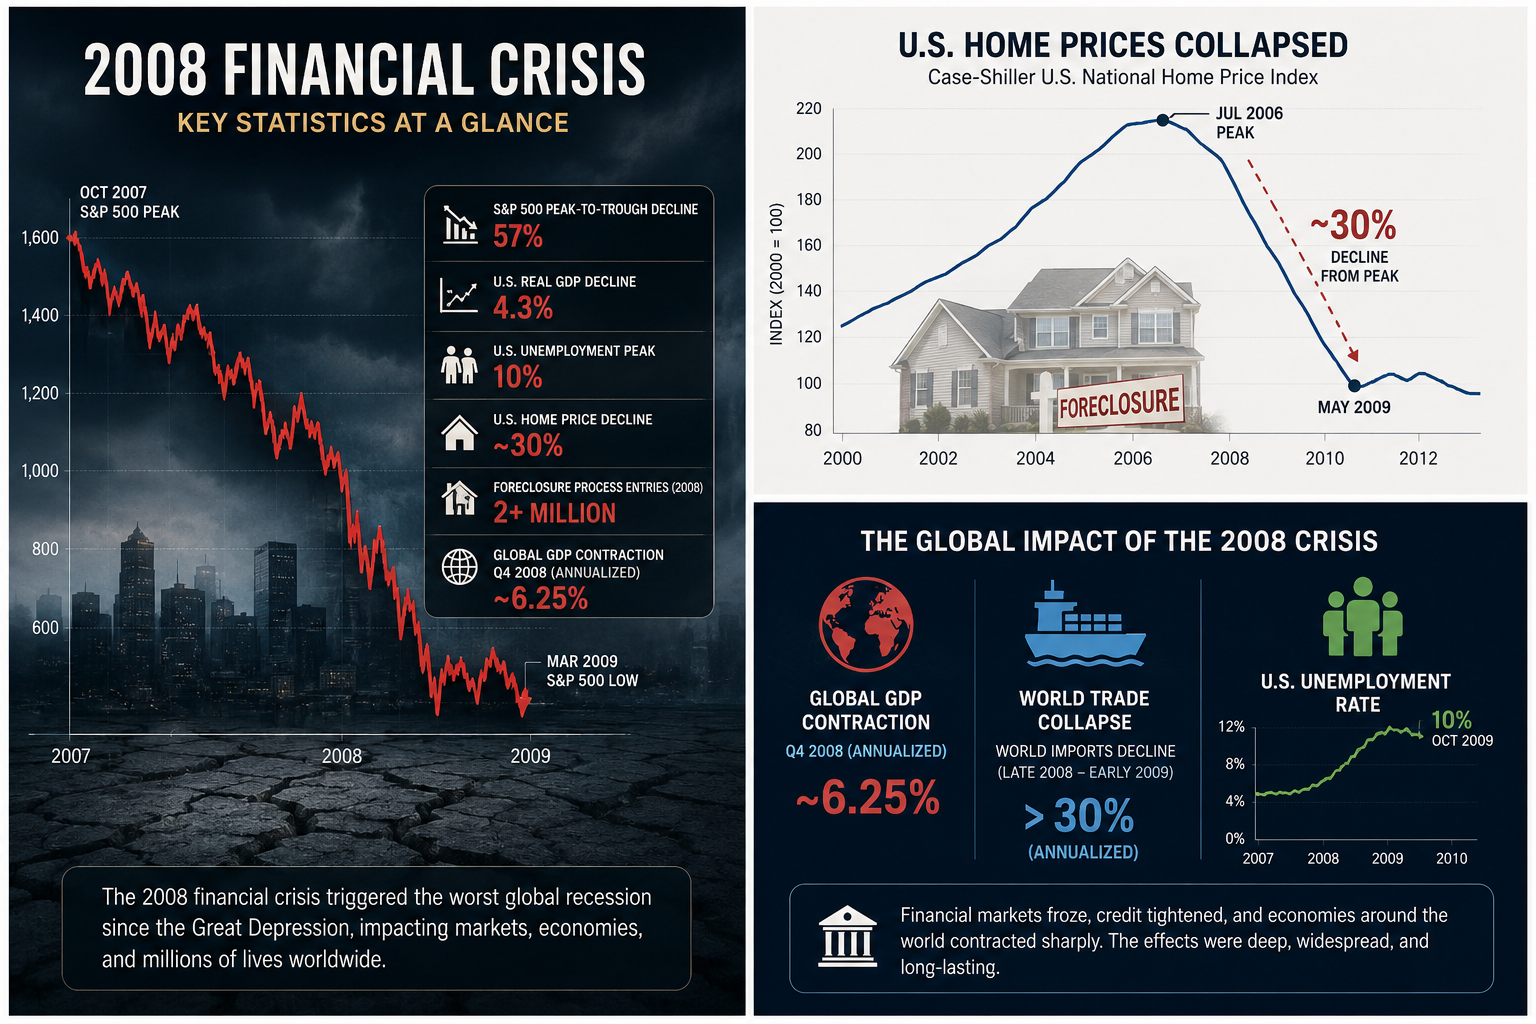
The U.S. recession officially began in December 2007 and ended in June 2009, making it the longest U.S. recession since World War II at the time. Real U.S. GDP fell approximately 4.3% from its 2007 peak to its 2009 trough.
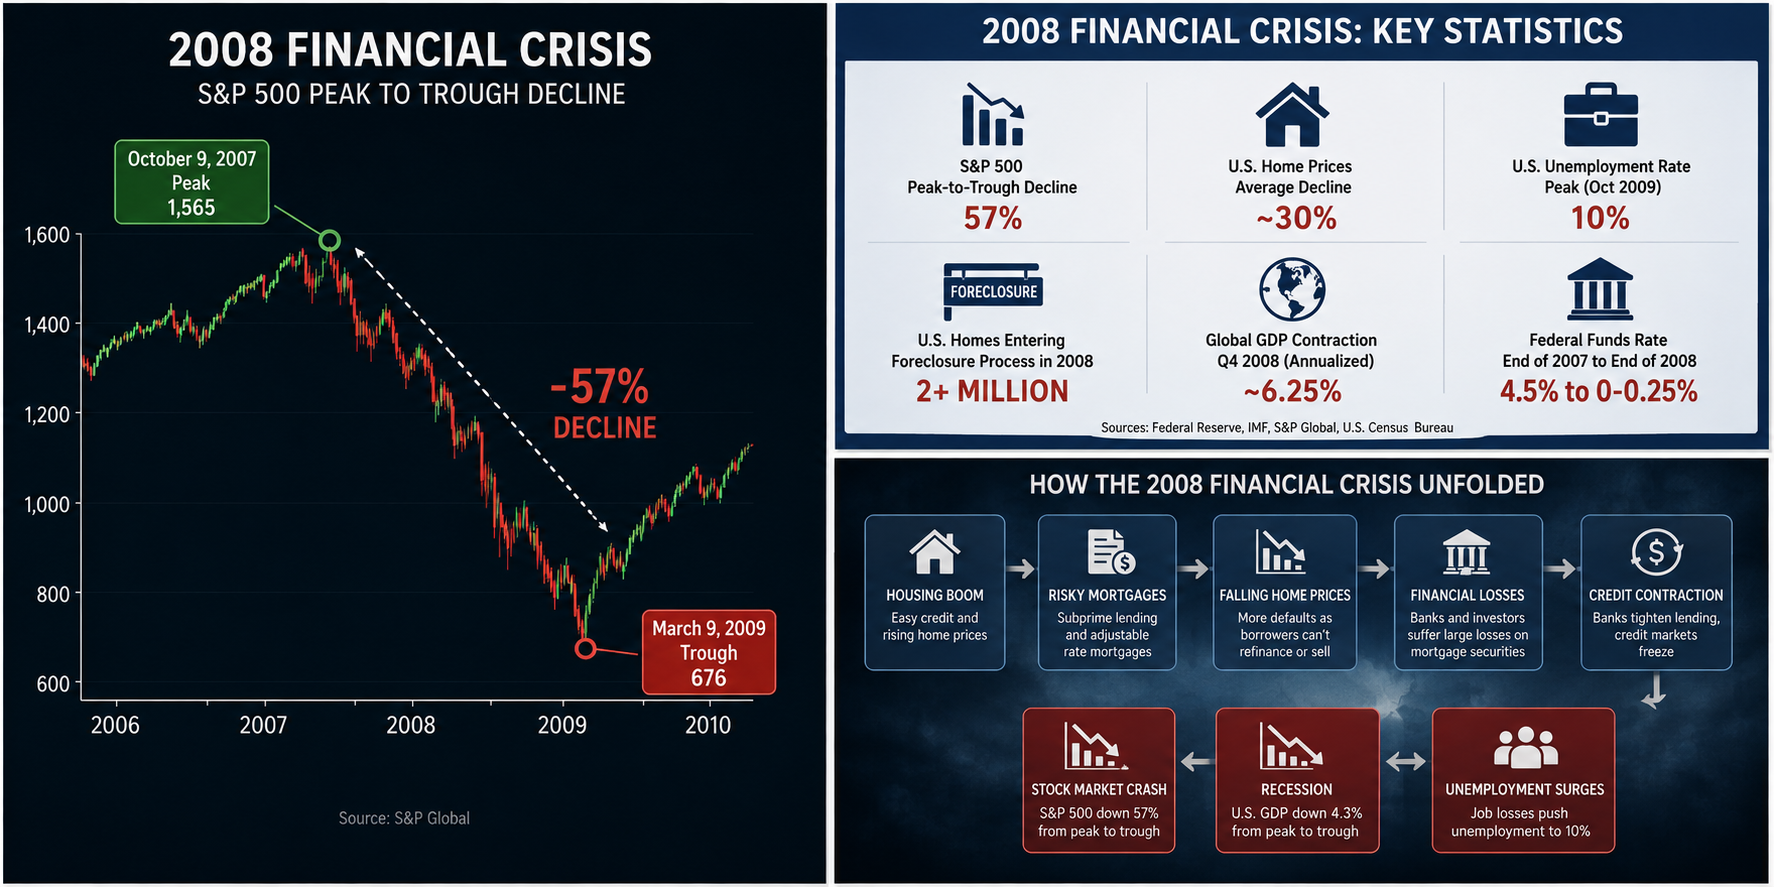
The stock market experienced an even more dramatic decline. The S&P 500fell about 57% from its October 2007 peak to its March 2009 low, wiping out trillions of dollars in market value and dramatically changing investor sentiment.
| 2008 Crisis Statistic | Approximate Figure |
|---|---|
| S&P 500 peak-to-trough decline | 57% |
| U.S. real GDP peak-to-trough decline | 4.3% |
| U.S. unemployment peak | 10% |
| Average U.S. home-price decline | ~30% |
| U.S. foreclosure process entries in 2008 | 2+ million |
| Global GDP contraction, Q4 2008 annualized | ~6.25% |
Housing Was at the Center of the Crisis
One of the clearest 2008 financial crisis statistics was the collapse in housing.
U.S. home prices had risen dramatically during the preceding housing boom. Once prices started falling, borrowers with risky mortgages increasingly struggled to refinance or sell their properties. Falling collateral values then increased losses for financial institutions holding mortgage-related assets.
From the mid-2006 peak to mid-2009, U.S. home prices fell approximately 30% on average.
Foreclosures also surged. Federal Reserve data indicate that more than 2 million homes entered the foreclosure process during 2008, compared with roughly 1.5 million in 2007.
The decline became self-reinforcing: falling prices increased mortgage problems, rising foreclosures added distressed properties to the market, and tighter credit made it harder for buyers and homeowners to refinance.
Unemployment and the Real Economy
The financial crisis quickly moved beyond Wall Street.
At the beginning of the recession, the U.S. unemployment rate was around 5%. It eventually reached 10% in October 2009.
The labor market deteriorated especially quickly during the second half of 2008. Between the start of the recession in December 2007 and January 2009, private payroll employment declined by approximately 3.75 million jobs.
This demonstrates an important feature of financial crises: markets can react first, but the economic consequences often appear later through falling investment, weaker consumption, business closures and job losses.
The Global Market Shock
The crisis did not remain confined to the United States.
As banks and investors reduced risk, global financial conditions tightened and international trade collapsed. The IMF estimated that global GDP contracted at an annualized rate of roughly 6.25% in the fourth quarter of 2008, while advanced economies experienced an even sharper decline.
World trade suffered one of its most dramatic modern contractions. During the period covering late 2008 and early 2009, the annualized decline in world imports exceeded 30%.
For investors, this was a crucial lesson: financial stress can spread rapidly through interconnected banks, credit markets, currencies, commodities and international trade.
Interest Rates Hit Emergency Levels
Monetary policy also changed dramatically.
The Federal Reserve reduced its federal funds target from 4.5% at the end of 2007 to 2% by September 2008. As the crisis intensified, rates were pushed toward an effective floor of 0–0.25% by the end of 2008.
The Fed also introduced extraordinary liquidity measures and later large-scale purchases of Treasury and mortgage-backed securities, helping establish the era of quantitative easing.
What the 2008 Statistics Teach Investors
The most important lesson from the 2008 financial crisis statistics is that major market crashes rarely come from a single number.
The crisis developed through a chain reaction:
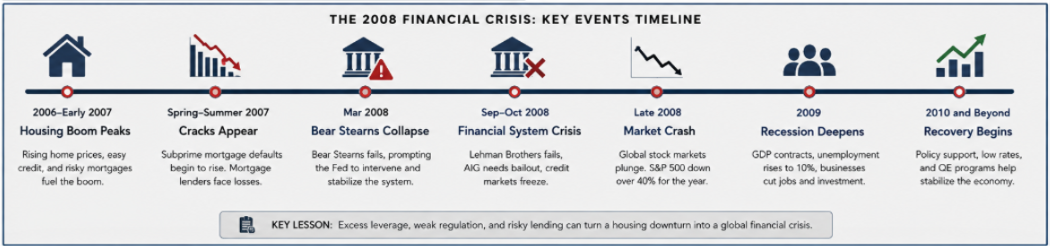
Housing boom → risky mortgages → falling home prices → mortgage defaults → financial losses → credit contraction → stock-market crash → recession → unemployment
The numbers show how quickly financial stress can move from a specific asset class into the wider economy.
For modern investors, 2008 remains a valuable case study in market history, financial risk, leverage, liquidity and economic contagion. Watching only stock prices would have missed much of the warning signal. Housing prices, credit conditions, mortgage delinquencies, leverage and liquidity were all part of the bigger picture.
Final Takeaway
The 2008 financial crisis was not simply a stock-market crash. It was a broad financial and economic shock that connected housing, banking, credit, employment and global trade.
A 57% S&P 500 decline, approximately 30% average home-price fall, unemployment reaching 10%, more than 2 million foreclosure-process entries, and a sharp global contraction illustrate the extraordinary scale of the event.
Becoin.net Premium Forecast- Becoin.net Tariff Plans
Studying these statistics provides more than historical perspective. It helps investors recognize how leverage, falling asset prices and tightening liquidity can interact—and why the next major financial crisis may begin in a completely different market.

The Clock and the Cash: My Journey into the Hidden Rhythm of Session-Based Trading
There was a time when I thought the global financial market was a single, monstrous wave that never stopped moving. I believed that if I sat in front of my monitors long enough, clicking buttons whenever a pretty pattern appeared on my charts, the market would eventually reward my sheer endurance. I was dead wrong. […]

How I Learned to Sit on My Hands During Choppy Markets
I remember the morning vividly. It was a Tuesday. The coffee on my desk was still piping hot, the charts on my screen were blinking, and I was feeling incredibly confident. I had just finished reading about how market open hours create the best trading opportunities, and I was ready to hunt for a clean […]

The Rookie Dashboard: My Raw Hunt for the Best Beginner Broker in 2026
We have all been there. It is late at night, your morning coffee is hours away, and you are staring at a screen pulsing with bright green and red lines. You have twenty dollars burning a hole in your digital wallet and a sudden, burning desire to conquer the financial markets. That was me exactly […]

Deriv vs IQ Option for Synthetic Indices: Which Platform Is Better in 2026?
Synthetic indices have become one of the most talked about trading categories among beginners and experienced traders alike. Unlike forex or crypto markets that depend on real world events, synthetic indices operate 24/7 using algorithm driven price movements. That means traders can access opportunities at any time without waiting for market openings or major news […]
Biggest Beginner Mistakes That Kill Trading Accounts
Trading looks simple from the outside. Open an account, place a few trades, and grow your balance. But reality is different. Most beginners do not lose because markets are impossible. They lose because they repeat the same avoidable mistakes. A small account can survive bad market conditions. What usually kills it is poor decision-making, emotional […]

WTI reaches $89.43 as Brent clears $95 on renewed supply risk
WTI traded near $89.43 while Brent moved above $95 as Middle East shipping risk lifted crude for a fifth session. Key levels, catalysts and invalidation.