
USD/JPY Forecast: 159.58 Retreats From the 160.00 Line
- USD/JPY trades at 159.58, down 0.28% on the day after Friday's spike through 160.00 was rejected inside four hours.
- The pair is squeezed between a Fed being repriced towards a hike and a Bank of Japan that markets see moving in September.
- The 160.00 handle is the level that decides the next move, and it doubles as the zone officials have defended before.
Fundamental Analysis: USD/JPY
Friday supplied the dollar impulse. Chair Kevin Warsh used the Jackson Hole keynote to describe inflation as the Fed's paramount concern, pointing to PCE running at 3.7% over twelve months against a 4.1% six-month pace, and announced a move away from routine forward guidance towards a more discretionary, data-dependent stance. With the funds target at 3.50%-3.75% and three July dissenters already preferring an increase, pricing for a September hike lifted sharply, and the dollar took the whole G10 with it.
The counterweight sits in Tokyo. The Bank of Japan is at 1.0% after June's increase to the highest policy rate since 1995, projects FY2026 inflation at 2.5%, and has left September open. There is also a live intervention history: joint Japanese and US action in late July pushed the yen higher, though it has since given back more than half of that move. Elevated crude prices, tied to the same Middle East disruption driving global inflation, keep worsening Japan's import bill and the terms-of-trade drag on the currency.
That combination explains why 160.00 keeps acting as a wall rather than a level. Rate differentials pull the pair higher; the prospect of a BoJ hike and the memory of official action cap it. Until one of those forces resolves, in the 17 September BoJ meeting or the Fed decision that follows, the pair should keep trading a narrow band with sharp, short-lived excursions on data.
Technical Analysis: USD/JPY
The 4-hour chart traces the recovery from 156.60 on 5 August through a grind to 159.90 by mid-month, a flush to 157.90 on 19 August, and then Friday's post-Jackson Hole spike that briefly cleared 160.00 before closing back beneath it. The reversal left the slowest moving average at 159.85 sitting directly overhead, with faster averages bunched at 159.56, 159.42 and 159.34 immediately below the 159.58 market.
Resistance is 159.85, then the 160.00 handle and Friday's 160.05 extreme above it. Support comes in at the 159.34-159.42 average cluster, then 158.50, with the 157.90 swing low the last defence of the August advance. A sustained four-hour close above 160.05 invalidates the range read and confirms the breakout Friday failed to deliver.

EUR/USD holds 1.1414 before the ECB decision: three scenarios
EUR/USD traded near 1.1414 before the ECB’s July decision. Here is what a hold, hawkish hold or surprise hike could mean for 1.1350 and 1.1480.

Binomo Demo vs Real Account: What Changes After You Deposit (KYC, Payout, Support, Limits)
I spent far too long thinking my Binomo demo results meant I was “ready.” On demo, everything felt clean. My entries looked sharp. My timing looked better than it probably was. I could reset virtual balance, test ideas, and convince myself I had control. Then I made my first real deposit, and that’s when I […]

Binomo Minimum Deposit vs Minimum Withdrawal: The Real Trap Beginners Miss
I almost fell for the simplest trap on Binomo. Not a bad entry.Not a losing strategy.Not even a bad signal. It was the gap between the Binomo minimum deposit vs minimum withdrawal that quietly changes how beginners behave. When I first opened a real account, the low entry point looked harmless. That’s exactly why it […]

Capital Core Verification Process Explained: KYC, Restrictions, and Withdrawal Delays
I learned something the hard way with offshore-style brokers: the smoothest part is usually opening the account, funding it, and placing the first few trades. The real test starts when you try to move money back out. That’s exactly why I wanted to document the Capital Core verification process from a trader’s perspective, not from […]
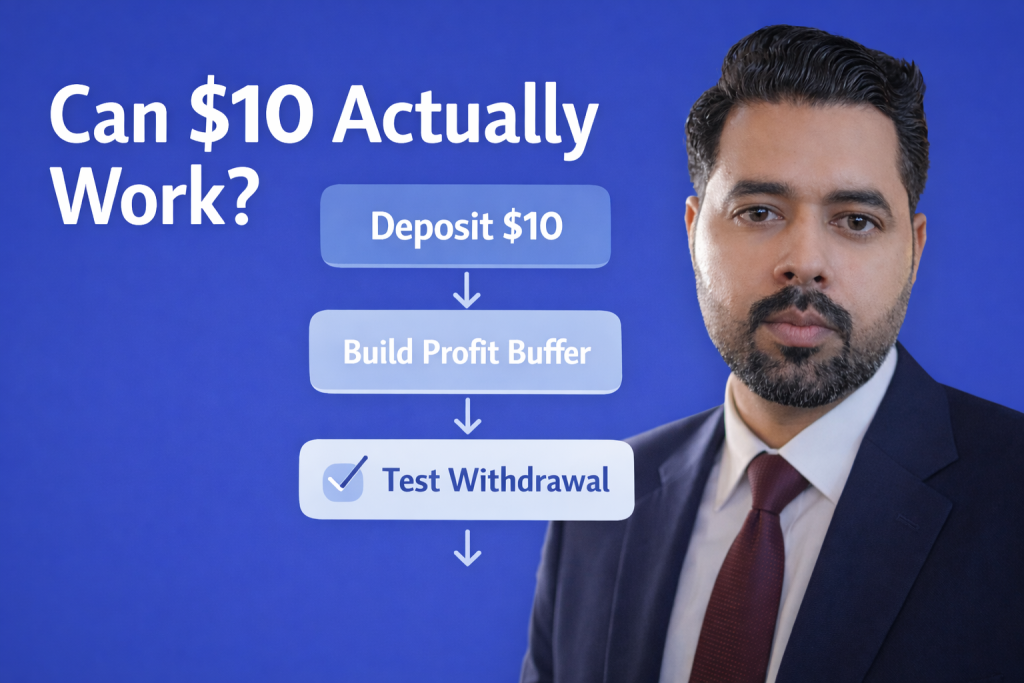
Capital Core Minimum Deposit Strategy: Can You Grow a Small $10 Account?
There’s something dangerously attractive about a broker that lets you start with just $10. It feels harmless. Low risk. Easy to test. Almost too easy. That’s exactly why I wanted to test the Capital Core minimum deposit strategy for myself. Not because I believed a $10 account could become life-changing money. Not because I wanted […]
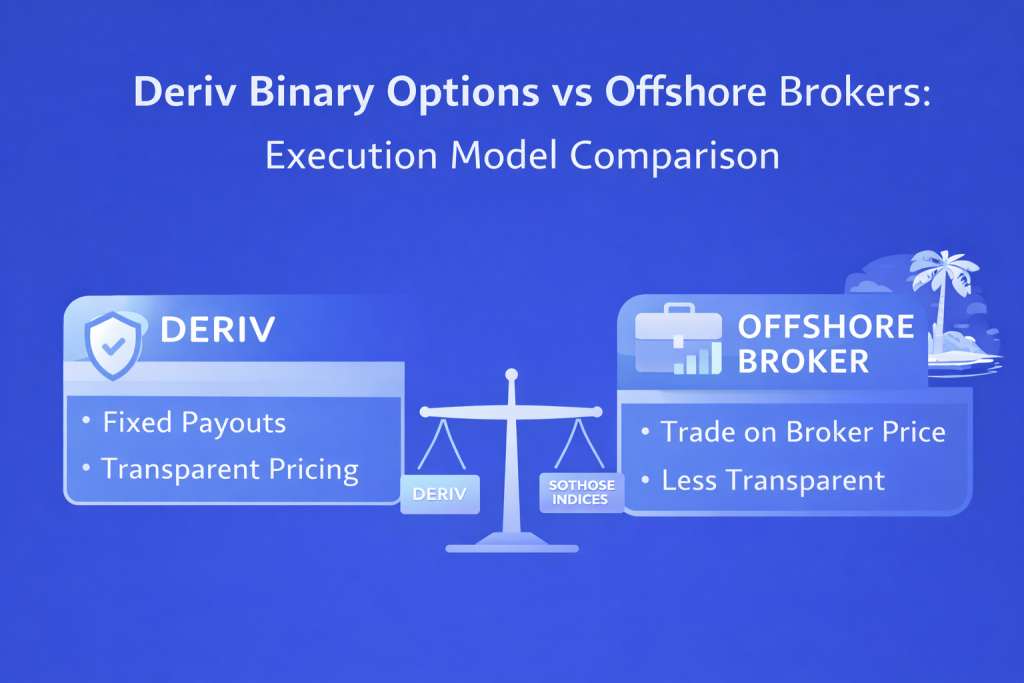
Deriv Day Trading vs Offshore Brokers: Execution Model Comparison
I did not start my trading journey thinking about execution models. Like most beginners, I started with charts, indicators, and the belief that if I could just find the right entry signal, profits would follow. My early trading notebook was full of screenshots of RSI signals, candlestick patterns, and support levels. What it did not […]