US 30-year yield holds near 5.162% as duration pressure persists
# US 30-year yield holds near 5.162% as duration pressure persists
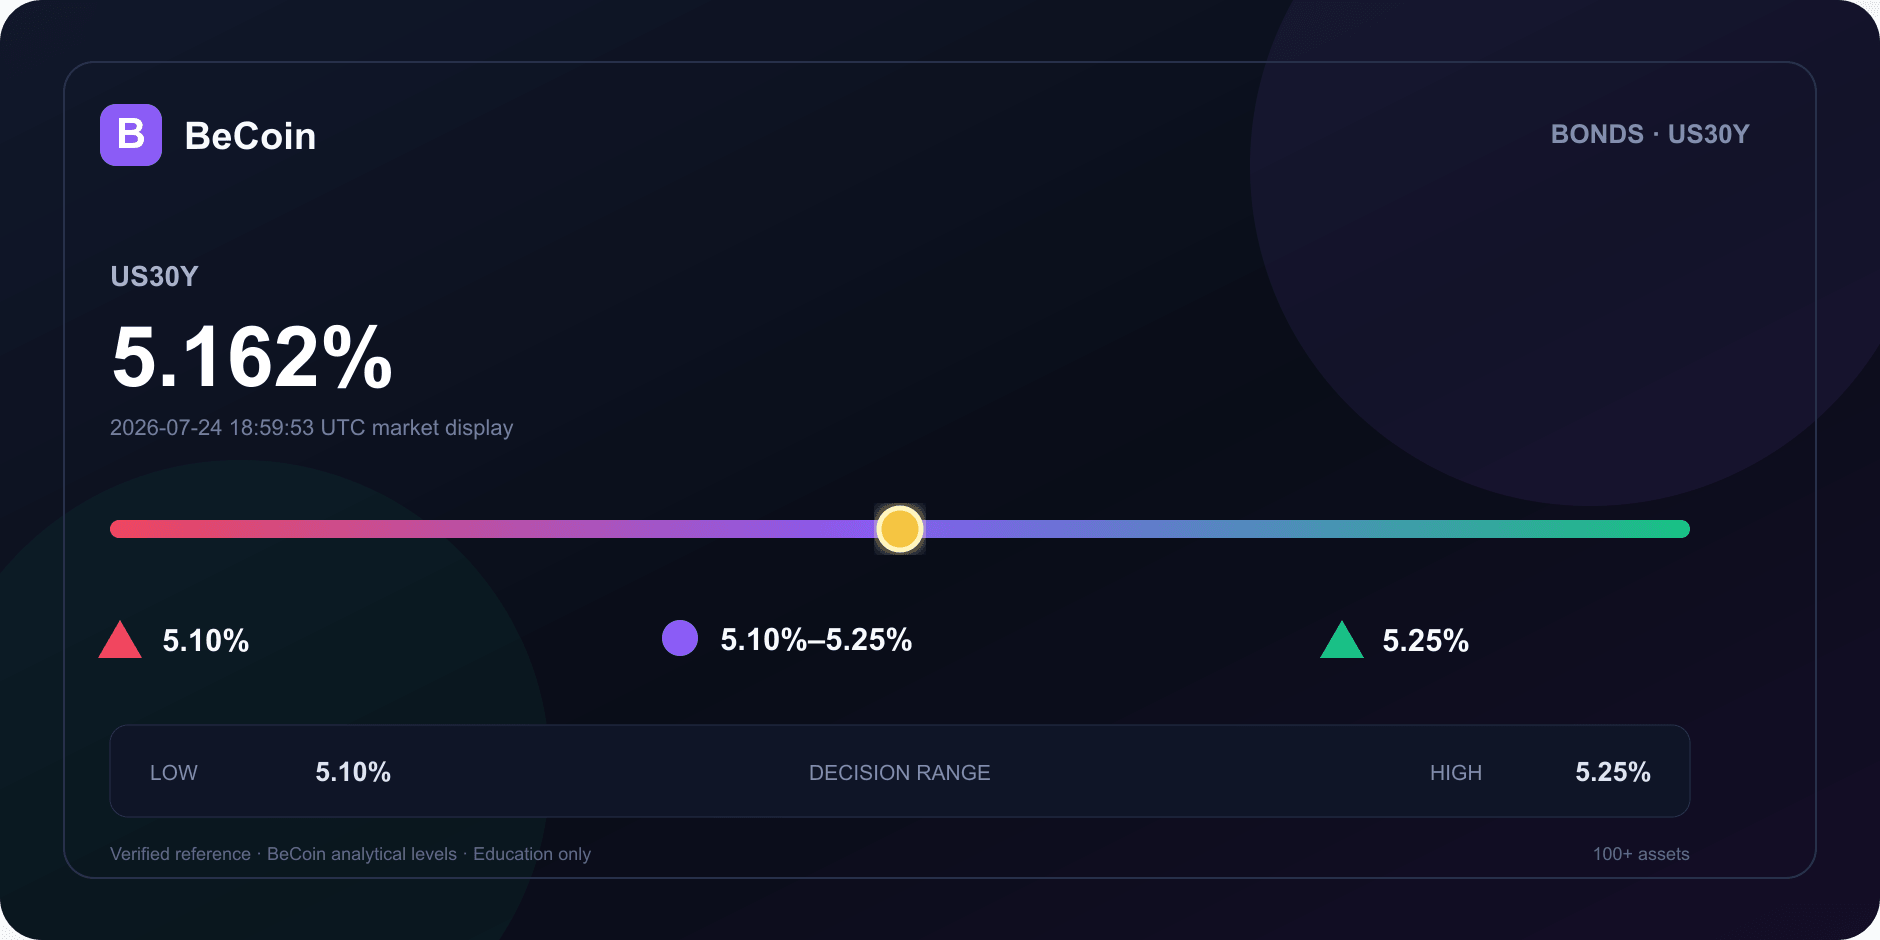
The US 30-year Treasury yield is currently at 5.162%. This level reflects ongoing duration pressure in the market, as evidenced by a recent decline of 0.17% in the Cboe index display. The market debate centers around the implications of this yield in relation to the Federal Reserve's policies and the broader economic landscape.
Why it matters
The US 30-year Treasury yield is a critical indicator for investors, as it influences borrowing costs and reflects investor sentiment regarding long-term economic growth. The current yield of 5.162% is closely aligned with the Federal Reserve's July 23 constant-maturity value of 5.17%. This proximity highlights the importance of understanding the yield's movement in the context of Federal Reserve policy and its potential impact on risk assets. BeCoin's analysis provides a two-sided duration-risk map, offering insights into the yield's implications for investors.
Technical and market context
The yield has been fluctuating within a day range of 5.10% to 5.25%. The market's current focus is on the interplay between the yield and the Federal Reserve's monetary policy. As noted in the Federal Reserve H.15 table, the 30-year constant maturity yield was recorded at 5.17% on July 23. This data point serves as a benchmark for evaluating the current market display. The sparse ideas on TradingView regarding the US 30-year yield suggest a cautious sentiment among contributors, with discussions framing the yield as a potential headwind for equities.
BeCoin forecast read
The forecast for the US 30-year Treasury yield presents both bullish and bearish scenarios. In a bullish scenario, if the yield rises to 5.25%, it may indicate increased investor confidence and a shift in market sentiment towards risk assets. Conversely, a bearish scenario could see the yield drop to 5.10%, reflecting heightened concerns over economic growth and potential shifts in Federal Reserve policy. The market may continue to debate these outcomes as it navigates the complexities of current economic indicators and Federal Reserve actions.
Methodology and sources
This analysis is based on data from various sources, including Google Finance and the Federal Reserve H.15. The factual research cutoff was July 26, 2026, and closed-market references retain their July 24 source time. The insights provided reflect the current market conditions and the ongoing discussions surrounding the US 30-year Treasury yield.
Related market analysis · Related BeCoin tool
| Evidence field | Value |
|---|---|
| Verified reference | 5.162% |
| Source time | 2026-07-24 18:59:53 UTC market display |
| Base range | 5.10%–5.25% |
| Bull confirmation | 5.25% |
| Bear confirmation | 5.10% |
This content is for education only and is not financial advice.
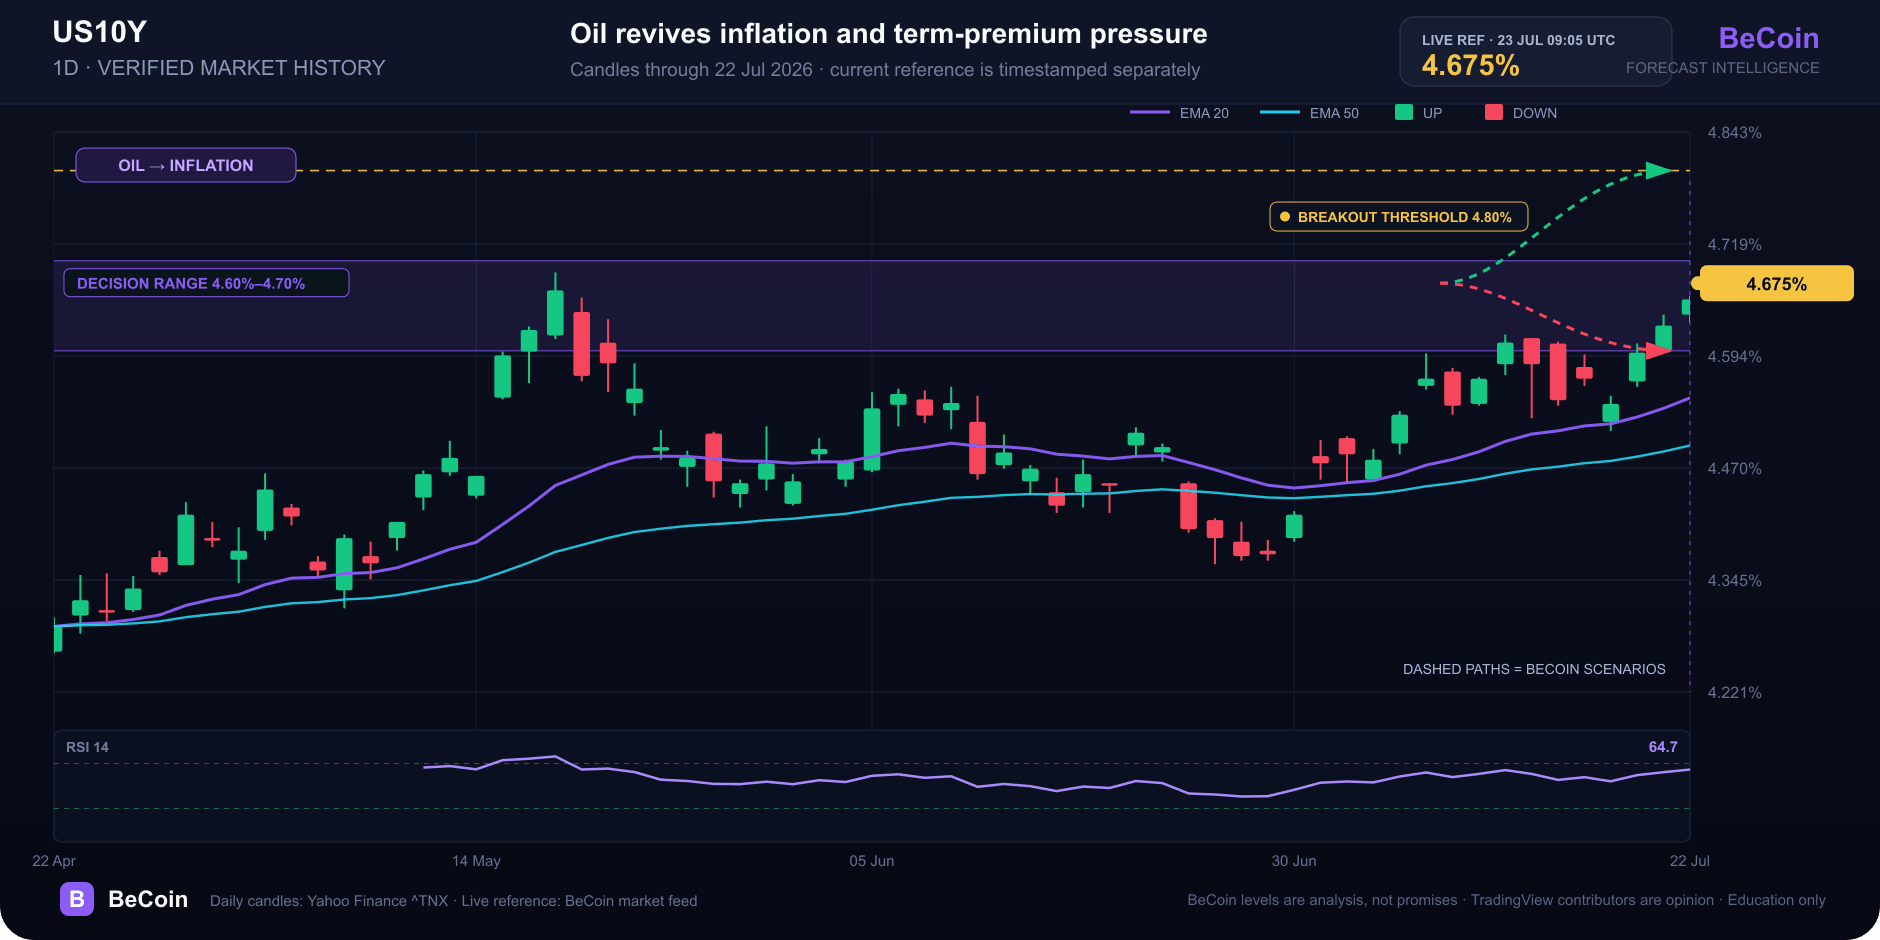
US 10-year yield reaches 4.675% as oil revives inflation pressure
The US 10-year yield reached 4.675% as oil prices rose and markets awaited labor data. What 4.70%, 4.80% and a reversal below 4.60% would mean.
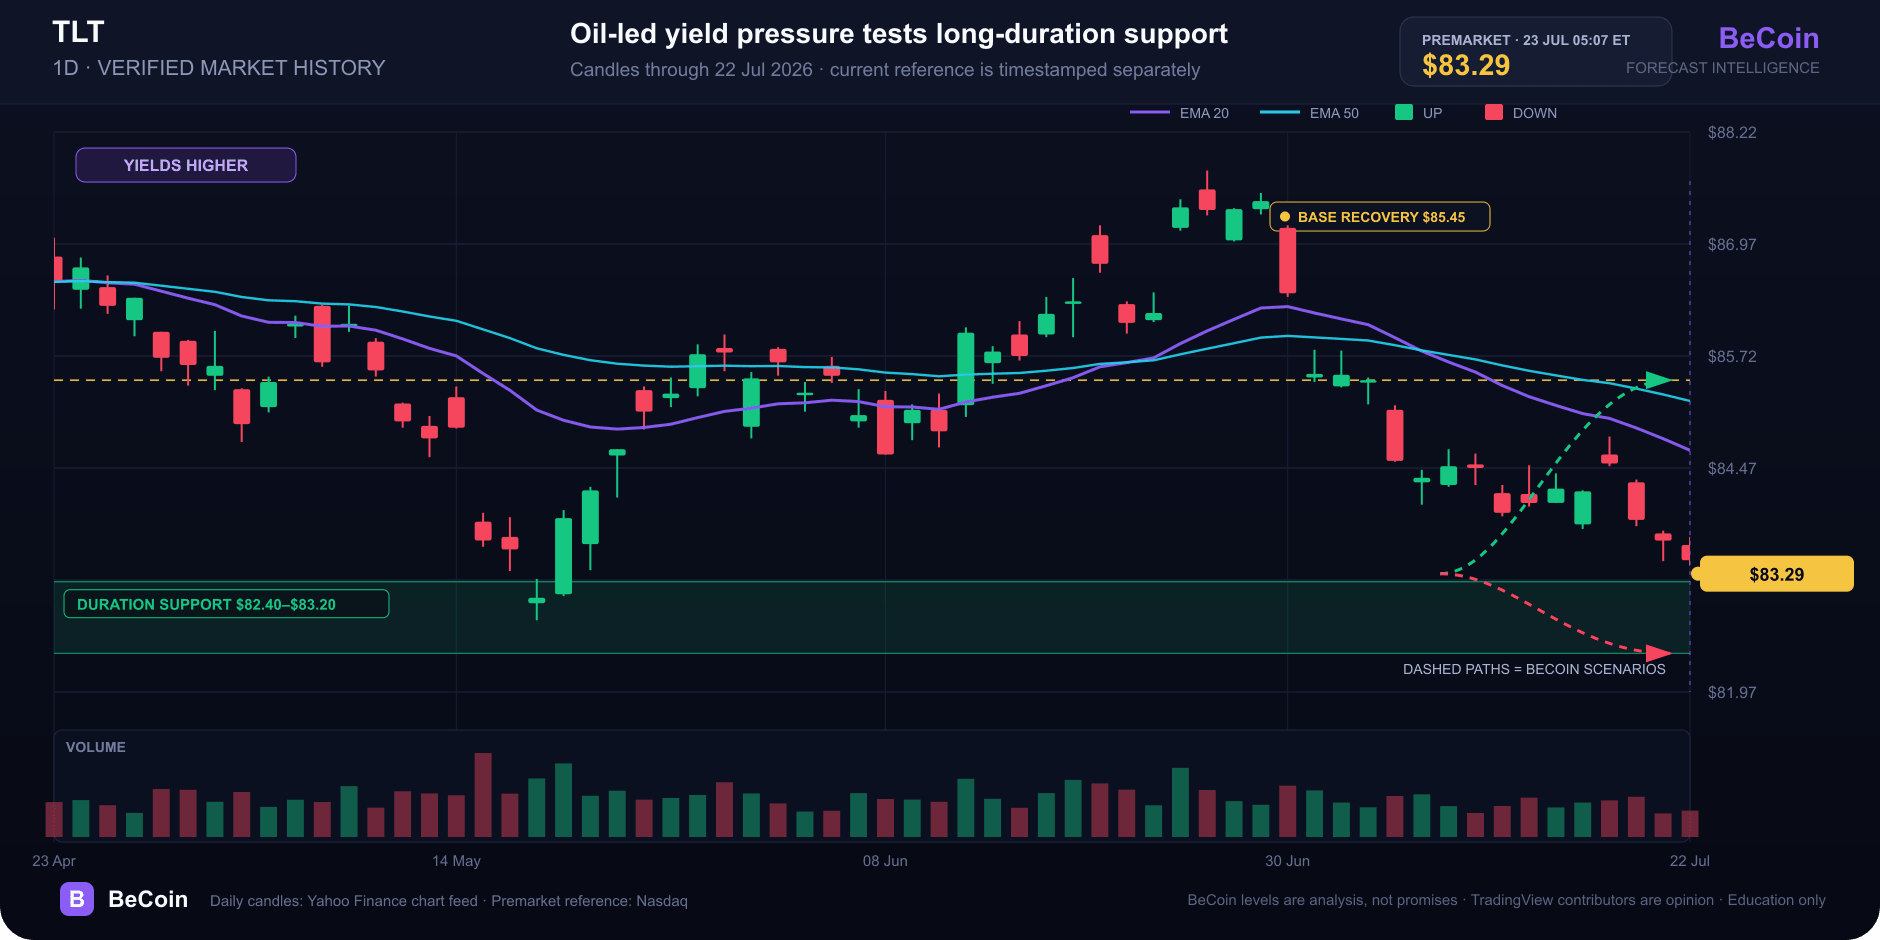
TLT slips to $83.29 as oil pushes long-duration risk back into focus
TLT traded near $83.29 premarket as oil and Treasury yields rose. Here is why duration matters and which levels separate a base from a breakdown.

Bitcoin slips to $65,741 as oil and yields test the breakout
Bitcoin is near $65,741 as rising oil and Treasury yields test the $65.7K breakout floor. Here are the levels that confirm or invalidate the move.

The Clock and the Cash: My Journey into the Hidden Rhythm of Session-Based Trading
There was a time when I thought the global financial market was a single, monstrous wave that never stopped moving. I believed that if I sat in front of my monitors long enough, clicking buttons whenever a pretty pattern appeared on my charts, the market would eventually reward my sheer endurance. I was dead wrong. […]

EUR/USD holds 1.1414 before the ECB decision: three scenarios
EUR/USD traded near 1.1414 before the ECB’s July decision. Here is what a hold, hawkish hold or surprise hike could mean for 1.1350 and 1.1480.

WTI reaches $89.43 as Brent clears $95 on renewed supply risk
WTI traded near $89.43 while Brent moved above $95 as Middle East shipping risk lifted crude for a fifth session. Key levels, catalysts and invalidation.