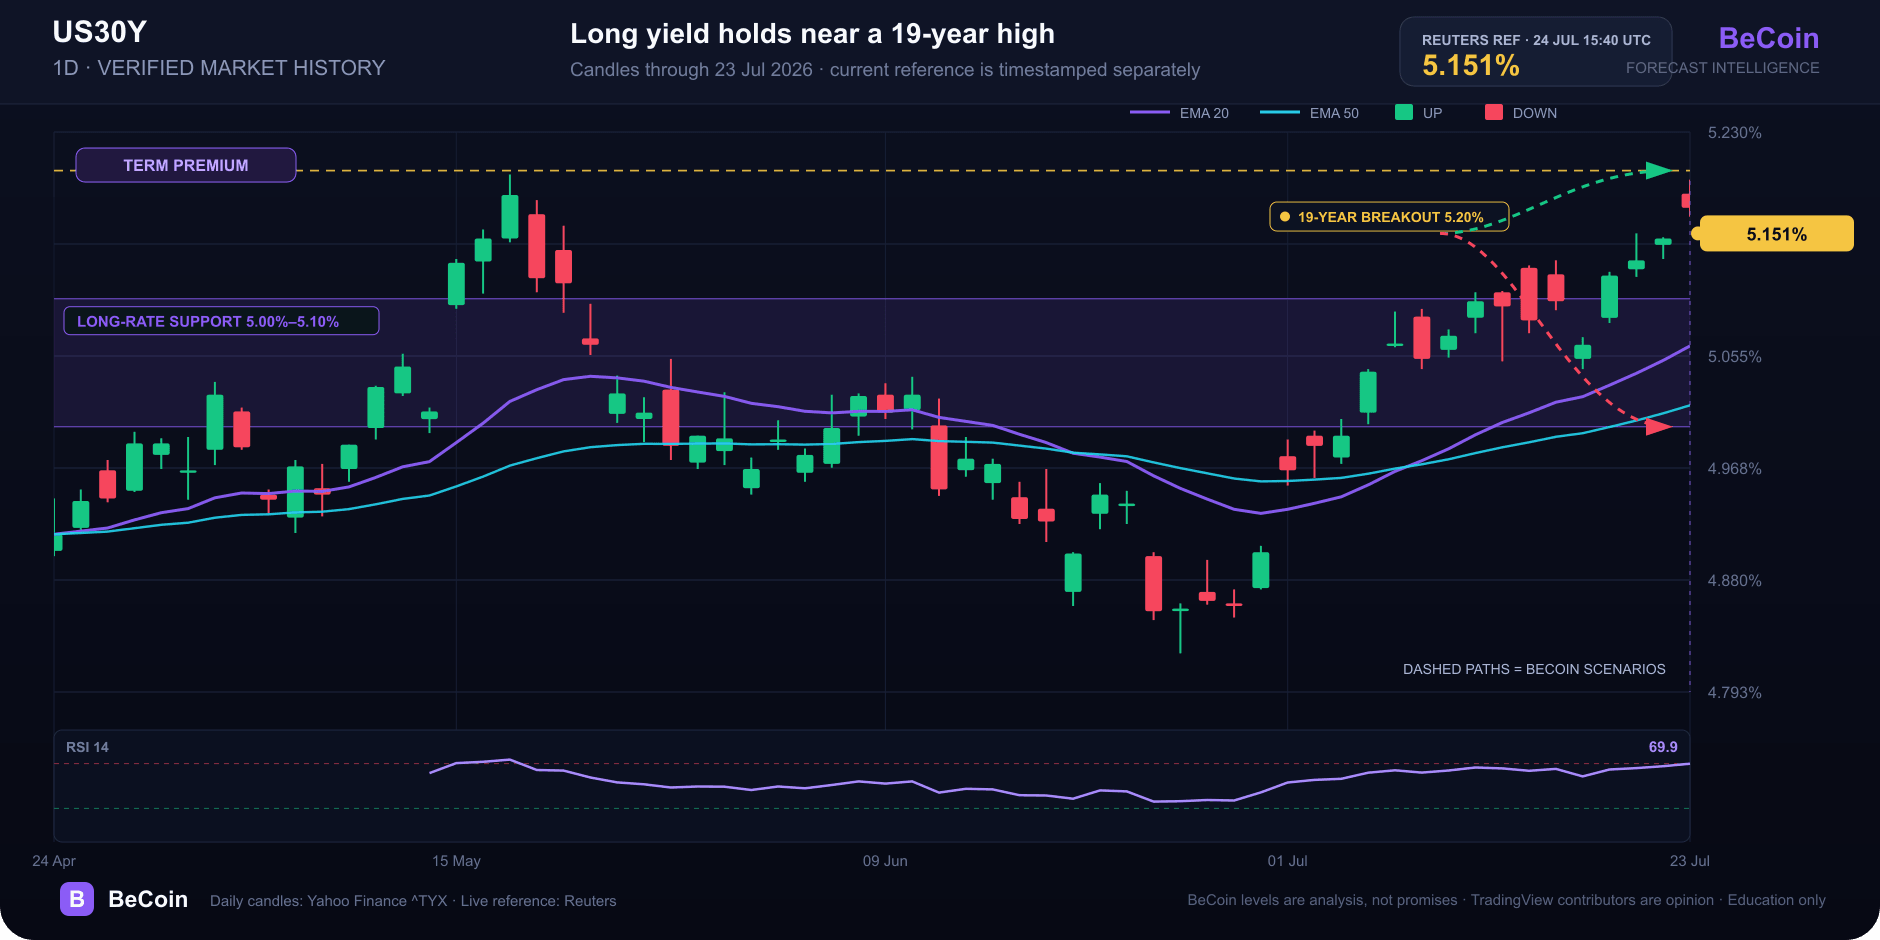
US 30-year yield holds at 5.151% near a 19-year high
The U.S. 30-year Treasury yield traded at 5.151% on July 24, close to an intraday peak of 5.201%, which Reuters described as a 19-year high. The direct answer is that the long bond remains above the key 5% threshold even after oil retreated from its $102 high.
Why it matters
The 30-year yield is a long-duration benchmark for mortgages, infrastructure finance, pensions and equity valuation. Oil-driven inflation risk, new tariffs and uncertainty about Federal Reserve policy can all raise the term premium investors demand for locking money away for three decades.
Reuters reported a one-in-three chance of a Fed hike as soon as next week, compared with much lower odds a week earlier. That repricing matters even if the Fed does not move: long yields reflect expected policy plus inflation, supply and term premium.
Google’s leading results offered quote pages and a current Treasury market article. BeCoin adds the cross-asset mechanism and separates the official daily Treasury curve—which had not yet posted a July 24 closing observation at the research cutoff—from Reuters’ intraday market level.
Technical and market context
The first pivot is 5.10%, with 5.00% as the larger psychological support. A sustained move above 5.20% would confirm a fresh long-yield breakout. A reversal below 5.00% would ease pressure on long-duration assets.
TradingView contributors are strongly focused on 5%. A July 16 idea called 5% the threshold for equity pressure, while a July 9 opinion projected much higher yields from a multi-year pattern. Those are analytical views, not Treasury or Federal Reserve forecasts.
BeCoin forecast read
BeCoin’s base case is a 5.00%–5.20% range with event-driven volatility. The higher-yield case requires 5.20% to become support. The lower-yield case needs softer inflation expectations or de-escalation and is confirmed only below 5.00%.
Track the US 30-year forecast and compare market reactions on the Forecast Hub.
Methodology and sources
Intraday yield and 19-year comparison: Reuters global-markets report dated July 24 and updated before the 15:45 UTC cutoff. Official historical reference: U.S. Treasury daily yield-curve page and Federal Reserve FRED DGS30 series. Google results were reviewed July 24; no People Also Ask module appeared for the exact query. TradingView US30Y ideas are opinion only.
This content is for education only and is not financial advice.
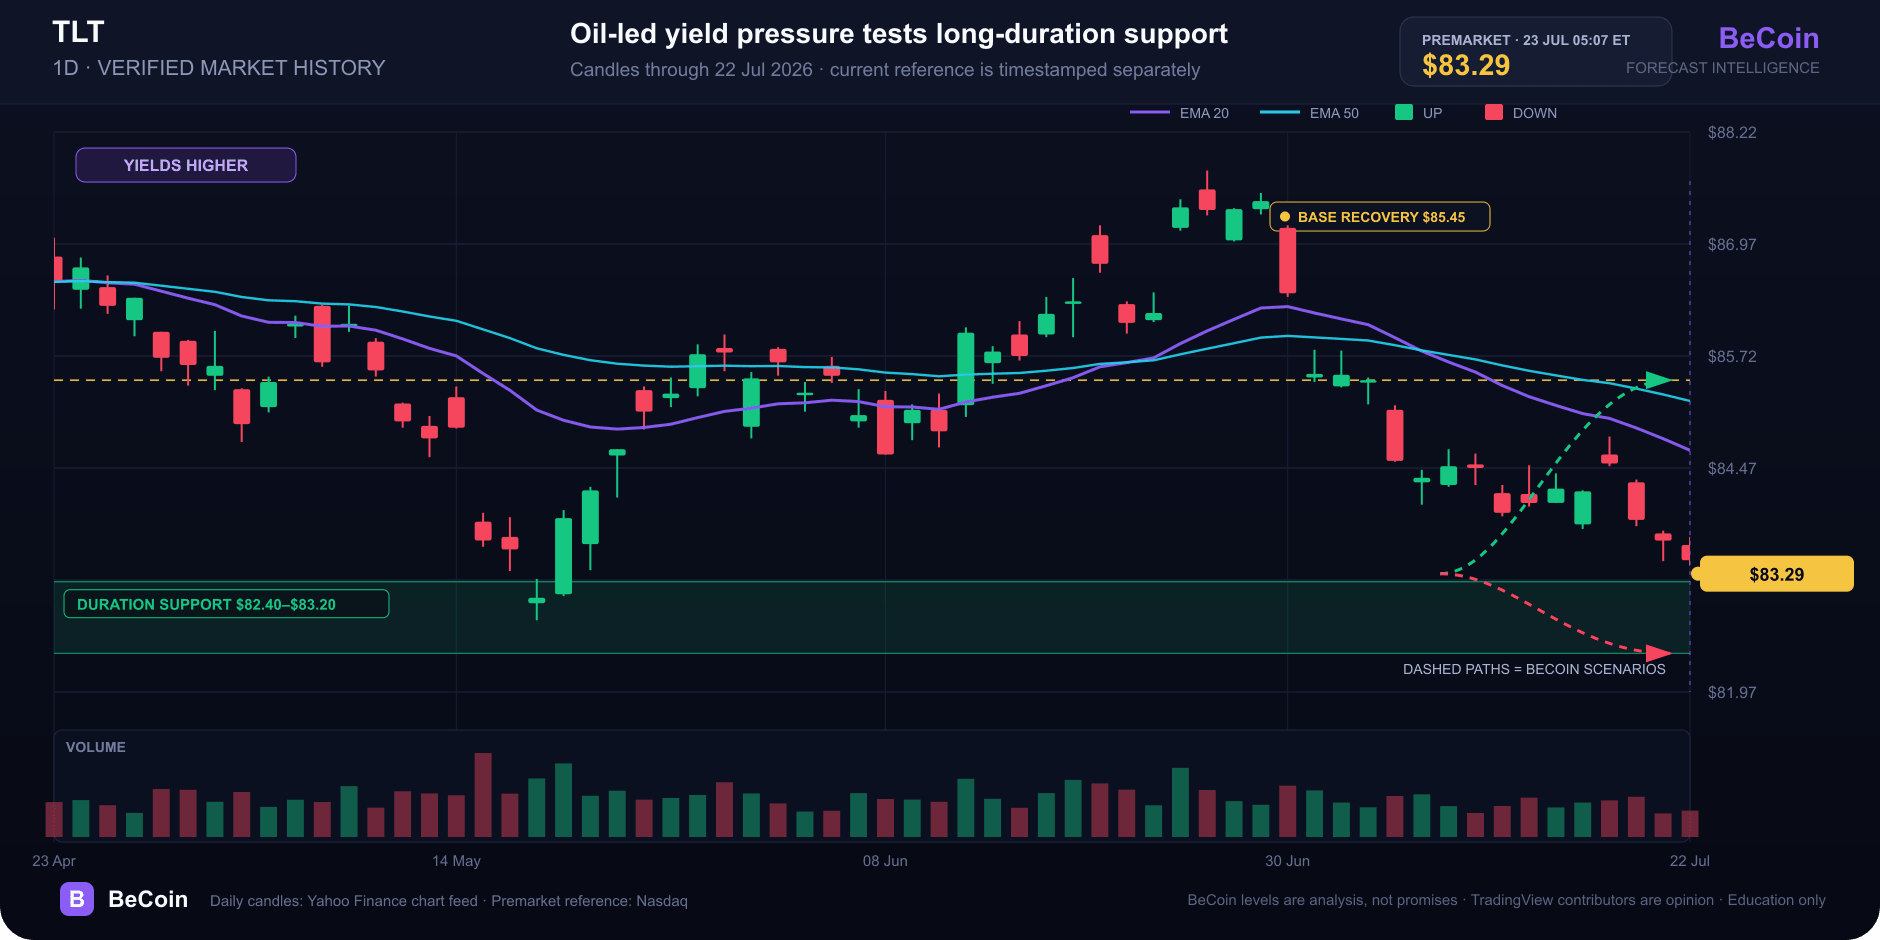
TLT slips to $83.29 as oil pushes long-duration risk back into focus
TLT traded near $83.29 premarket as oil and Treasury yields rose. Here is why duration matters and which levels separate a base from a breakdown.

Bitcoin slips to $65,741 as oil and yields test the breakout
Bitcoin is near $65,741 as rising oil and Treasury yields test the $65.7K breakout floor. Here are the levels that confirm or invalidate the move.
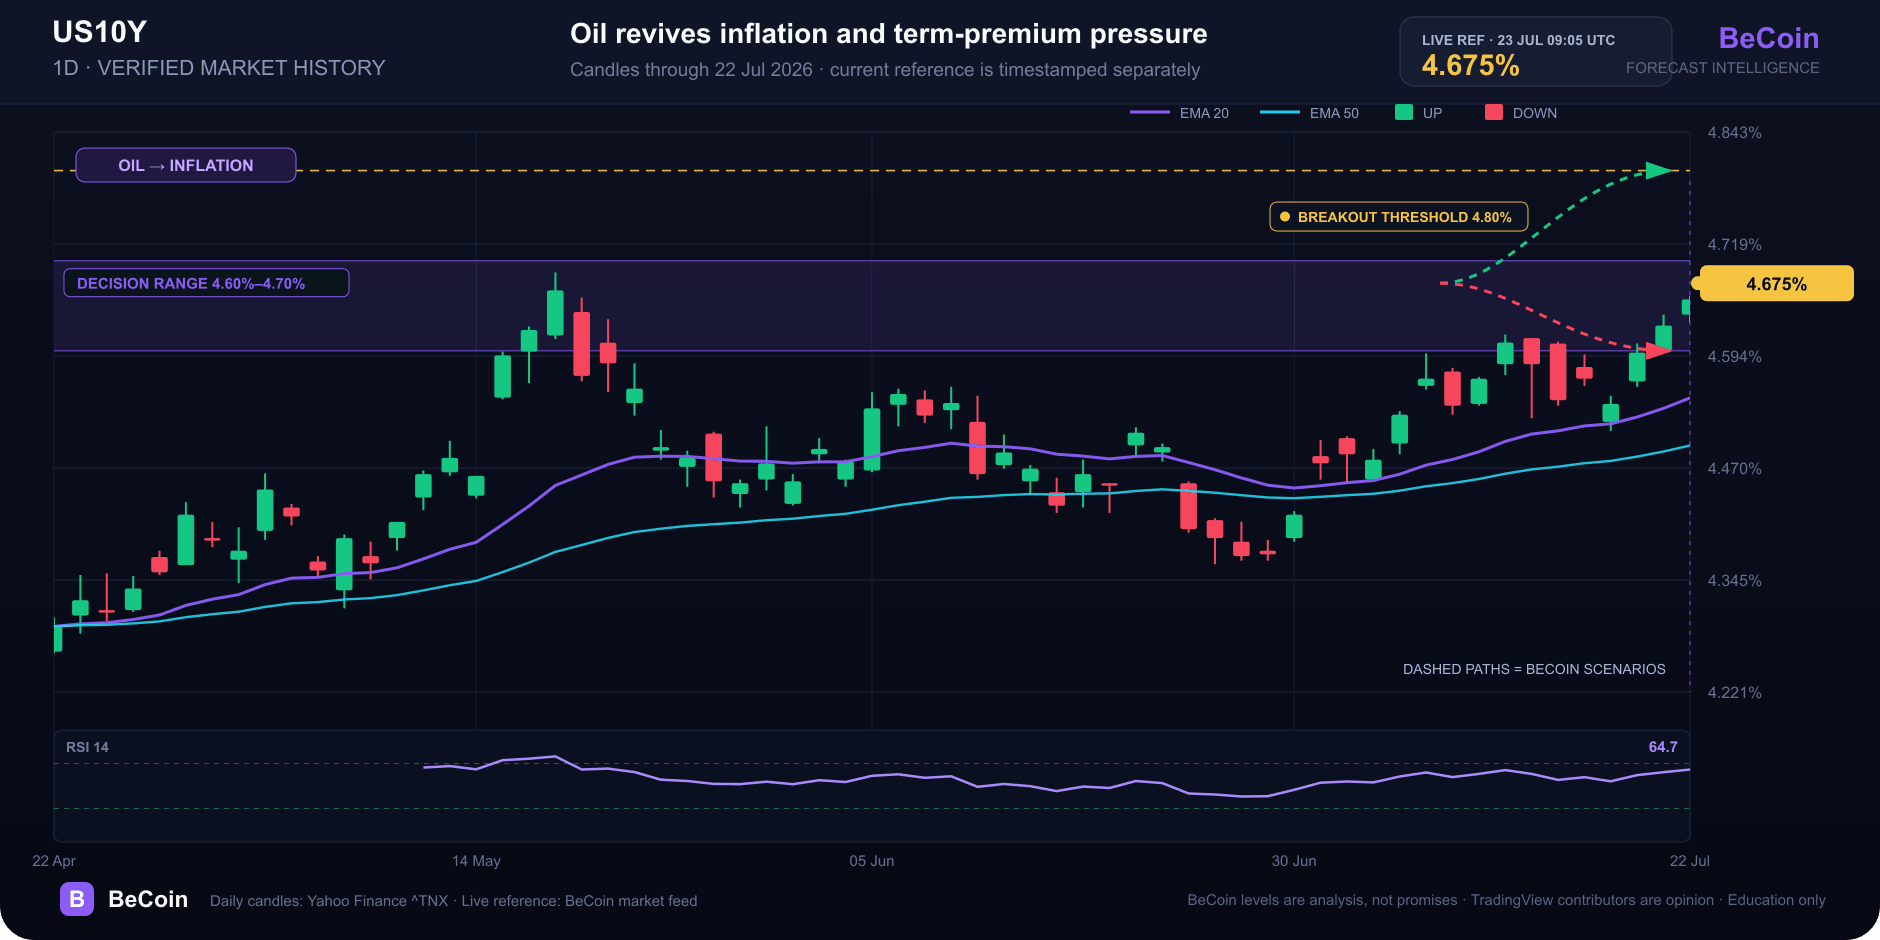
US 10-year yield reaches 4.675% as oil revives inflation pressure
The US 10-year yield reached 4.675% as oil prices rose and markets awaited labor data. What 4.70%, 4.80% and a reversal below 4.60% would mean.

EUR/USD holds 1.1414 before the ECB decision: three scenarios
EUR/USD traded near 1.1414 before the ECB’s July decision. Here is what a hold, hawkish hold or surprise hike could mean for 1.1350 and 1.1480.

Alphabet falls to $329.71 premarket as AI spending eclipses cloud growth
Alphabet traded near $329.71 premarket after strong Q2 revenue and cloud growth collided with a much larger AI spending plan. What investors need to watch.
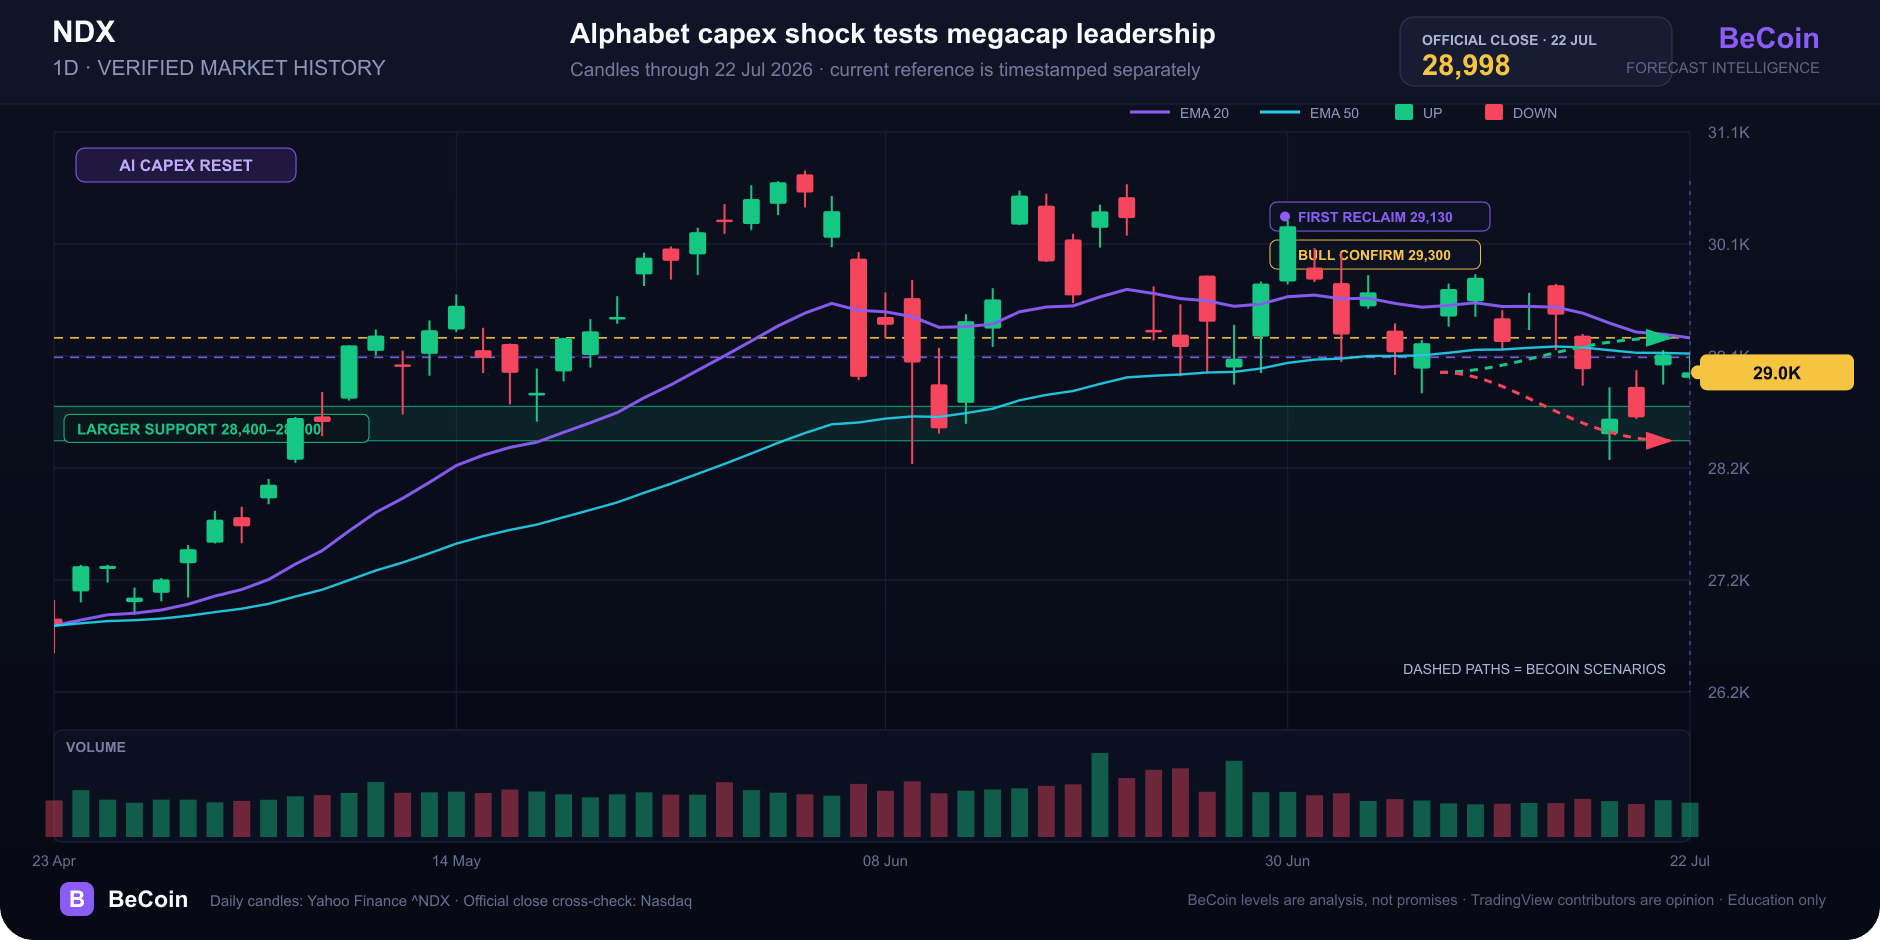
Nasdaq 100 closes at 28,998 as Alphabet spending resets AI risk
The Nasdaq 100 closed at 28,998.10 and futures slipped after Alphabet raised AI spending expectations. The 28,400–29,300 decision zone explained.