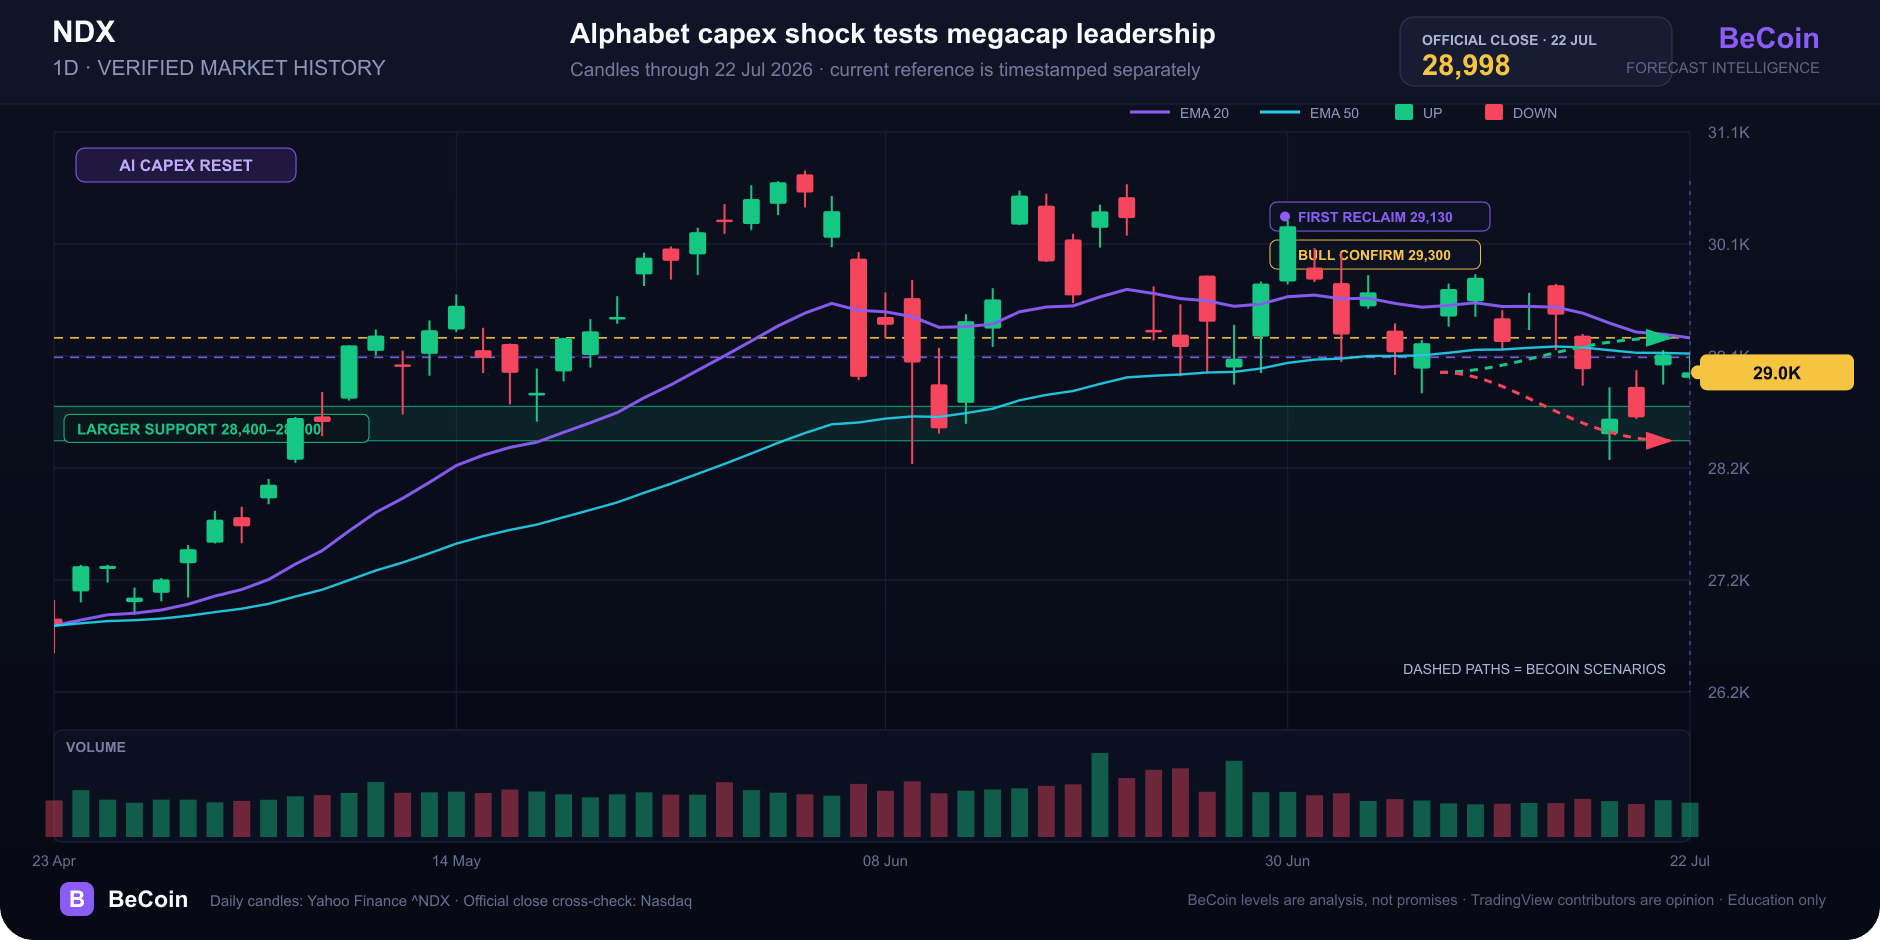
Nasdaq 100 closes at 28,998 as Alphabet spending resets AI risk
The Nasdaq 100 closed July 22 at 28,998.10, down 157.08 points or 0.54% in Nasdaq data, and futures were indicated roughly 0.6% lower on July 23 as Alphabet’s larger AI spending plan unsettled investors.
Why it matters
The index is testing whether investors still reward AI revenue growth when the required capital rises faster. Alphabet reported 82% Google Cloud growth, yet its spending outlook pulled the stock lower. That tension can move the whole Nasdaq 100 because its largest members share the same infrastructure and return-on-investment debate.
Top coverage focuses on the earnings headline or the futures decline. BeCoin adds an index-level decision map that distinguishes one-company shock from a broader change in trend.
Technical and market context
The immediate pivot is 29,000. A recovery through 29,130–29,300 would show that index buyers are absorbing the Alphabet reaction. The larger support zone is 28,400–28,700, the area emphasized by current TradingView contributors after the recent pullback. A daily close below 28,400 would turn a contained earnings reset into a deeper correction signal.
TradingView opinions are divided between a rebound from support toward 29,300 and a deeper correction if the monthly demand zone fails. These are independent opinions, not BeCoin facts.
BeCoin forecast read
BeCoin’s base case is consolidation between 28,700 and 29,300 while more megacap earnings arrive. The bull case requires breadth beyond a handful of AI leaders and a close above 29,300. The bear case strengthens below 28,400, especially if oil and yields continue to rise together.
Track Nasdaq forecasts and review multi-asset leadership on the Forecast Hub.
Methodology and sources
Index close: Nasdaq official quote, dated 2026-07-22. Futures and driver: CNBC/market coverage July 23. Alphabet figures: company Q2 release. TradingView levels are opinion context.
This content is for education only and is not financial advice.

Alphabet falls to $329.71 premarket as AI spending eclipses cloud growth
Alphabet traded near $329.71 premarket after strong Q2 revenue and cloud growth collided with a much larger AI spending plan. What investors need to watch.

Simple Daily Trading Routine for Consistency
Most traders do not fail because of strategy alone. They fail because they are random. They trade when emotional, skip planning, increase risk after losses, and ignore review sessions. Consistency in trading usually comes from routine more than prediction. A simple daily trading routine helps you stay disciplined, reduce emotional mistakes, and improve decision making […]

Deriv vs Binomo Deposit Methods: My 2026 Real Money Comparison Guide
I sat in the corner of a crowded coffee shop, my eyes fixed on my phone screen. After months of testing strategies on a demo account, I had finally saved up a small pocket of risk capital. I felt ready to trade live. A high-probability setup was forming on my charts, and my heart rate […]

Deriv vs IQ Option for Beginners in 2026: Which Platform Is Better to Start With?
Choosing your first trading platform can decide whether you stay consistent or quit after blowing your first account. Most beginners do not fail because trading is impossible. They fail because they start on platforms that confuse them, encourage emotional trading, or make risk management difficult. Two names that often appear in beginner discussions are Deriv […]
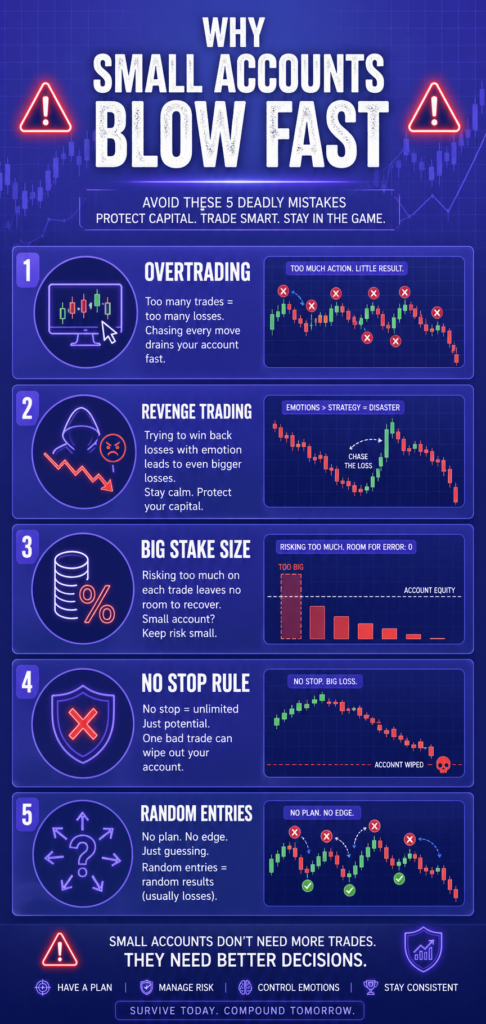
Risk Management for Small Accounts ($10–$50)
Starting with a small trading account can feel frustrating. You want fast growth, but one bad decision can wipe out weeks of progress. That is why risk management matters more for a $10 account than for a $1,000 account. Many beginners focus only on strategy. They search for the best indicators, signals, or entry methods. […]

Best Binary Options Brokers for Beginners (2026) — Fast Decision Guide
If you’re searching for the best binary options brokers for beginners, the real problem isn’t lack of options, it’s choosing the wrong platform and learning that mistake after you deposit. Most beginners don’t fail because of strategy. They fail because they start on a broker that has unclear execution, weak withdrawal behavior, or confusing conditions. […]