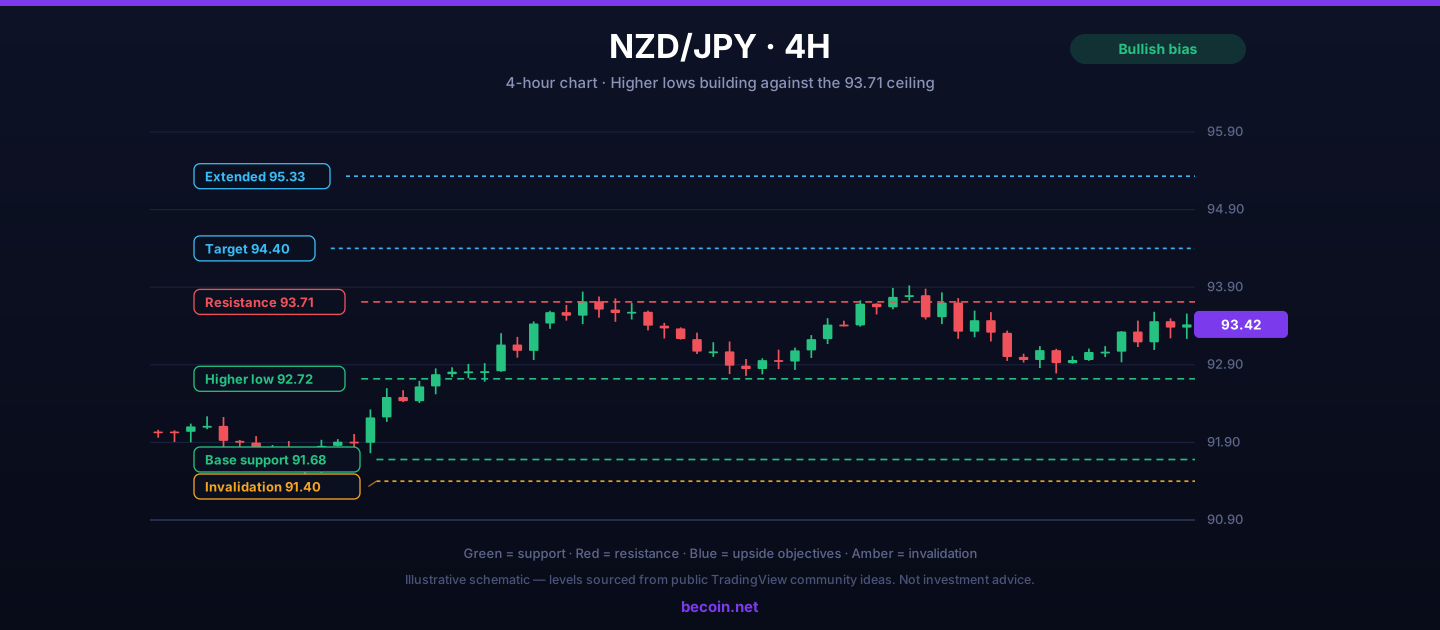
NZD/JPY Forecast: Buyers Defend 92.00 and Build a Case for 94.40
A quiet uptrend nobody is talking about
NZD/JPY does not get the attention that the majors do, and that is part of what makes it interesting right now. While traders argue about the dollar, this cross has been quietly carving out a sequence of higher lows off the 91.68 area and pressing repeatedly against the same band of supply near 93.71. Each attempt has failed, but each failure has been shallower than the one before it. That pattern usually means accumulation rather than distribution.
The fundamental backdrop is doing some of the work. The Reserve Bank of New Zealand has slowed its easing cycle while the Bank of Japan continues to move at a glacial pace, and the resulting rate gap still favours the kiwi. Add stable global risk appetite and this becomes one of the more mechanically clean carry structures on the board.
What the NZD/JPY forecast rests on
Four reference points carry the idea:
- 91.68 is the base. It is the low that started the current sequence and the level that keeps the higher-low structure honest.
- 92.72 is the most recent higher low and the shelf that buyers have defended intraday. It is the pullback level worth watching for entries.
- 93.71 is the ceiling. Three separate attempts have stalled in the 93.54 to 93.73 band, which makes a clean daily close above it meaningful rather than cosmetic.
- 94.40 is the first real objective once that ceiling breaks, with 95.33 the extension if momentum carries.
How the bullish path most likely unfolds
The high-probability version is not a breakout chase. It is a pullback entry. Price rotating back into 92.91 to 92.97, holding, and then turning higher gives a defined-risk long with invalidation just beneath 92.50. That structure risks roughly 45 pips against a first objective near 93.71 and a second near 94.40.
The lower-probability but higher-payoff version is the breakout itself. If a daily candle closes above 93.75 with expanding range, the measured move from the base projects into the mid 94s. In that scenario the retest of 93.71 from above is the entry, not the break.
Why patience matters here
Yen crosses are notorious for false breaks driven by thin liquidity during the Tokyo session. A wick above 93.71 that closes back inside the range is not a signal; it is a liquidity sweep. Waiting for the close removes most of those traps at the cost of a few pips of entry quality.
What kills the idea
A daily close beneath 91.40 breaks the higher-low sequence outright and turns this from a constructive base into a failed one. That would most likely coincide with a broad risk-off move, since the yen strengthens fastest when equity volatility spikes. Anyone holding longs into a major risk event without a stop beneath that level is taking on tail risk they have not priced.
The softer failure mode is a grind. If price oscillates between 92.70 and 93.60 for another two weeks, the carry still pays but the capital is dead. Time stops are underrated in ranges like this one.
The events that will decide it
New Zealand quarterly employment and inflation data move the kiwi leg. Bank of Japan meetings and any intervention rhetoric from the Ministry of Finance move the yen leg, usually more violently. Global equity direction matters as a third input, because it drives the risk premium in every yen cross simultaneously.
Traders who prefer to have those catalysts mapped against the technical levels ahead of time can track updated currency projections through the Becoin.net Premium Forecast, and review the available access tiers on the Becoin.net Tariff Plans page.
Position management
Carry trades reward patience but punish oversizing, because the drawdowns arrive fast and correlated. A sensible structure is a half position on the 92.91 pullback, the second half on a confirmed close above 93.75, and a trailing stop beneath each successive higher low rather than a fixed target exit.
Take partial profit into 94.40 regardless of conviction. The zone has acted as overlap resistance before, and giving back an open profit because the extension target looked achievable is one of the most common ways good ideas turn into flat months.
The bottom line
NZD/JPY is a constructive base with a well-defined ceiling. Above 93.75 it becomes a trend; beneath 91.40 it becomes a failed base. Between those two numbers it is a range worth trading from the edges rather than the middle.
This analysis is educational and does not constitute investment advice. Trading foreign exchange carries substantial risk of loss.

Trading Currency Strength Instead of Single Pairs
It was a Tuesday afternoon when I realized I was fighting a losing battle against a ghost. My screen was a chaotic web of indicators. I had the EUR/USD chart open, a moving average crossing over here, a relative strength index flashing oversold there, and a price action setup that looked textbook perfect. I clicked […]

EUR/USD holds 1.1414 before the ECB decision: three scenarios
EUR/USD traded near 1.1414 before the ECB’s July decision. Here is what a hold, hawkish hold or surprise hike could mean for 1.1350 and 1.1480.

WTI reaches $89.43 as Brent clears $95 on renewed supply risk
WTI traded near $89.43 while Brent moved above $95 as Middle East shipping risk lifted crude for a fifth session. Key levels, catalysts and invalidation.

Bitcoin slips to $65,741 as oil and yields test the breakout
Bitcoin is near $65,741 as rising oil and Treasury yields test the $65.7K breakout floor. Here are the levels that confirm or invalidate the move.

How Liquidity Affects Day Trading Results
When I first started trading day trading, I believed success was all about finding the perfect indicator. I spent weeks testing moving averages, RSI settings, support and resistance levels, and dozens of YouTube strategies that promised easy wins. Some worked for a few trades, but most failed. What confused me was that the same setup […]

How Understanding Market Structure Saved My Day Trading
I remember the exact moment my trading account hit zero for the third time in a single month. It was a rainy Tuesday evening, and I was staring at a 1-minute chart on my laptop screen. The price had been moving up aggressively. It looked like a flawless rocket ship to the moon. I clicked […]