The Nasdaq's Relentless Rally Meets Its First Real Test
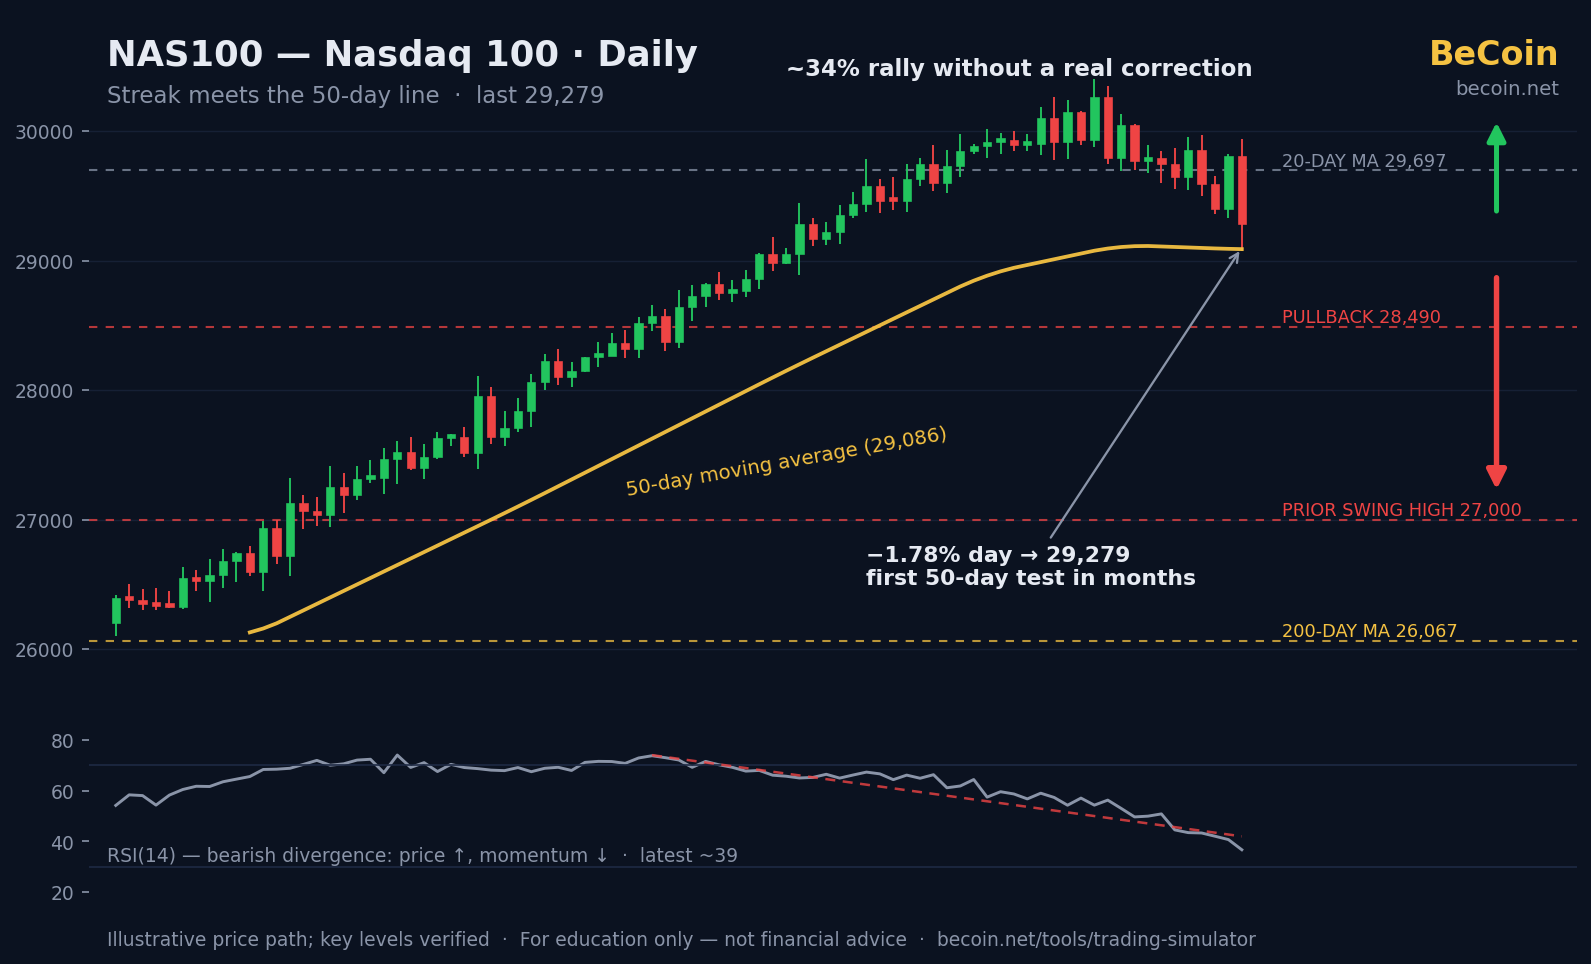
For months, the Nasdaq 100 did what felt impossible: it went up without meaningfully going down — a rally of roughly a third with no real correction, the kind of run that turns caution into a career risk. That streak is now under review. The index has slipped to about 29,279, falling 1.78% in a recent session, dropping below its 20-day moving average (29,697) and landing almost exactly on its 50-day average at 29,086 — its first test of that line in months.
Meanwhile, the Dow sits at record highs. The divergence is the story: the market's leadership is rotating away from the very stocks that built the rally, and index traders are asking the uncomfortable question — is this the pause, or the pivot?
The Setup
The pressure is coming from beneath the surface. The chip complex — the rally's engine room — has been selling off since Broadcom's June 6 guidance disappointment, with NVIDIA testing its own trend supports and Micron 20% off its peak. Concerns about the spiraling cost of AI infrastructure have crept from bearish blogs into mainstream analyst notes. And momentum measures have deteriorated: the index's 14-day RSI has slumped to around 39, with some chartists flagging historically severe bearish divergences — price making higher highs while momentum made lower highs for months.
The counterweight is equally real: the June jobs shock (57K vs ~110K expected) revived rate-cut hopes, which historically favor long-duration tech. That tension — weakening internals versus improving rate math — is being resolved right at the 50-day line.
Key Levels to Know
- 29,697 — the 20-day moving average, now the first overhead hurdle.
- 29,086 — the 50-day moving average, being tested now; the medium-term trend's report card.
- 28,490 — the pullback level widely circulated among index traders as the first target if the 50-day fails.
- 27,000 — the prior swing-high area that several analysts flag as a plausible Q3 correction destination.
- 26,067–26,200 — the 200-day moving average zone, the line between "correction" and "trend change."
The Bullish Case
Bulls point out that the long-term structure is untouched: the index remains far above its 200-day average, breadth damage is concentrated in one (admittedly large) sector, and the macro tailwind just strengthened — a cooling labor market pulls rate cuts forward, and lower discount rates are rocket fuel for tech multiples. Pullbacks to the 50-day average after extended runs are among the most-bought dips in index history. If the line holds and the index reclaims 29,697, the "34% without a correction" streak simply extends with a footnote.
The Bearish Case
Bears see a rally that has been narrowing for months finally showing it. When the leaders (chips) roll over while the index holds up on rotation, the clock starts ticking — divergences like the current RSI picture have preceded the Nasdaq's deeper corrections more often than its continuations, and this one is severe by historical standards. Extended AI-driven rallies, as one technical note put it, often end with deeper corrections than expected. The path is mapped: lose 29,086, and 28,490 comes fast; lose that, and the 27,000 prior swing high — a full measured correction — is the magnet, with the 200-day near 26,100 as the ultimate arbiter.
What Traders Should Watch Next
The 50-day test is the immediate event — watch not just whether it holds but how: a V-bounce on breadth expansion is bullish, a weak drift back to 29,697 that stalls is the bear pattern. Chip stocks are the tell within the tell; the index will not stabilize while SOXX makes new lows. July's US CPI print is the next macro fork — it either validates the rate-cut narrative or removes the bulls' best argument. And watch the Dow-Nasdaq divergence: record highs in one index and trend tests in another rarely coexist for long — one of them is wrong.
Conclusion
Streaks end or extend, and they usually decide at levels like this. The Nasdaq 100 at its 50-day average — with its leaders wounded, its momentum diverging, and its macro backdrop suddenly friendlier — is one of the cleanest risk-reward junctures the index has offered all year. The levels are drawn; the tape gets the last word.
Correction drills are best run before the correction. Test this setup in BeCoin's Trading Simulator: https://becoin.net/tools/trading-simulator — simulate the 50-day bounce and the 27,000 flush, and find out how your plan performs in both.
Related: NVIDIA below $200 and Micron's parabolic-year air pocket.
Risk note: This article is for information and education only and is not financial or investment advice. Index levels and moving averages shift daily; divergences and historical patterns do not guarantee outcomes. Always do your own research and never risk money you cannot afford to lose.
---

How Liquidity Affects Day Trading Results
When I first started trading day trading, I believed success was all about finding the perfect indicator. I spent weeks testing moving averages, RSI settings, support and resistance levels, and dozens of YouTube strategies that promised easy wins. Some worked for a few trades, but most failed. What confused me was that the same setup […]

Binomo First $10–$50 Test Deposit Plan: The Safest Way to Validate the Platform Before Scaling
I didn’t start with confidence. I started with doubt. Every time I searched for answers about Binomo, I found opinions, not proof. Some people claimed fast withdrawals. Others complained about delays. But almost nobody showed a complete journey from deposit to withdrawal using real money. So I stopped reading and started testing. Instead of risking […]

WTI reaches $89.43 as Brent clears $95 on renewed supply risk
WTI traded near $89.43 while Brent moved above $95 as Middle East shipping risk lifted crude for a fifth session. Key levels, catalysts and invalidation.

Which Broker Has Faster Withdrawals? Real 2026 Comparison for Traders
When most beginners choose a broker, they focus on bonuses, signals, or flashy interfaces. But after trading for a while, you realize one thing matters more than almost anything else: How fast can you actually withdraw your money? A broker can look perfect until your first withdrawal request gets stuck in “processing” for three days. […]

Fastest Withdrawal Brokers (Real Test Results)
The first time I made a profitable trade, I wasn’t thinking about strategy anymore. I was thinking about one thing. Can I actually withdraw this? I requested my payout and waited. And waited. That “processing” label stayed there longer than my trade itself. That moment changed how I evaluate brokers. Since then, I’ve made it […]

Is Binomo Safe or Risky in 2026? A Practical User Checklist (Not a Generic Review)
I still remember the first time I opened Binomo. It wasn’t excitement. It was hesitation. I had already read multiple reviews. Some said it was safe. Others called it risky. None of them felt like they came from someone who had actually traded, deposited, withdrawn, and dealt with real friction. So I decided to test […]