Bitcoin's $6,000 Box: The Levels Both Bulls and Bears Are Watching
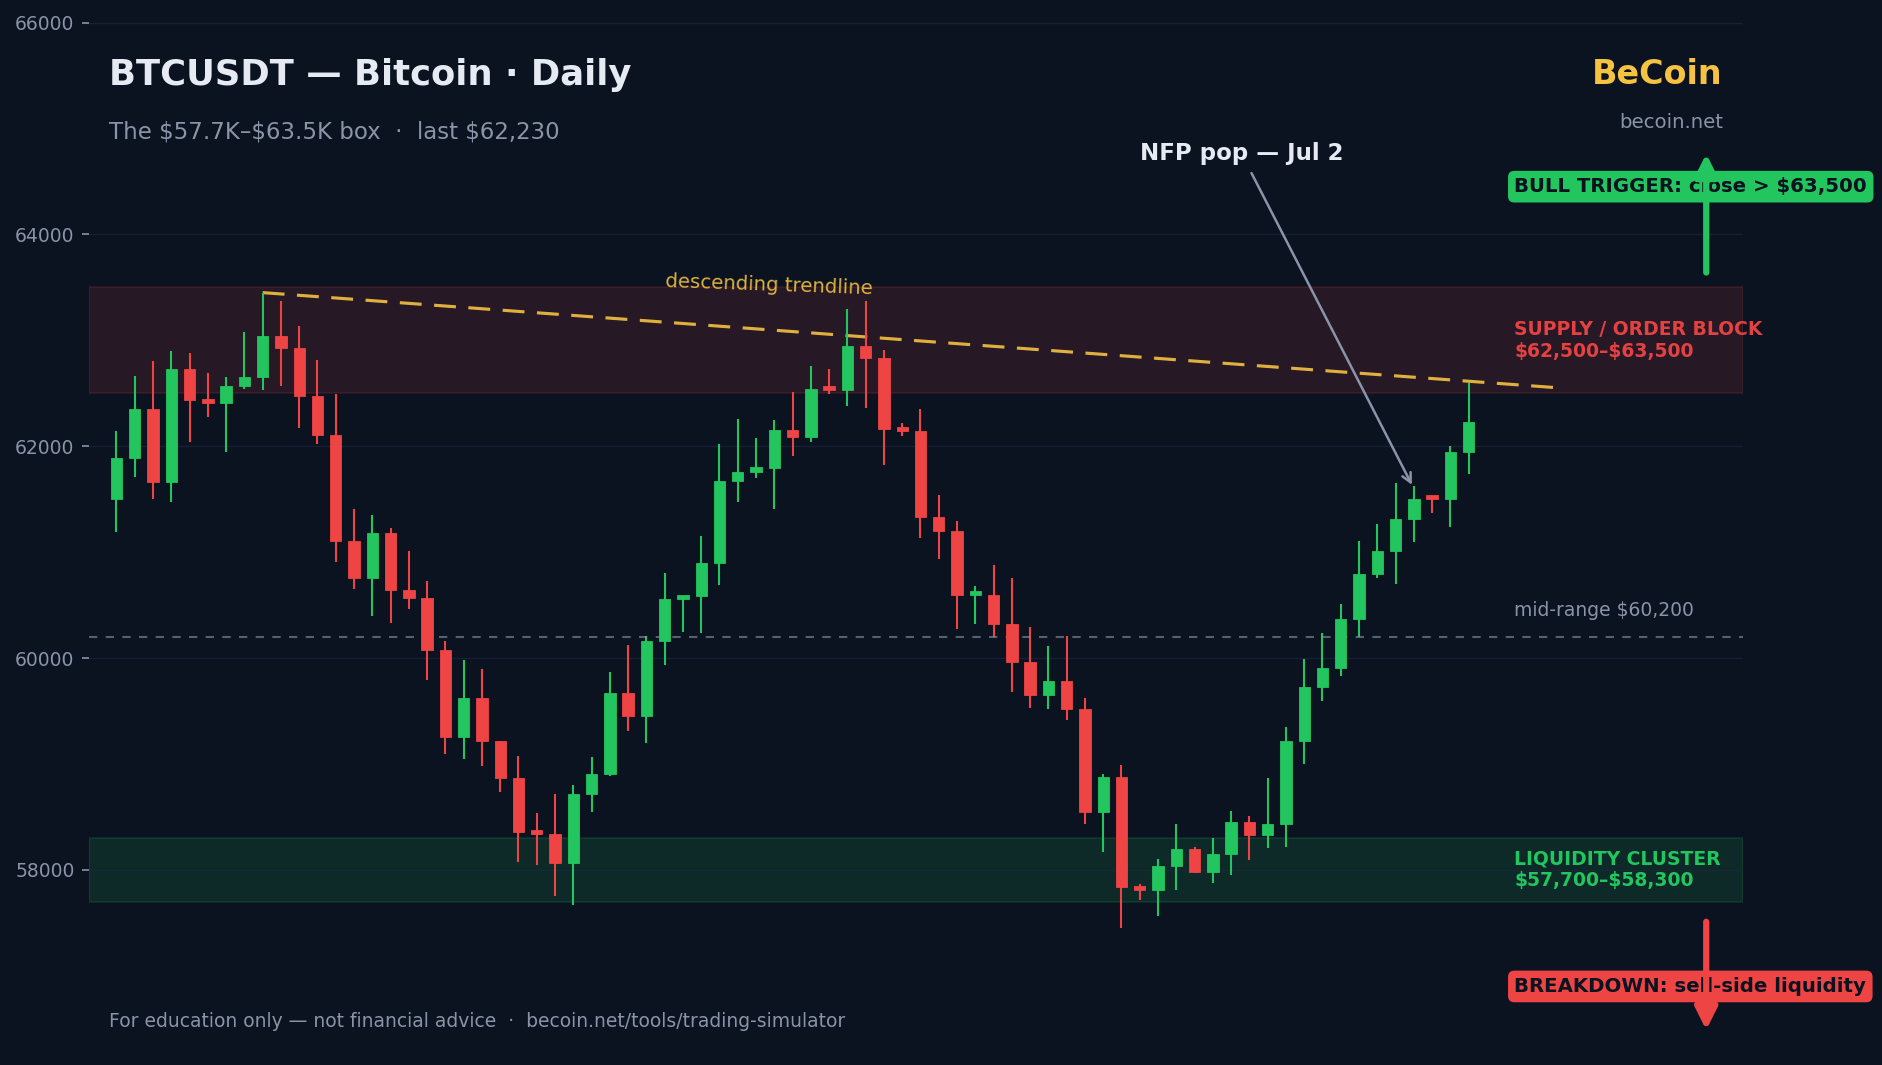
Bitcoin has spent weeks doing something it rarely does gracefully: going sideways. After the weak June US jobs report knocked the dollar lower, BTC popped back above $62,000 — trading near $62,230 on July 3, up about 4% on the week. But the move stopped short of the level everyone is arguing about, leaving Bitcoin exactly where it has been all along: inside a roughly $6,000 box between $57,700 and $63,500.
What makes this range unusual is the rare agreement between the two camps. Bulls and bears disagree violently about which way it resolves — but they are pointing at the same lines on the chart.
The Setup
Bitcoin's higher-timeframe structure turned heavy earlier this year, with a series of broken supports handing control to sellers. Since then, price has carved out a well-defined consolidation: a hard floor in the $57,700–$58,300 area, where large clusters of liquidations and resting orders sit, and a stubborn ceiling in the $62,500–$63,500 zone, reinforced by a descending trendline and an unfilled order block where sellers have repeatedly stepped in.
The July 2 jobs shock injected fresh energy. A softer dollar and shifting Fed expectations gave crypto a bid, and BTC ran from the high-$50Ks straight into the top third of the box. That is where the fight is happening now.
Key Levels to Know
- $63,500 — the top of the box and the bears' line in the sand. Several traders frame any move that stalls below it as a potential bull trap.
- $62,500–$63,500 — the supply zone: descending trendline plus the order block where recent rallies have died.
- $60,000–$60,200 — the round number and mid-range pivot; the first checkpoint if the ceiling rejects price again.
- $57,700–$58,300 — the liquidity cluster at the bottom of the box. Range traders buy it; breakdown traders watch it like hawks, because a clean break exposes the sell-side liquidity below.
The Bullish Case
Bulls argue the floor keeps doing its job. Every trip into $57,700–$58,300 has been bought, building a multi-touch base while macro conditions quietly improve: a cooling labor market, repriced rate expectations under Fed Chair Kevin Warsh, and a dollar that just printed its softest week in months. Longer-horizon accumulators add a cycle argument — that the $55K–$65K area represents value comparable to prior cycle lows. In their playbook, enough tests of the ceiling weaken it, and a daily close above $63,500 turns the whole consolidation into a launchpad.
The Bearish Case
Bears see a market making lower highs against a hard ceiling, inside a broader structure that already broke down. To them, the post-jobs pop is a liquidity grab — a push into the $62,500–$63,500 supply zone designed to fill sell orders before the next leg lower. Their roadmap: rejection at the ceiling, a slide through $60,200, then a magnet-like run into the liquidation cluster at $57,700–$58,300. If that floor finally gives way, the box resolves downward and the sell-side liquidity below becomes the target.
What Traders Should Watch Next
Watch the ceiling first: a daily close above $63,500 — especially on rising volume — is the cleanest available signal that the range is resolving up, while another sharp rejection keeps the bear roadmap intact. Then watch the floor's behavior: each successive test of $57,700–$58,300 either reinforces the base or thins out the buyers defending it. Funding rates and liquidation data are worth monitoring too, since crowded positioning at the edges of a range is precisely what fuels violent breakouts. And keep one eye on the dollar: this box has been living and dying by US macro data all summer.
Conclusion
Ranges like this are where patience gets tested and opinions get expensive. Bitcoin at ~$62,200 is close enough to the ceiling to excite breakout traders and close enough to resistance to embolden the fade. The honest answer is that nobody knows which side of the box breaks — but rarely have both camps agreed so precisely on where the answer will be revealed.
Practice both scenarios before the market picks one. Test this setup in BeCoin's Trading Simulator: https://becoin.net/tools/trading-simulator — long the breakout, fade the ceiling, and find out which plan you actually stick to under pressure.
Related: Ethereum's yearly lows and Solana's $80 supply-zone retest.
Risk note: This article is for information and education only and is not financial or investment advice. Cryptocurrency prices are highly volatile, ranges can break in either direction without warning, and the levels discussed here can become outdated quickly. Always do your own research and never risk money you cannot afford to lose.
---

Bitcoin slips to $65,741 as oil and yields test the breakout
Bitcoin is near $65,741 as rising oil and Treasury yields test the $65.7K breakout floor. Here are the levels that confirm or invalidate the move.

WTI reaches $89.43 as Brent clears $95 on renewed supply risk
WTI traded near $89.43 while Brent moved above $95 as Middle East shipping risk lifted crude for a fifth session. Key levels, catalysts and invalidation.

Binomo vs IQ Option Withdrawal Speed: Full 2026 Comparison Guide
Withdrawal speed is one of the most important factors for traders, especially beginners who want quick access to profits. A platform may look good for trading, but if getting your money takes too long, frustration builds fast. In this detailed comparison of Binomo and IQ Option, we will break down real withdrawal timelines, processing behavior, […]

EUR/USD holds 1.1414 before the ECB decision: three scenarios
EUR/USD traded near 1.1414 before the ECB’s July decision. Here is what a hold, hawkish hold or surprise hike could mean for 1.1350 and 1.1480.

How Liquidity Affects Day Trading Results
When I first started trading day trading, I believed success was all about finding the perfect indicator. I spent weeks testing moving averages, RSI settings, support and resistance levels, and dozens of YouTube strategies that promised easy wins. Some worked for a few trades, but most failed. What confused me was that the same setup […]

Why Traders Move from Binomo to Deriv in 2026: The Real Reasons Behind the Switch
If you spend enough time around trading communities, you’ll notice a pattern. Many traders start with Binomo. Then, after a few months, a surprising number begin looking at Deriv. Some switch completely. Others keep both accounts but gradually move most of their trading activity to Deriv. I noticed this trend while talking to beginner traders […]