NVIDIA Below $200: Healthy Pullback or Start of Distribution?
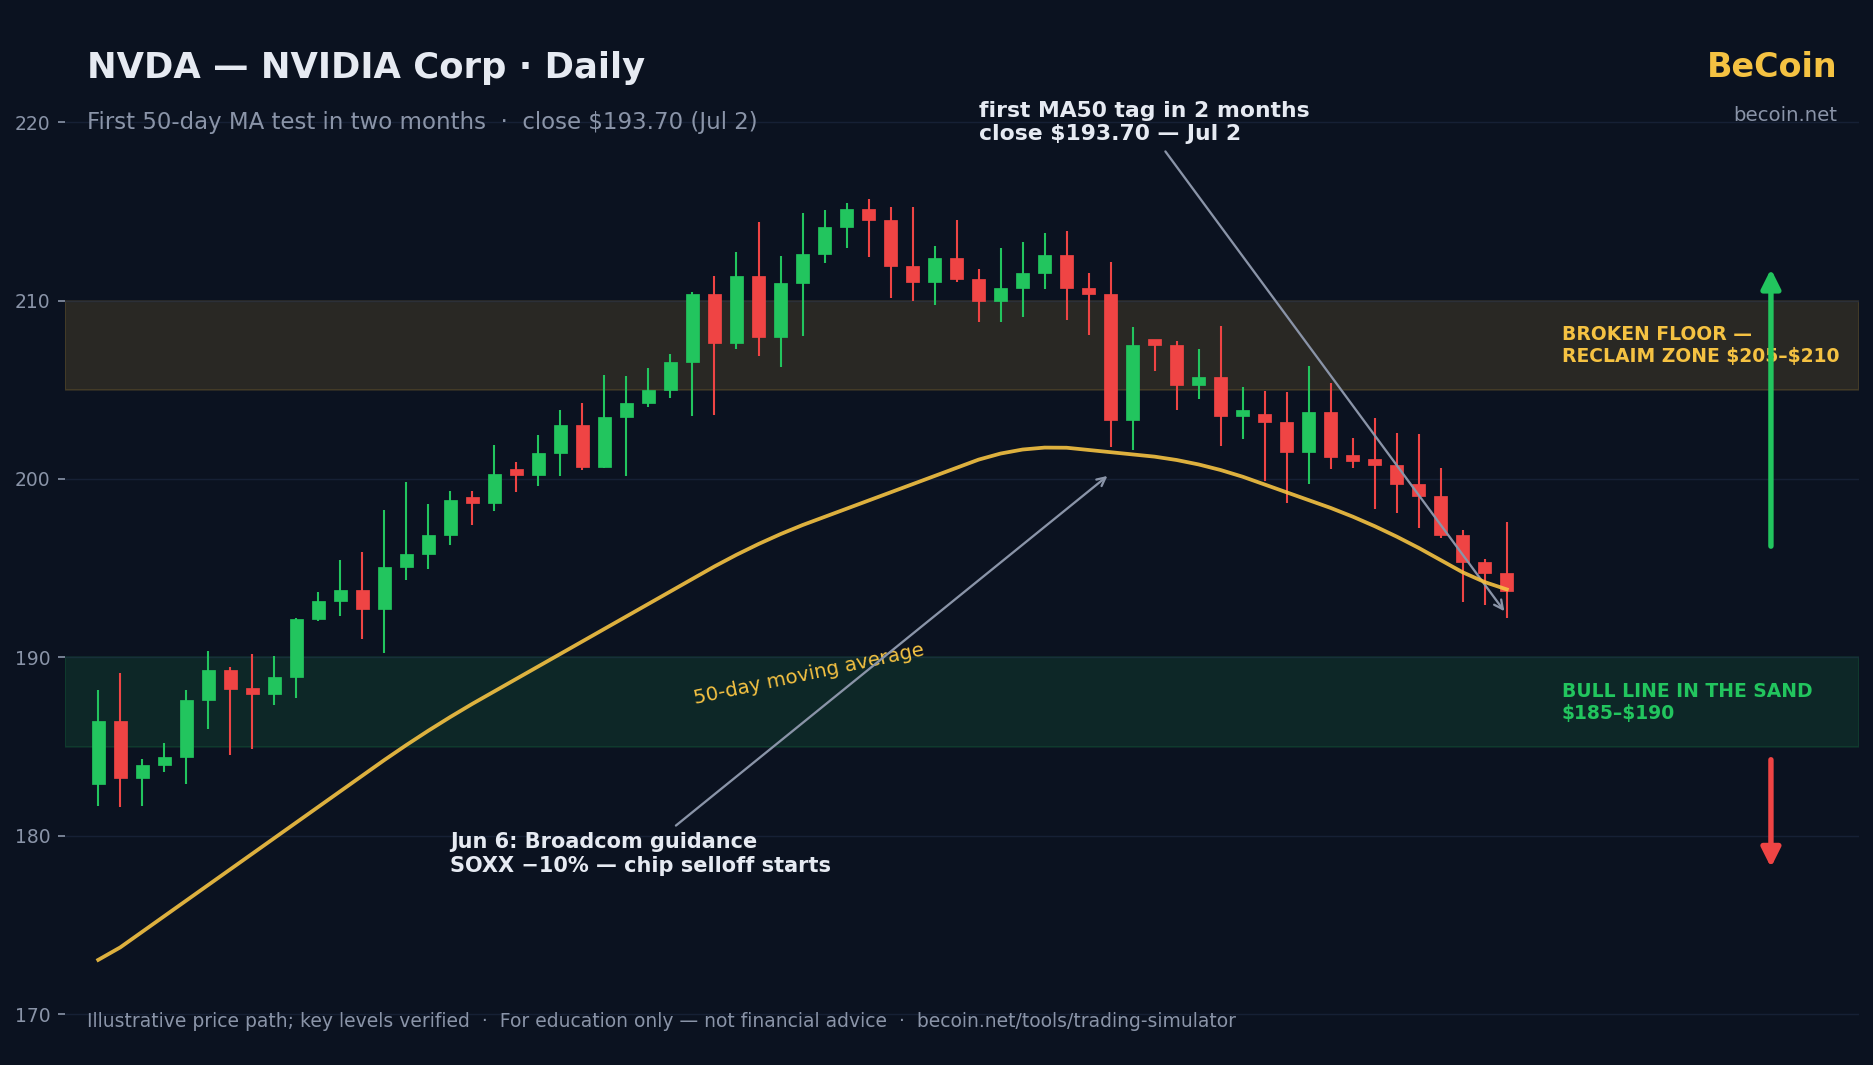
For two months, NVIDIA did not so much as touch its 50-day moving average. That streak just ended. NVDA closed at $193.70 on July 2, down about 2% on the day, below the $210 level that had anchored its recent range — and sitting on the moving average that has defined its uptrend. Perhaps more telling: when megacap tech bounced in late June, NVIDIA and Alphabet sat the rally out.
Five separate chart debates about this stock are trending simultaneously among traders, and they all boil down to one question. Is this the routine pullback that bull markets hand out — or the early stage of distribution, where big holders quietly sell into strength?
The Setup
The pressure is sector-wide, not NVIDIA-specific — at least on the surface. The chip complex has been under fire since June 6, when Broadcom's disappointing guidance (despite record revenue) triggered a roughly 10% single-day plunge in the semiconductor ETF SOXX. Since then the tape has been fed a steady diet of worries: the spiraling cost of AI infrastructure, a hot May jobs report that pressured rate-sensitive tech, and — most structurally — rising competition. Amazon says its in-house chip business is booming, and Google now plans to sell its custom TPUs to select outside customers, converting two of NVIDIA's biggest clients into partial rivals.
Against that backdrop, NVDA lost the $210 level, slid below $200, and arrived at its first 50-day-MA test in exactly two months. Micron, the sector's other momentum darling, fell even harder the same week.
Key Levels to Know
- $205–$210 — the broken range floor, now the overhead zone bulls must reclaim to repair the chart.
- ~$195 — the 50-day moving average area where price currently sits; the uptrend's report card.
- $185–$190 — the downside zone chartists flag if the MA test fails; a break there turns "pullback" into "correction."
- Relative strength vs SOXX — not a price level, but the tell traders are using: leaders that stop leading are the classic early distribution signal.
The Bullish Case
Pullbacks to the 50-day MA are what healthy uptrends do — statistically, they are among the most common continuation setups in momentum stocks. The selloff's catalysts are sector sentiment (Broadcom's guidance) rather than anything in NVIDIA's own results, and demand for AI compute remains enormous by every disclosed metric. Bulls also note the competition story is old news repackaged: custom silicon from Amazon and Google has coexisted with NVIDIA's growth for years, and the accelerator market is expanding fast enough to feed multiple winners. A high-volume bounce off the MA with a reclaim of $205–$210 would mark this as yet another dip that punished the sellers.
The Bearish Case
Distribution doesn't announce itself; it shows up as subtle behavior changes at highs — and bears see several. The stock stopped responding to good sector news, skipped the megacap bounce entirely, and broke its range floor on rising volume. The competitive threat is different this time, they argue: when your largest customers become sellers of alternatives, the pricing power that drives extraordinary margins is structurally at risk. Add the "rising AI infrastructure cost" narrative — which pressures the capex budgets that buy NVIDIA's chips — and the two-month MA streak breaking looks less like a dip and more like a character change. Below $185–$190, the distribution thesis graduates from suspicion to trend.
What Traders Should Watch Next
The MA test itself is the headline: a decisive bounce or a decisive failure at ~$195 sets the next leg. Volume is the lie detector — weak-volume bounces into $205–$210 that stall would fit the distribution script, while heavy-volume reclaim would break it. Watch SOXX and Micron for sector confirmation in either direction. On the fundamental calendar, any AI-capex commentary from the hyperscalers — the customers-turned-competitors — now moves this stock as much as its own news. And keep an eye on the broader tape: NVDA has been the market's bellwether, and index traders are watching this exact chart for their own reasons.
Conclusion
NVIDIA at $193.70 is a stock at its moment of truth: the uptrend's most reliable support, tested for the first time in two months, in a sector suddenly full of questions. Bulls have history on their side — most MA tests in strong stocks resolve higher. Bears have behavior on theirs — leaders rarely stop leading without a reason. The next few weeks of price action will tell which reading was right, and the levels could not be more clearly drawn.
Rehearse both outcomes before the market grades your thesis. Test this setup in BeCoin's Trading Simulator: https://becoin.net/tools/trading-simulator — buy the MA bounce, short the failed reclaim, and find out how you actually trade a bellwether at its line in the sand.
Related: Micron's parabolic-year air pocket and Nasdaq 100's 50-day test.
Risk note: This article is for information and education only and is not financial or investment advice. Individual stocks — especially high-momentum technology names — can move sharply on earnings, guidance, and sector news; levels referenced can become outdated quickly. Always do your own research and never risk money you cannot afford to lose.
---

Deriv Volatility 75 Strategy Backtest: What Actually Works After 1,000 Trades?
The first time I tried trading Volatility 75, I thought I had found the perfect market. No news shocks. No central banks. Just clean, continuous price movement. Within two weeks, I blew my first account. That experience forced me to stop guessing and start testing. Instead of chasing indicators or copying strategies from forums, I […]

Binomo First $10–$50 Test Deposit Plan: The Safest Way to Validate the Platform Before Scaling
I didn’t start with confidence. I started with doubt. Every time I searched for answers about Binomo, I found opinions, not proof. Some people claimed fast withdrawals. Others complained about delays. But almost nobody showed a complete journey from deposit to withdrawal using real money. So I stopped reading and started testing. Instead of risking […]

Trading Currency Strength Instead of Single Pairs
It was a Tuesday afternoon when I realized I was fighting a losing battle against a ghost. My screen was a chaotic web of indicators. I had the EUR/USD chart open, a moving average crossing over here, a relative strength index flashing oversold there, and a price action setup that looked textbook perfect. I clicked […]

How Liquidity Affects Day Trading Results
When I first started trading day trading, I believed success was all about finding the perfect indicator. I spent weeks testing moving averages, RSI settings, support and resistance levels, and dozens of YouTube strategies that promised easy wins. Some worked for a few trades, but most failed. What confused me was that the same setup […]

Why Traders Move from Binomo to Deriv in 2026: The Real Reasons Behind the Switch
If you spend enough time around trading communities, you’ll notice a pattern. Many traders start with Binomo. Then, after a few months, a surprising number begin looking at Deriv. Some switch completely. Others keep both accounts but gradually move most of their trading activity to Deriv. I noticed this trend while talking to beginner traders […]

Deriv vs IQ Option for Beginners in 2026: Which Platform Is Better to Start With?
Choosing your first trading platform can decide whether you stay consistent or quit after blowing your first account. Most beginners do not fail because trading is impossible. They fail because they start on platforms that confuse them, encourage emotional trading, or make risk management difficult. Two names that often appear in beginner discussions are Deriv […]