
Multiple Timeframe Analysis Made Simple
I will never forget the crisp Thursday autumn morning when I blew through $1,200 in less than forty-five minutes.
I was sitting in my dimly lit home office, staring intensely at a 1-minute candlestick chart. Every indicator on my screen was screaming "BUY." The Relative Strength Index (RSI) was bouncing right out of oversold territory, and a glowing green bullish engulfing candle had just formed. Confident that I was about to catch the bottom of a massive breakout, I slammed the call button.
Three seconds later, a violent red candle slashed right through my position like a hot knife through butter. I doubled down, convinced it was a temporary dip. It wasn't. Within minutes, my entire morning balance evaporated into thin air.
Defeated, I zoomed out to the 1-hour chart to figure out what went wrong. What I saw sent a cold chill through my spine.
I had just placed a aggressive buy trade directly against a massive, month-long bearish downtrend that was barreling downward on the macro scale. I was trying to fight a roaring tsunami with a plastic spoon. I was so zoomed in on the immediate 60-second noise that I had completely missed the massive structural reality staring me in the face.
That painful loss was the exact catalyst I needed. It forced me to abandon my single-chart obsession and master Multiple Timeframe Analysis (MTFA).
What Exactly Is Multiple Timeframe Analysis?
Multiple Timeframe Analysis (MTFA) is the practice of analyzing the exact same financial asset across different chart timeframes before placing a single trade.
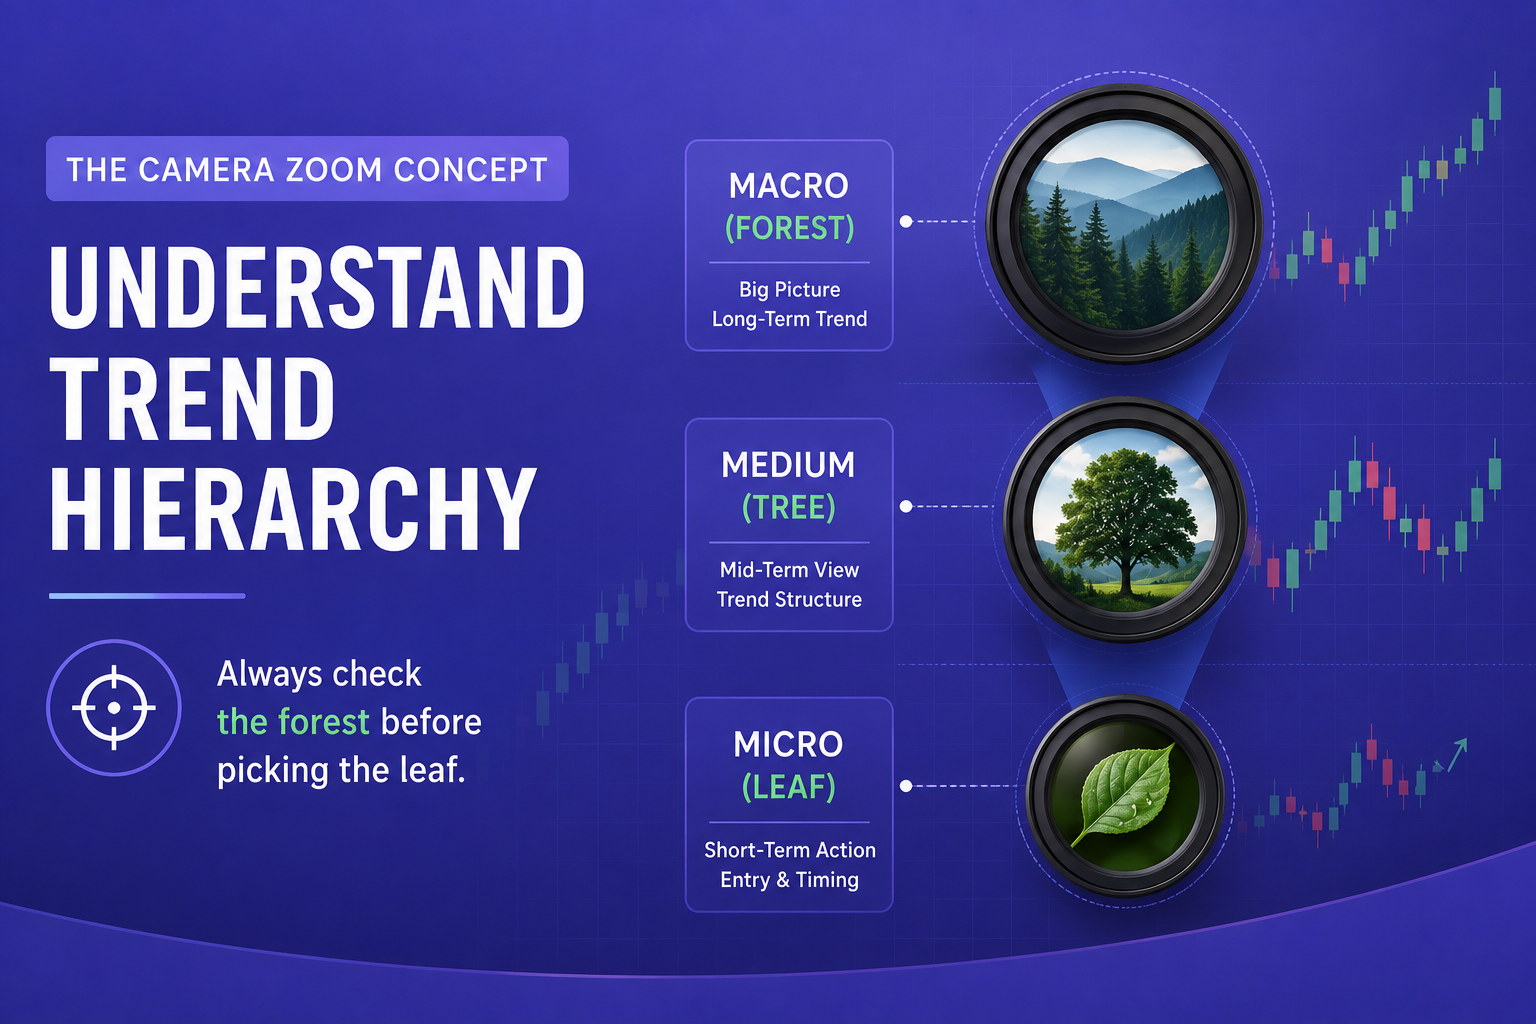
Think of it like looking through a camera lens. When you zoom out, you get the big picture: the landscape, the weather, and the direction of the road. When you zoom in, you see the individual rocks and path details right in front of you.
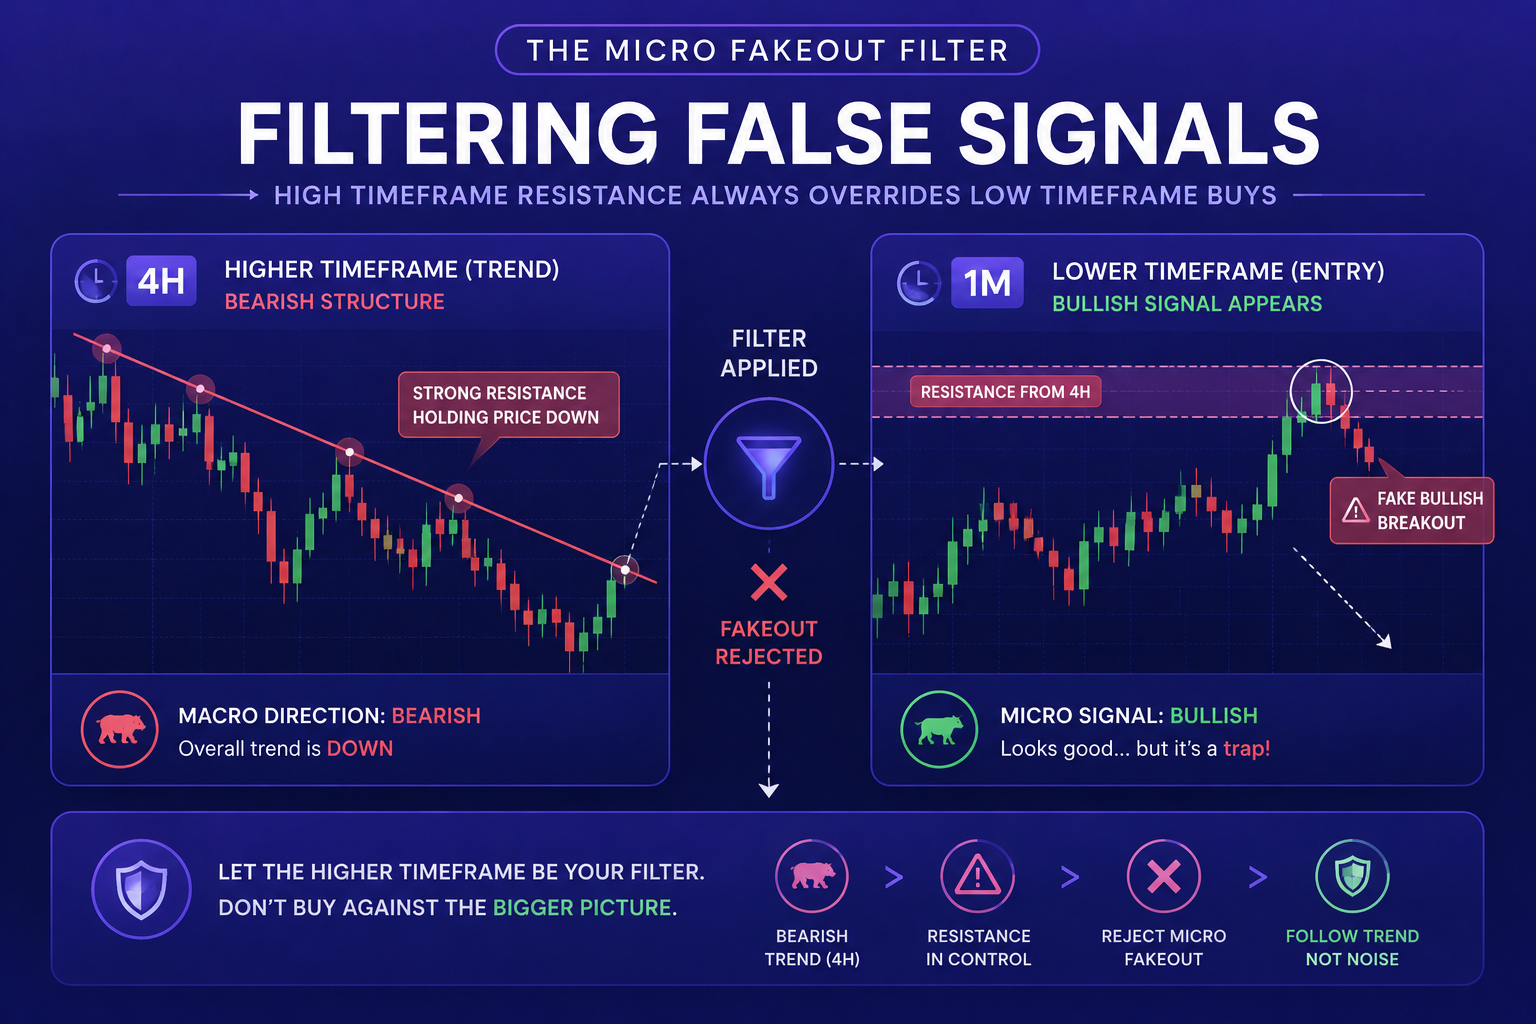
Most novice traders spend 100% of their time zoomed in on small charts. They spot a minor bullish pattern on a 1-minute chart and execute immediately, completely oblivious to the fact that the 4-hour chart is bumping into a massive historical resistance zone.
By analyzing high, medium, and low timeframes in harmony, you align your micro entries with macro institutional flow. You stop swimming upstream and start letting the big market waves carry your trades straight into profit.
The Rule of 4 or 6: Selecting Your Timeframes
When I first learned about MTFA, I made the classic rookie mistake of opening six different charts simultaneously—1-minute, 5-minute, 15-minute, 1-hour, 4-hour, and daily. My screen looked like a chaotic NASA control panel, and I ended up trapped in severe "analysis paralysis."
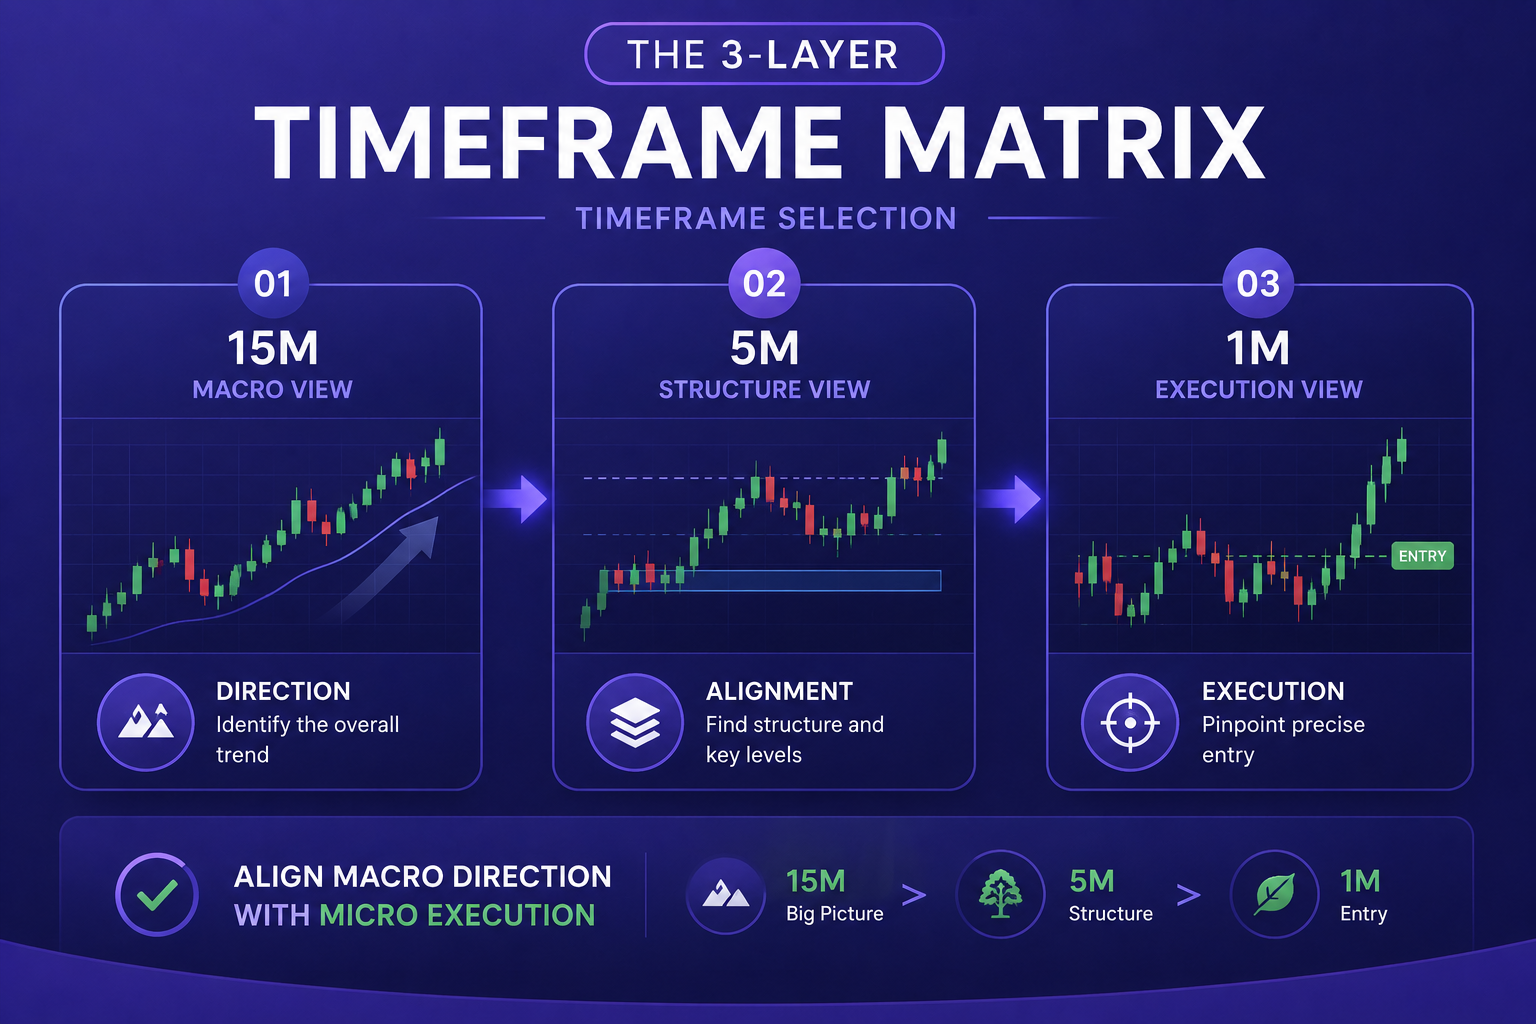
To keep MTFA simple and effective, you only need three timeframes. A good golden rule is to separate each timeframe by a ratio of roughly 4 to 6.
The Standard 3-Timeframe Blueprint
- Higher Timeframe (The Macro Compass): Defines the overarching trend and key structural supply/demand zones.
- Medium Timeframe (The Tactical Setup): Reveals market structure shifts, intermediate patterns, and key pullbacks.
- Lower Timeframe (The Precision Trigger): Pinpoints your exact entry point, minimizes stop loss distance, and maximizes risk-to-reward ratio.
Here is how you should structure your workspace based on your primary trading style:
| Trading Style | Higher Timeframe (Macro) | Medium Timeframe (Tactical) | Lower Timeframe (Trigger) |
|---|---|---|---|
| Scalping / Short Expiry | 15-Minute | 5-Minute | 1-Minute |
| Day Trading | 4-Hour | 1-Hour | 5-Minute / 15-Minute |
| Swing Trading | Weekly | Daily | 4-Hour |
How I Execute the 3-Step MTFA Strategy Step-by-Step
Let me walk you through an actual trade setup to show you how seamless this process becomes once you build the habit.
Step 1: Find the Macro Direction on the Higher Timeframe
I start my morning by opening my higher timeframe—let's say the 15-minute chart if I'm scalping. I draw my key support and resistance levels, highlight recent swing highs and lows, and identify the primary trend.
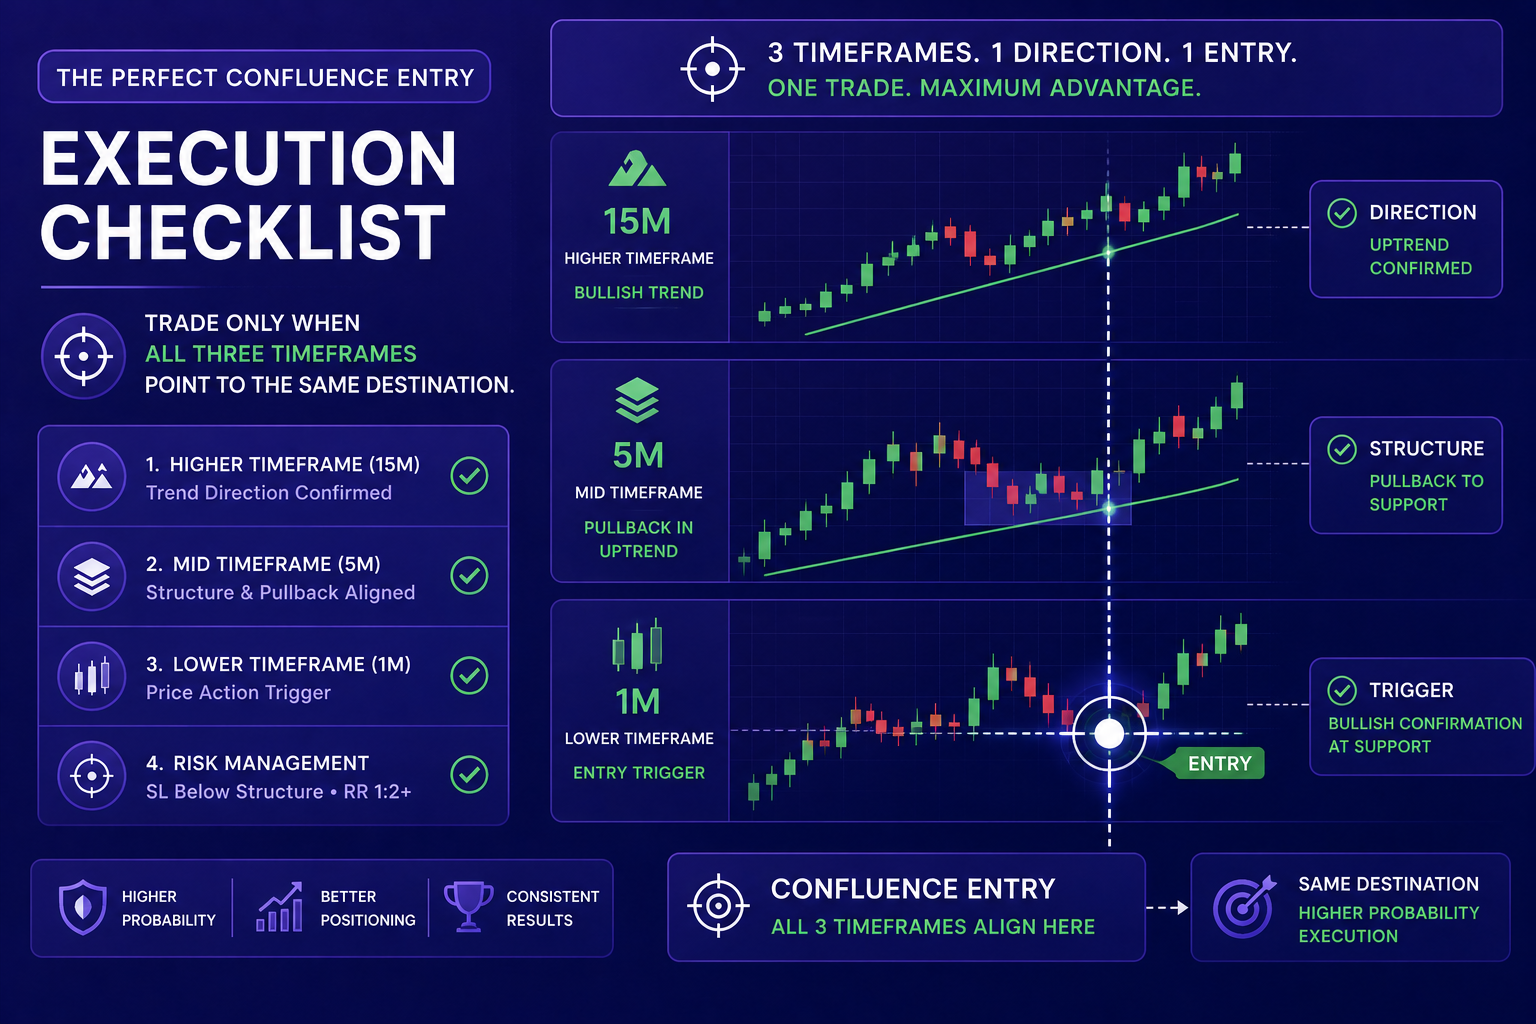
If the higher timeframe is making higher highs and higher lows, my bias for the day is strictly BULLISH. I will ignore every short signal on my lower charts.
Step 2: Identify the Setup Zone on the Medium Timeframe
Next, I drop down to my 5-minute chart. Here, I wait patiently for price to pull back into a high-probability area—such as a key support level, a moving average confluence, or a Fibonacci retracement level.
If the macro trend is bullish, I want to catch the market at the bottom of a temporary dip, not while it is overextended at peak resistance.
Step 3: Trigger the Precision Entry on the Lower Timeframe
Finally, I zoom into my execution chart—the 1-minute chart. I don't jump in blindly. I wait for the lower timeframe to confirm that the micro-downtrend is ending and re-aligning with the macro uptrend.
I look for a micro reversal trigger:
- A bullish candlestick engulfing pattern
- A double bottom formation
- A bullish divergence on the oscillator
- A breakout above a micro counter-trend line
When that micro trigger fires in alignment with the 15-minute trend, I hit the trade button with total confidence.
Where to Practice Multiple Timeframe Analysis
Theory is completely useless without real chart practice. When testing new structural strategies, executing on a reliable, responsive trading platform is essential.
If you are looking to refine your multi-timeframe analysis across day trading, digital contracts, or forex markets, practicing on clean chart interfaces makes a world of difference. You can test your MTFA setups on popular platforms like Deriv, explore high-velocity execution using IQ Option, or sharpen your market timing over at Pocket Option.
For options traders who prefer minimalist, fast-loading chart layouts, platforms such as Quotex and Binomo offer seamless timeframe switching tools. Alternatively, flexible trading setups are also accessible through ExpertOption,Olymp Trade, and CapitalCore.
Common MTFA Pitfalls That Will Cost You Money
While Multiple Timeframe Analysis is an incredible strategy, it isn't a magic wand. Here are three major mistakes I made during my learning curve so you can avoid them entirely:
- Timeframe Overload: Staring at too many timeframes causes confusion. Stick strictly to three.
- Ignoring the Macro Context: Never take a lower timeframe signal that directly contradicts your higher timeframe bias.
- Chasing Overextended Moves: Wait for price on the medium timeframe to pull back into value zones before seeking an entry trigger on the micro scale.
If you want to dive deeper into practical technical setup rules, check out our guide on how to avoid trade traps on our official blog.
Final Thoughts: Stop Trading in the Dark
Switching to Multiple Timeframe Analysis transformed my trading results. It took me from a stressed-out retail trader gambling on 60-second noise to a disciplined trader executing with institutional precision.
If you are tired of getting stopped out by unexpected market reversals, stop looking at single charts in isolation. Zoom out, read the big picture, align your lower timeframe triggers, and let the broader market do the heavy lifting for you.
To gain a true structural edge in today's fast-moving markets, check out our comprehensive BeCoin Tariff Plans to get daily in-depth technical analysis, premium signal indicators, and professional multi-timeframe trade setups sent straight to your device.
If you want to see a real-time walkthrough of how price action reversals work across short timeframes, check out this Day Trading Strategy Walkthrough. It provides a great visual demonstration of watching candle reactions and identifying high-probability entry windows when technical indicators align.

Finding the Best Trading Broker for Side Income: My Raw, First-Hand Journey to Consistent Daily Wins
Six months ago, I sat at my kitchen table staring at an accumulation of household bills, realizing my primary salary was no longer cutting it. I didn’t want a second job that required clocking into a physical location or taking endless boss mandates after hours. I needed a flexible, scalable side income. That night, I […]

Best Broker for One Trade a Day Strategy in 2026
Most traders lose money because they trade too much. They enter random setups, chase candles, overreact emotionally, and turn a simple strategy into pure gambling. That is exactly why the one trade a day strategy is becoming more popular among smart traders in 2026. Instead of sitting in front of charts all day, this approach […]

Simple Daily Trading Routine for Consistency
Most traders do not fail because of strategy alone. They fail because they are random. They trade when emotional, skip planning, increase risk after losses, and ignore review sessions. Consistency in trading usually comes from routine more than prediction. A simple daily trading routine helps you stay disciplined, reduce emotional mistakes, and improve decision making […]

How Much Money Do You Really Need to Start Trading? A Realistic Beginner’s Guide for 2026
One of the most common questions beginners ask is: How much money do I need to start trading? It sounds like a simple question, but the answer depends on what you actually mean by start trading. Are you trying to learn? Are you hoping to grow savings over time? Are you trying to create a […]

Deriv Copy Trading (DBot & Signal Services): Can Automation Beat Manual Trading?
When I first started trading on Deriv, everything I did was manual. Every entry, every exit, every mistake. I would sit in front of charts watching price ticks move on synthetic indices, trying to time trades perfectly. Some days I would catch a streak of wins and feel like I had finally figured it out. […]
Deriv Day Trading vs Offshore Brokers: Execution Model Comparison
I did not start my trading journey thinking about execution models. Like most beginners, I started with charts, indicators, and the belief that if I could just find the right entry signal, profits would follow. My early trading notebook was full of screenshots of RSI signals, candlestick patterns, and support levels. What it did not […]