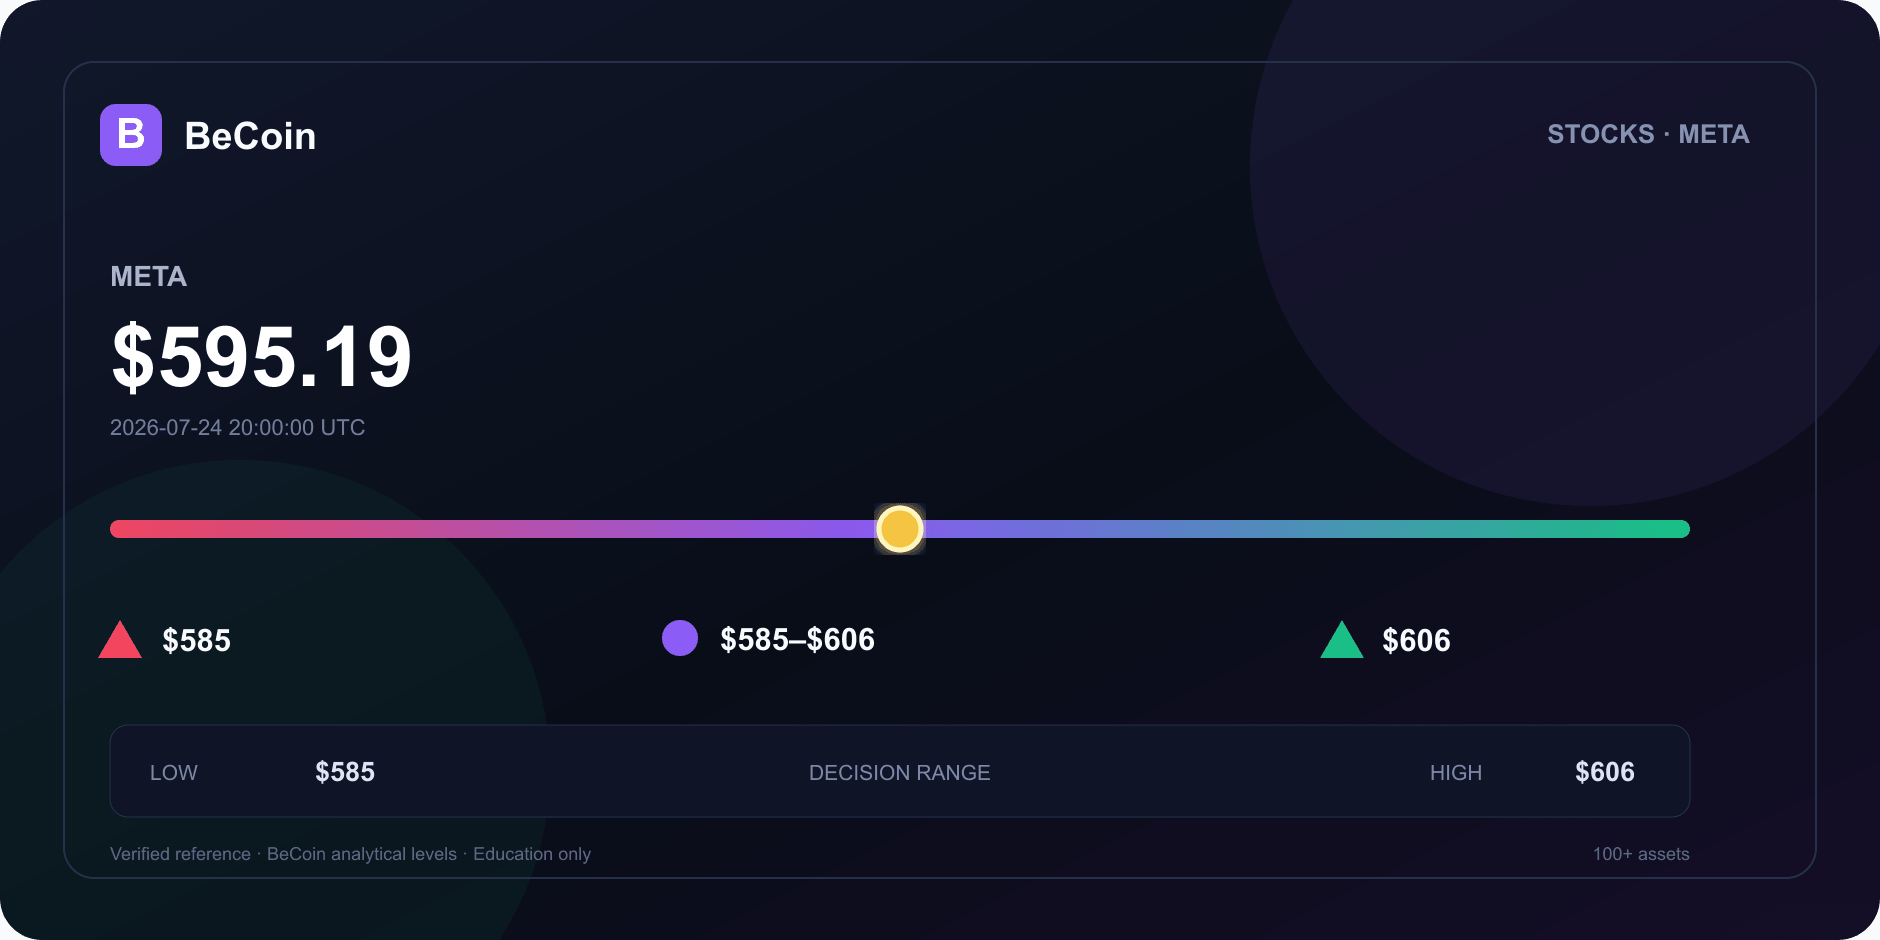
Meta falls 1.80% to $595.19 as earnings risk moves into view
# Meta falls 1.80% to $595.19 as earnings risk moves into view
Meta Platforms has experienced a decline of 1.80%, closing at $595.19. This movement has brought earnings risks into focus, prompting discussions among investors regarding the stock's future trajectory.
Why it matters
The current level of $595.19 is significant as it reflects the market's reaction to upcoming earnings reports. The range of $585–$606 is identified as crucial analytical levels by BeCoin, which helps investors understand potential price movements. The decline may indicate market apprehension about the company's performance, while the established range provides a framework for evaluating future price action.
Technical and market context
Google Finance displayed Meta Platforms at $595.19 at 2026-07-24 20:00:00 UTC, down 1.80% at the regular-session close. The article uses $595.19 as the verified reference and labels $585–$606, $606, and $585 as BeCoin analytical levels rather than sourced price targets. The market debate centers around whether the stock can rebound or if it may continue to decline, depending on the forthcoming earnings results.
TradingView's newest Meta ideas were divided between risk-focused shorts and bullish news-flow or longer-term setups. These are contributor opinions. The mixed sentiment reflects the uncertainty surrounding Meta's performance, which can influence trading strategies.
BeCoin forecast read
The BeCoin analysis indicates two potential scenarios based on the current price action. In a bullish scenario, if Meta stock can break above $606, it may signal a positive shift in market sentiment, potentially leading to further gains. Conversely, in a bearish scenario, if the stock falls below $585, it may validate concerns regarding the company's earnings and lead to additional selling pressure. The market can react differently based on the earnings report, making it essential for investors to monitor these levels closely.
Methodology and sources
This analysis is based on data from various sources, including Google Finance and TradingView. The factual research cutoff was July 26, 2026; closed-market references retain their July 24 source time. The insights provided are intended to help investors navigate the current market landscape and understand the implications of Meta's stock movement.
BeCoin distinguishes the actual 1.80% decline from the conflicting narratives and states what price action would validate either side. The search intent behind this article is to provide clarity on the current state of Meta stock today and the potential value gap that exists as the market anticipates earnings.
Related market analysis · Related BeCoin tool
Google Finance quote · Meta investor relations · TradingView ideas
| Evidence field | Value |
|---|---|
| Verified reference | $595.19 |
| Source time | 2026-07-24 20:00:00 UTC |
| Base range | $585–$606 |
| Bull confirmation | $606 |
| Bear confirmation | $585 |
This content is for education only and is not financial advice.

The Clock and the Cash: My Journey into the Hidden Rhythm of Session-Based Trading
There was a time when I thought the global financial market was a single, monstrous wave that never stopped moving. I believed that if I sat in front of my monitors long enough, clicking buttons whenever a pretty pattern appeared on my charts, the market would eventually reward my sheer endurance. I was dead wrong. […]
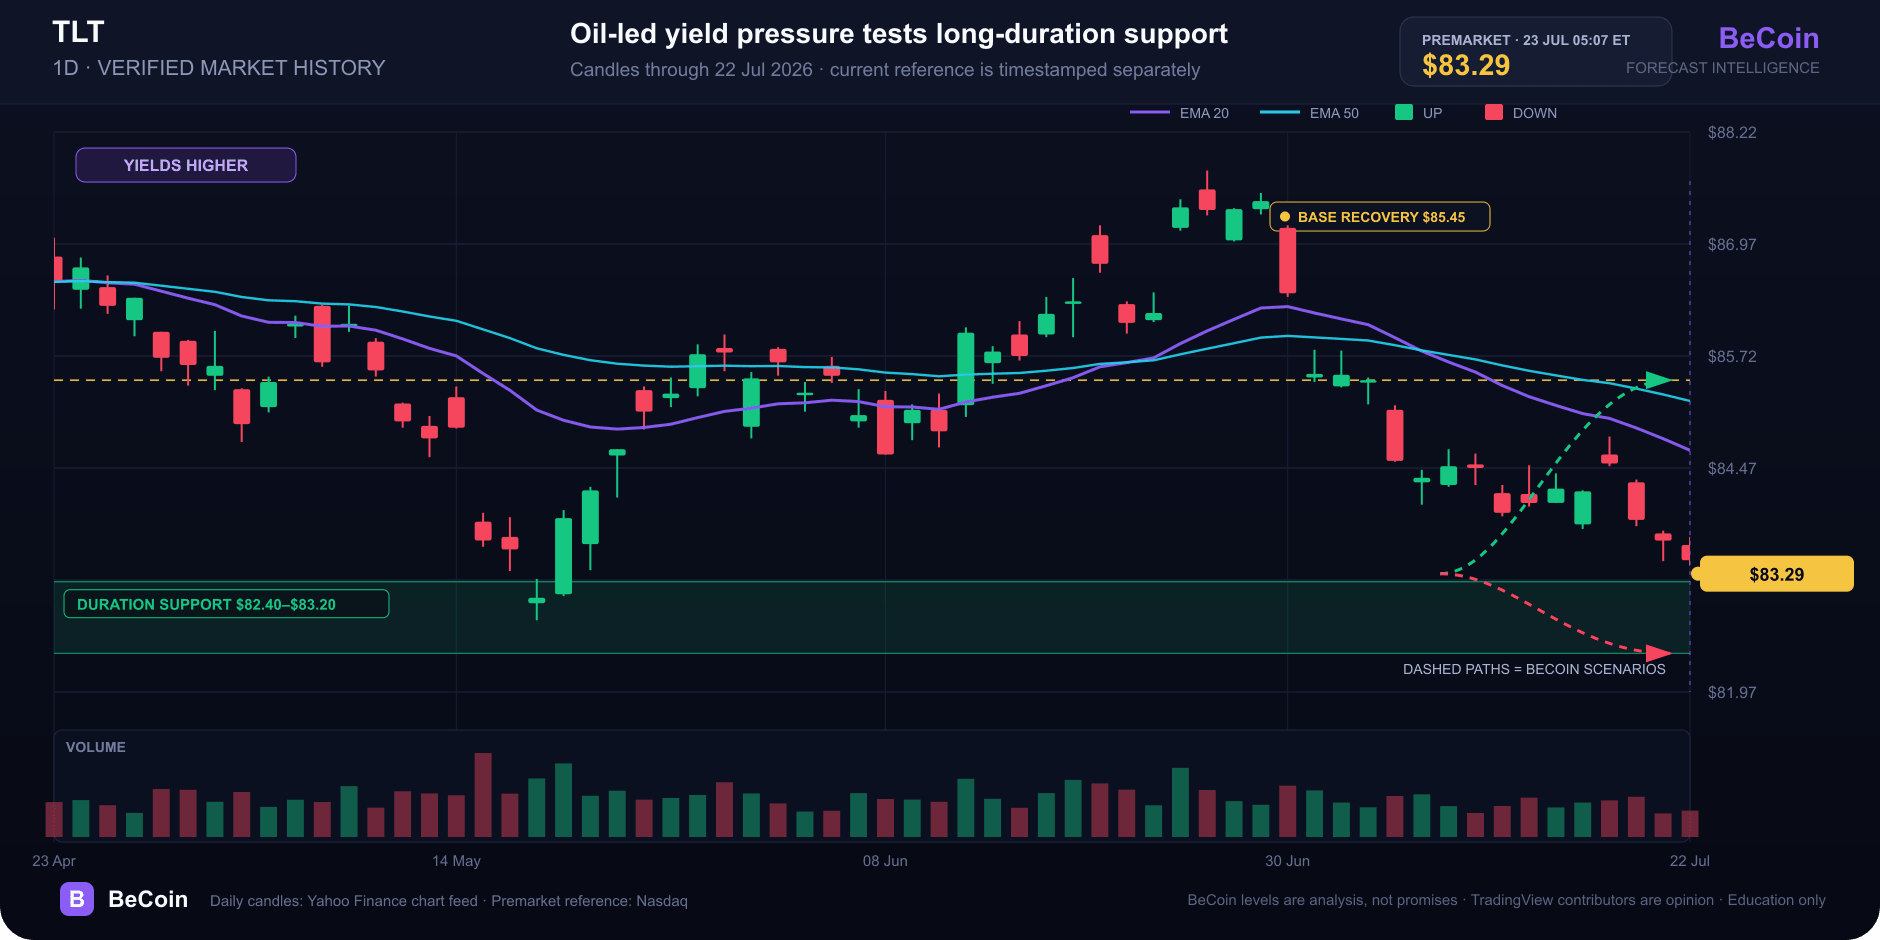
TLT slips to $83.29 as oil pushes long-duration risk back into focus
TLT traded near $83.29 premarket as oil and Treasury yields rose. Here is why duration matters and which levels separate a base from a breakdown.

Why Most Deriv Traders Blow Accounts: A Data-Driven Post-Mortem Analysis
The first time I blew a trading account on Deriv, it didn’t happen dramatically. There was no single catastrophic trade. It happened quietly. One loss turned into another. Then I increased the stake to recover the loss. Then the market moved again. Before I realized what had happened, an account balance that took weeks to […]

WTI reaches $89.43 as Brent clears $95 on renewed supply risk
WTI traded near $89.43 while Brent moved above $95 as Middle East shipping risk lifted crude for a fifth session. Key levels, catalysts and invalidation.

Bitcoin slips to $65,741 as oil and yields test the breakout
Bitcoin is near $65,741 as rising oil and Treasury yields test the $65.7K breakout floor. Here are the levels that confirm or invalidate the move.

How Understanding Market Structure Saved My Binary Options Trading
I remember the exact moment my trading account hit zero for the third time in a single month. It was a rainy Tuesday evening, and I was staring at a 1-minute chart on my laptop screen. The price had been moving up aggressively. It looked like a flawless rocket ship to the moon. I clicked […]