KOSPI Corrects Hard but the 200 Day Line Still Holds
Where the index stands
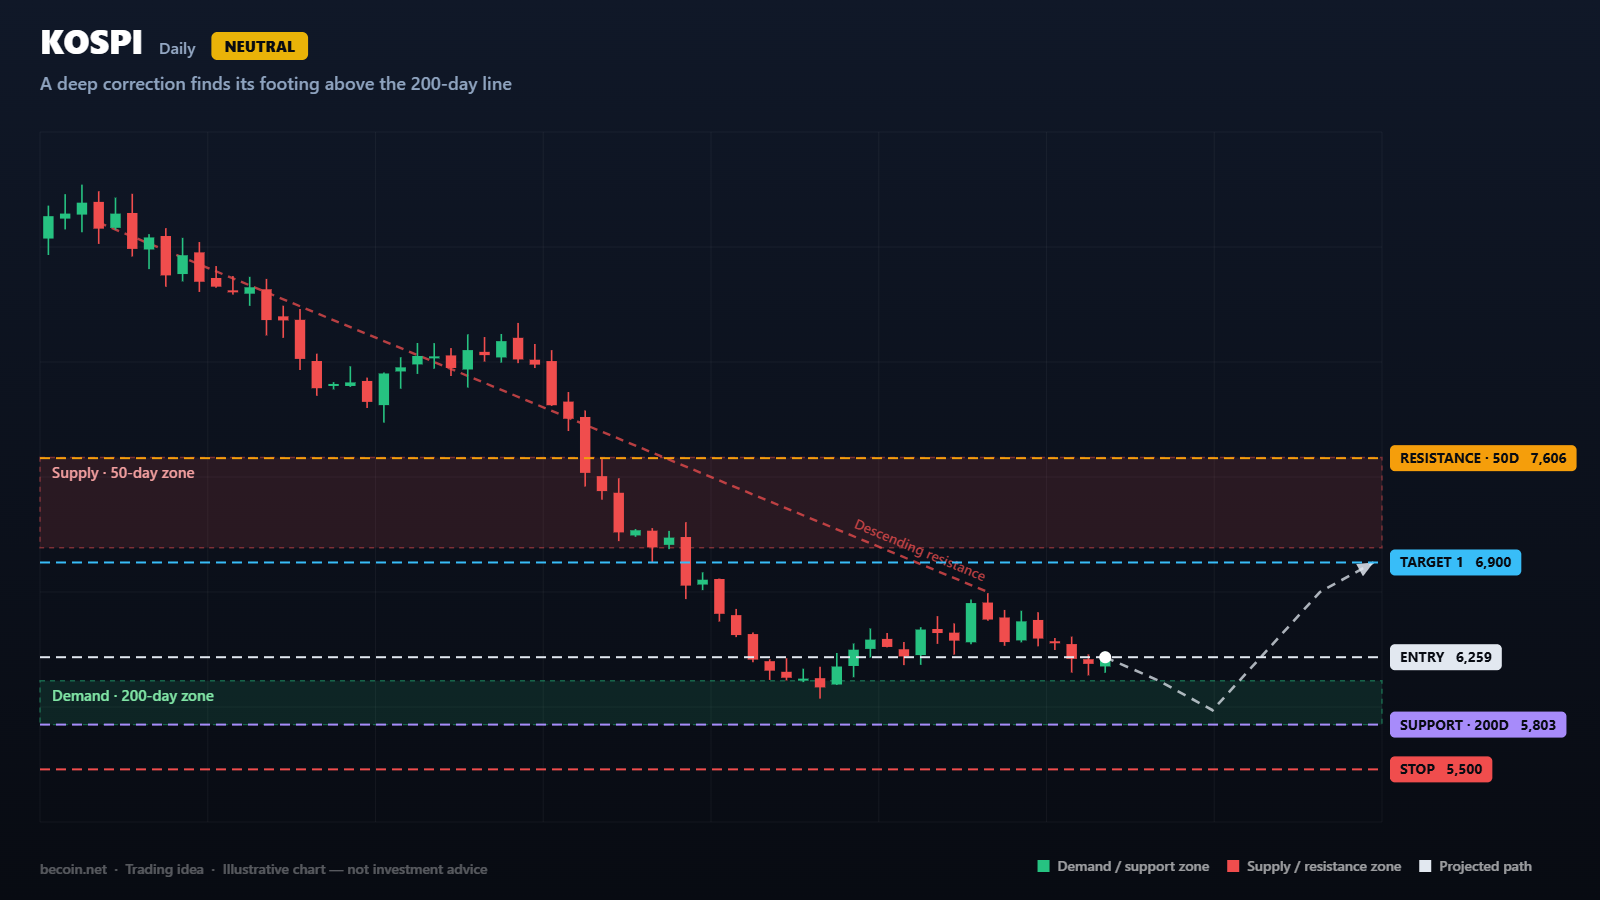
The KOSPI is trading around 6,259 after a severe correction from the 9,386 high. That is a decline of roughly a third, which by any definition is a bear market rather than a pullback. The 50-day average has rolled over hard and now sits far above the market at 7,606, while the 200-day average is still well below at 5,803. Between those two numbers is the entire argument about what happens next.
Momentum reflects the damage. The daily RSI near 43 shows a market that has stopped falling vertically but has not begun to recover either. It is the reading of an index in repair, and repair takes time.
What the chart is showing
The decline has followed a falling line drawn across the highs since the top, which now runs close to 6,700. Every attempt to rally has been capped by it, and the most recent bounce toward 6,500 was no exception. Until that line is broken on a closing basis, each rally is best treated as a selling opportunity rather than the start of a recovery.
Underneath, the 5,803 to 6,100 area is the zone that matters. The 200-day average sits inside it and the market has not closed below it during the entire correction. That is the single piece of evidence supporting the argument that this remains a correction within a larger uptrend rather than the beginning of something worse.
Levels that matter
Resistance is 6,900 first, then the 50-day average at 7,606. A close above 7,606 would be the first genuine sign that the correction is over.
Support is 5,803 at the 200-day, with 5,500 as the level that would invalidate the constructive read entirely. The 52-week low at 3,079 is a reminder of how far this index has travelled in both directions, and how little should be taken for granted.
How the idea could play out
There are two workable approaches and they point in opposite directions. The tactical one is to fade rallies into 6,700 to 6,900 with a stop above 7,000, targeting the 200-day area, which aligns with the trend still in force. The positional one is to accumulate into 5,803 to 6,100 with a stop below 5,500, targeting 6,900 and then 7,606, on the basis that the long-term average has held.
Both are defensible. What is not defensible is doing both at once, or buying in the middle of the range at 6,259 where the distance to support and resistance is roughly equal and neither side offers an edge.
What would invalidate it
A weekly close below 5,803, and particularly below 5,500, would mean the 200-day average has failed and the correction has become something more serious. On the other side, a close above 7,606 would end the bearish structure and turn pullbacks into buying opportunities again.
Managing the position
Korean equities are heavily weighted toward semiconductors and exporters, which makes the index unusually sensitive to global technology demand, the won, and trade policy. It often behaves more like a high-beta expression of the global tech cycle than a domestic story, and it can gap significantly on news that breaks while local markets are closed.
Given the size of the recent decline, position sizes here should be smaller than usual and stops wider than usual. Volatility of this magnitude punishes precision.
The bottom line
The KOSPI has taken serious damage, but the level that would confirm a structural breakdown has not been broken. That leaves a wide, well-defined range with clear edges and no edge in the middle. The patient trade is to wait for price to reach one of them.
Becoin.net Premium Forecast - Becoin.net Tariff Plan
This analysis is a technical study prepared for educational purposes. It is not investment advice, and no outcome described here is guaranteed. Trade only with capital you can afford to lose.

How Liquidity Affects Day Trading Results
When I first started trading day trading, I believed success was all about finding the perfect indicator. I spent weeks testing moving averages, RSI settings, support and resistance levels, and dozens of YouTube strategies that promised easy wins. Some worked for a few trades, but most failed. What confused me was that the same setup […]

The Clock and the Candle: How I Stopped Guessing the Best Time to Trade Day Trading
I still remember the night I blew my third trading account. It was 11:30 PM. The house was completely quiet, the market charts on my screen were barely crawling, and I was forcing trades out of pure impatience. I kept staring at a flatline asset, placing one-minute positions, convinced that the market owed me a […]

The Day I Lost My First Ten Dollars: My Hunt for the Best Mobile Trading App for Beginners
I still remember the exact shape of the cloud outside my window when my first live trade ended in the red. It was a crisp morning, and I was sitting on my couch with a lukewarm cup of coffee, staring at a flashing line on my smartphone screen. I had just deposited ten bucks, convinced […]

Is Capital Core Safe or a Scam? What Day Traders Should Know Before Depositing
I’ll be honest: the first time I landed on Capital Core, I didn’t feel excited. I felt suspicious. That might sound strange coming from someone who has spent years around day trading and offshore brokers, but if you’ve traded long enough, you know the pattern. A polished homepage. Big payout claims. A low minimum deposit. […]

EUR/USD holds 1.1414 before the ECB decision: three scenarios
EUR/USD traded near 1.1414 before the ECB’s July decision. Here is what a hold, hawkish hold or surprise hike could mean for 1.1350 and 1.1480.

WTI reaches $89.43 as Brent clears $95 on renewed supply risk
WTI traded near $89.43 while Brent moved above $95 as Middle East shipping risk lifted crude for a fifth session. Key levels, catalysts and invalidation.