How Trading Market Pullbacks Instead of Breakouts Saved My Account
I still remember the night my trading account took a hit that almost made me quit forever.
Bitcoin was consolidating right below a massive multi-month resistance level. Every indicator on my screen was flashing green. Twitter was screaming about an imminent moonshot, and live streams were showing huge buy orders popping up. I couldn't stand the thought of missing out. The moment the price ticked one dollar above resistance, I smashed the buy button with heavy leverage.
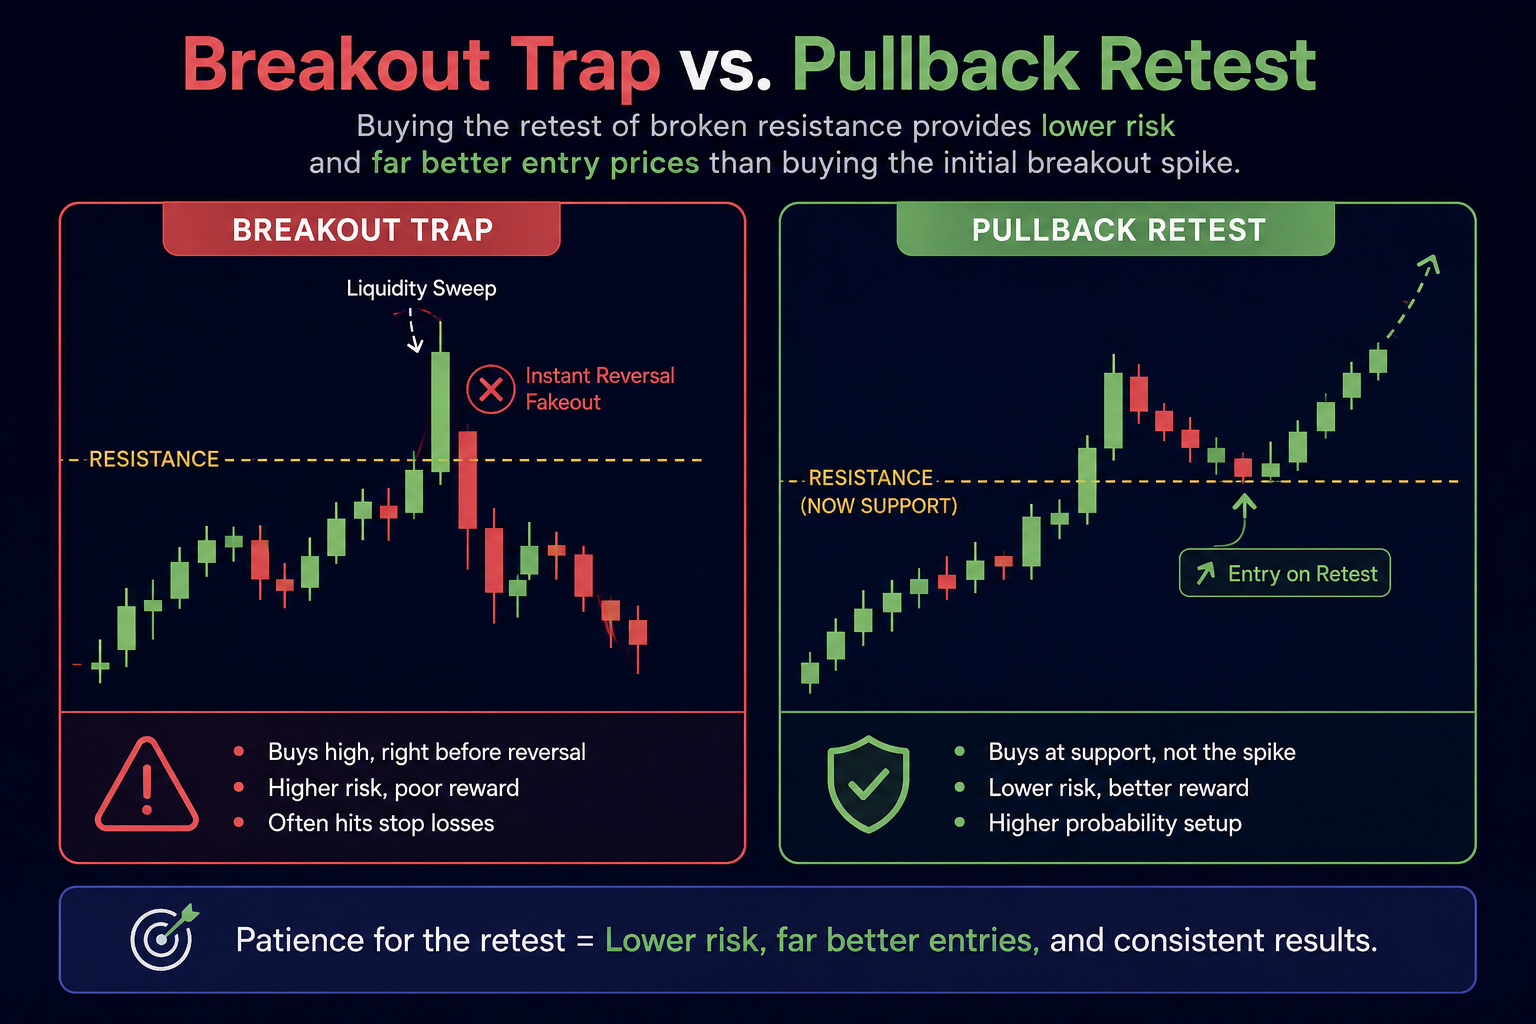
Within ninety seconds, the candle reversed. What I thought was the breakout of the year turned out to be a classic liquidity sweep. The price plunged back into the range, hit my stop-loss, and wiped out two months of hard-earned profits in less time than it takes to brew a cup of coffee.
That night was my turning point. I realized I was playing a game rigged against retail traders who chase momentum. Institutional players needed liquidity to fill their massive positions, and traders like me were handing it to them on a silver platter by buying high.
I decided to stop chasing breakouts and start trading market pullbacks instead. That single shift transformed my trading performance, improved my risk-to-reward ratio, and finally brought consistency to my balance sheet.
Here is exactly how I made that transition, why pullbacks consistently outperform breakouts, and how you can implement this approach in your daily routine.
Why Breakout Trading Fails Most Retail Traders
To understand why pullbacks work so well, you first have to understand why breakout trades fail so frequently.
When a market approaches a well-defined support or resistance level, retail traders cluster their orders around that zone. Buyers place breakout buy-stops right above resistance, while short-sellers place their stop-losses in the exact same area. This creates a dense pool of liquidity.
Institutional algorithms are programmed to push price into these liquidity pools to fill large orders. Once those buy orders are filled, the institutional buying pressure dries up. Without fresh capital to sustain the move, the price naturally collapses back into the previous consolidation zone.
When you buy a breakout, you face three distinct disadvantages:
- Poor Location: You are buying at the highest possible price point of a recent move, leaving zero safety margin.
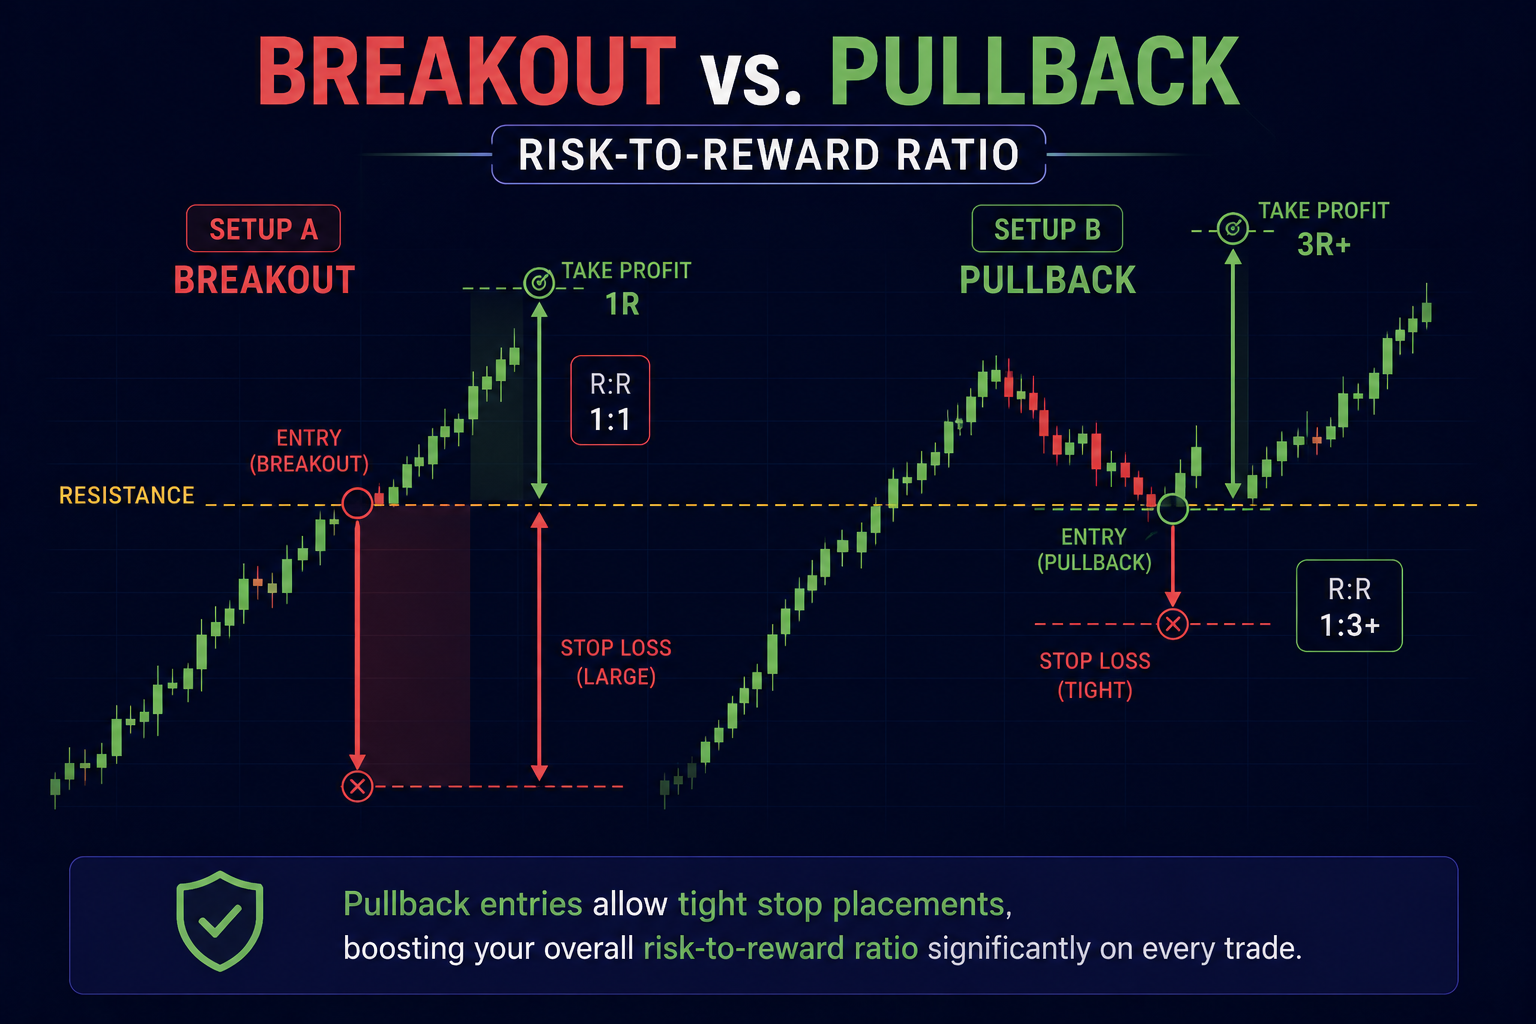
- Wide Stop-Losses: To avoid getting wicked out by noise, you have to place your stop-loss far below the breakout point, which ruins your risk-to-reward ratio.
- High Slippage: Market orders during high-volatility breakout spikes often get filled at terrible prices far above your intended entry.
When I shifted my focus to pullbacks, these disadvantages disappeared. Instead of buying when the price was exhausted, I began buying when the price returned to a discount area within an established trend.
The Mechanics of a Successful Pullback Strategy
A pullback occurs when price temporarily moves against the prevailing trend before resuming its original direction. It represents a pause, a moment where early buyers take profits and late traders get shaken out.
Trading pullbacks allows you to enter a trade with a tight stop-loss, clear structure, and favorable risk-to-reward dynamics. My goal is never to buy at the exact bottom of a pullback, but rather to enter at the point where the primary trend is most likely to reassert itself.
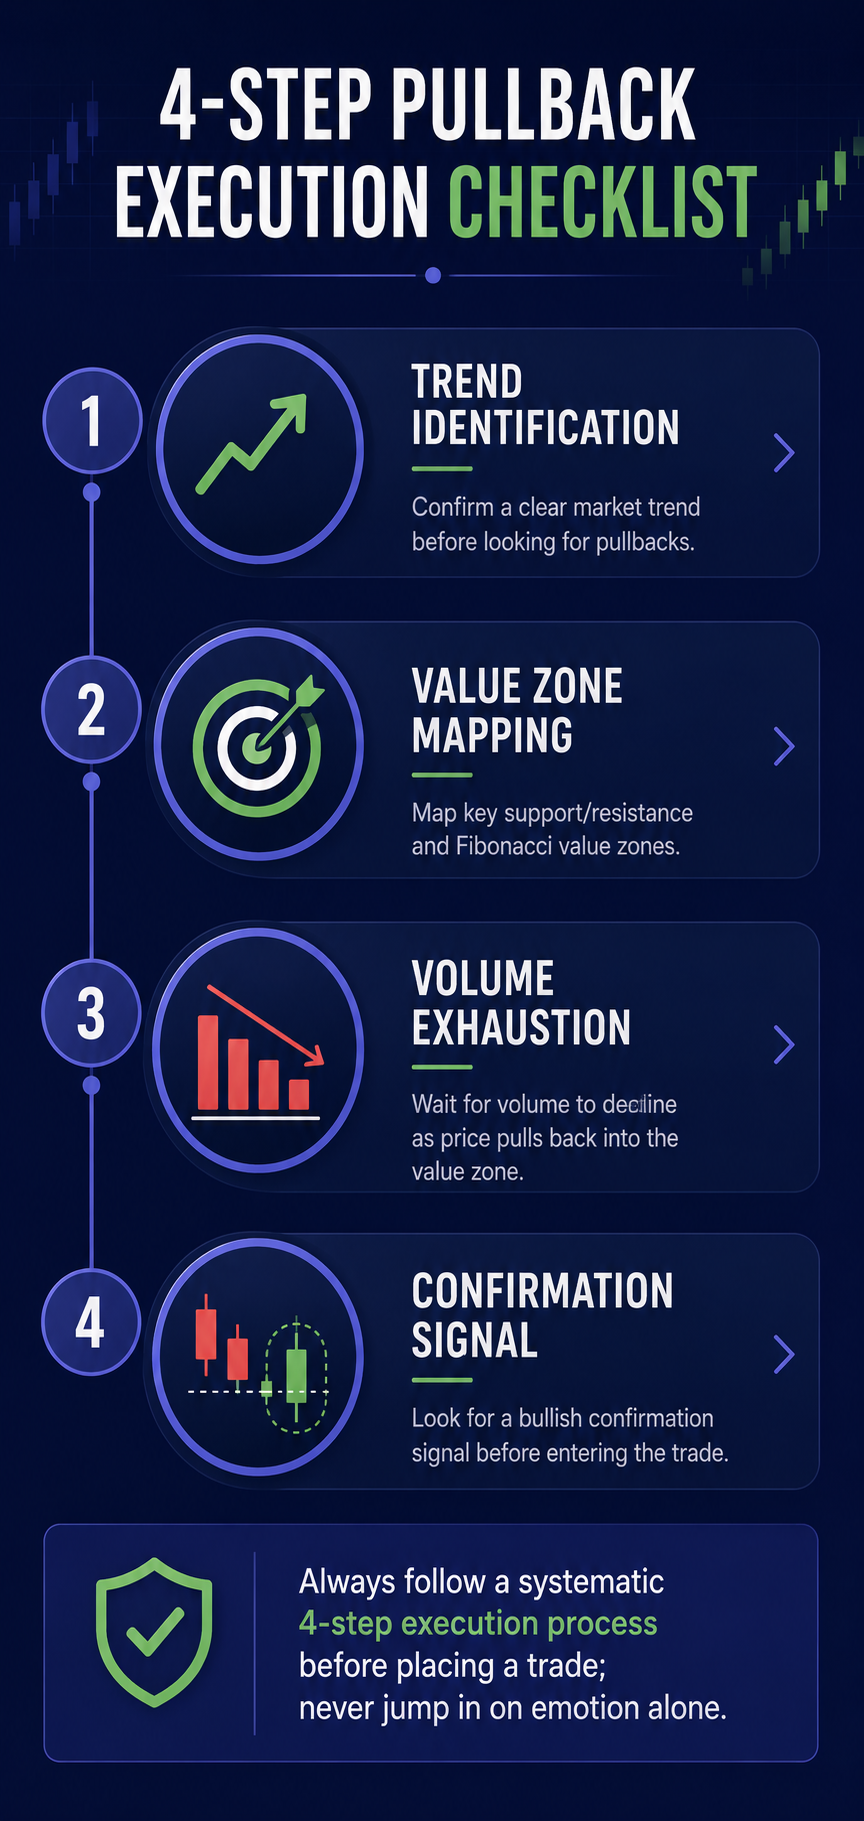
Here is the four-step blueprint I use every day to identify and trade high-probability pullbacks.
Step 1: Establish the Higher-Timeframe Trend
I never trade pullbacks on a flat or sideways market. A pullback is only valid if there is a clear, dominant trend on a higher timeframe, such as the 4-hour or Daily chart. I look for a clean structure of higher highs and higher lows for an uptrend, or lower highs and lower lows for a downtrend.
Step 2: Identify the Value Zone
Once a trend is confirmed, I mark out key areas where price is likely to pause during a retracement. My favorite value zones include:
- Previous Resistance Turned Support: Prior swing highs often become floor support on the retest.
- Dynamic Moving Averages: The 20-period and 50-period Exponential Moving Averages (EMAs) act as dynamic support levels in strong trends.
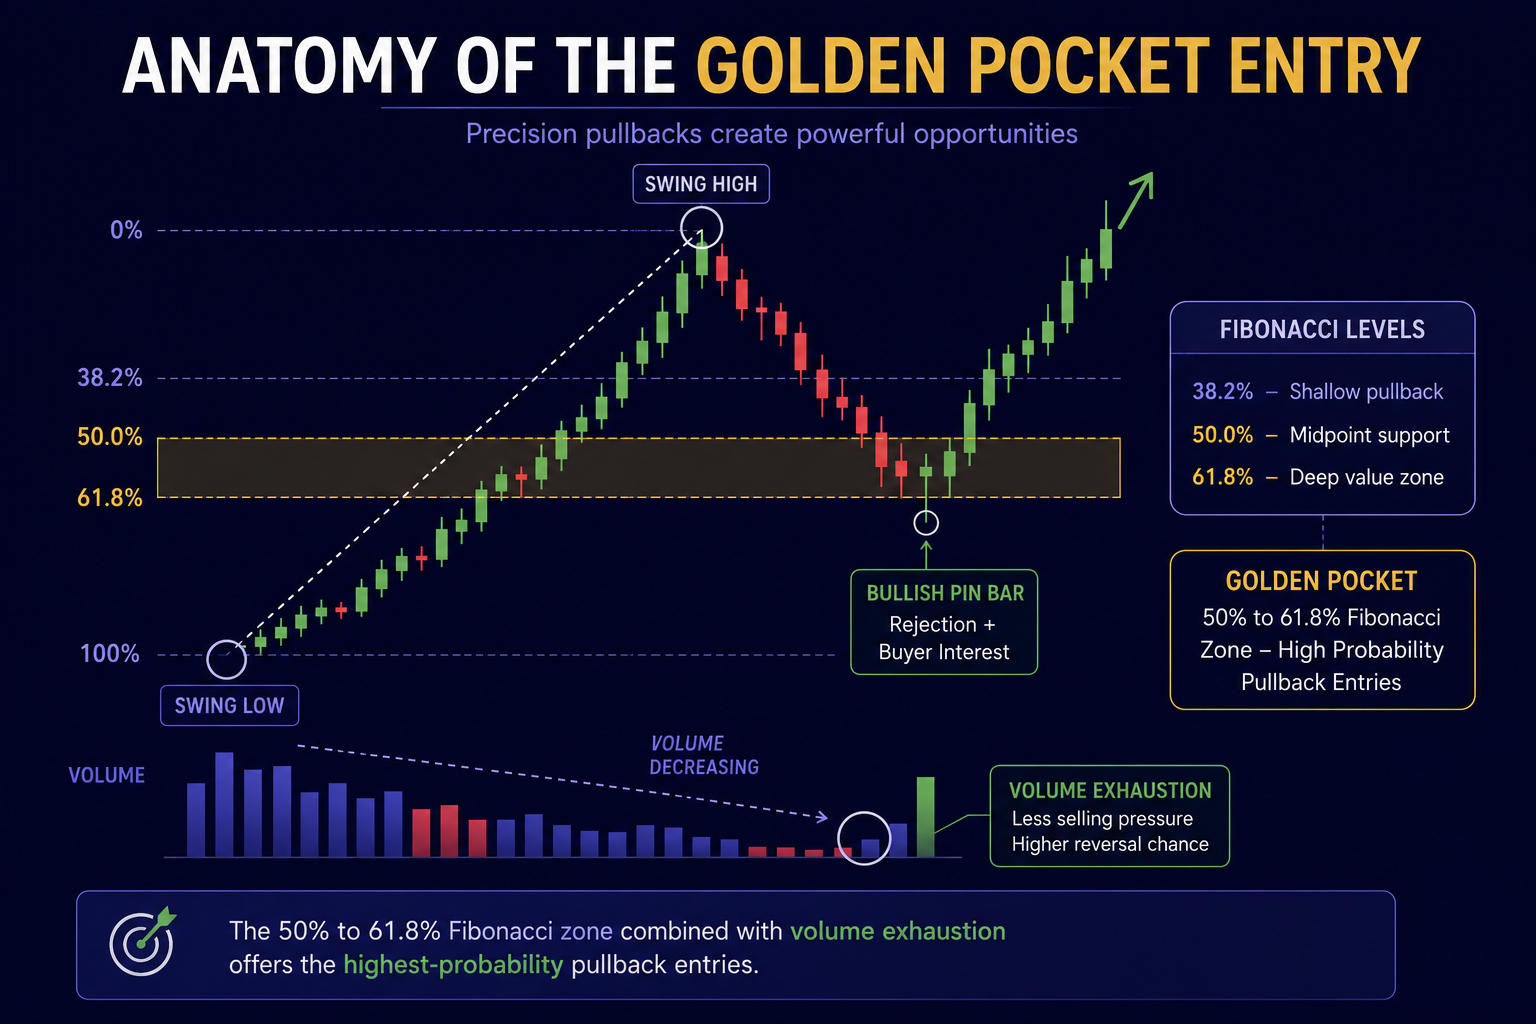
- Fibonacci Retracement Levels: The 50% and 61.8% Golden Pocket retracement zones consistently attract buyers.
Step 3: Wait for Liquidity Sweeps and Volume Exhaustion
As price retraces into my value zone, I watch how the candles behave. Is the selling pressure aggressive, or is volume drying up? I prefer to see decreasing volume during the retracement, which signals that sellers are losing momentum. I also look for lower-timeframe liquidity sweeps where price briefly dips below a minor swing low to clear out weak hands before reversing.
Step 4: Confirm with Lower-Timeframe Triggers
I never jump in blindly just because price reaches a support level. I drop down to the 15-minute or 1-hour chart and wait for a clear entry trigger:
- A bullish engulfing candlestick pattern.
- A long-tailed pin bar showing rejection of lower prices.
- A lower-timeframe Market Structure Shift (MSS), where price breaks above a recent minor swing high.
Choosing the Right Execution Platforms and Tools
When trading pullbacks, trade execution speed and clean charting tools are essential. You need platforms that offer smooth order fills, clear charting layouts, and reliable performance during volatile market retests.
Over the years, I have tested dozens of platforms to find the best environments for executing pullback strategies across foreign exchange, crypto, and derivatives:
- If you prefer fixed-time derivatives or day trading where precise timing on pullbacks is key, platforms like IQ Option offer intuitive charts and fast order execution.
- For traders looking for low minimum deposits and flexible contract types, Pocket Option and Quotex provide versatile WebTrader interfaces designed for fast-paced trading.
- If you want a straightforward account setup process and quick platform responsiveness, check out ExpertOption or explore the classic interface of Olymp Trade.
- Multi-asset traders seeking synthetic indices or traditional market access can rely on time-tested brokers like Deriv or explore modern trading features on Capital Core.
Regardless of which platform you choose, remember that tools are only as good as the risk management strategy behind them. If you want to dive deeper into how market structure affects your daily setups, read our detailed guide on understanding market structure shifts and explore our insights on effective risk management strategies to protect your trading capital.
Common Mistakes I Made While Learning to Trade Pullbacks
Transitioning from breakout trading to pullback trading was not without its hurdles. During my first few months, I made several costly mistakes that you should avoid:
Catching Falling Knives
In the beginning, I was so eager to buy at a discount that I jumped into trades while price was falling heavily. A pullback is not an invitation to buy blindly during a market crash. You must wait for price to stabilize and show clear signs of exhaustion or reversal before entering.
Confusing a Pullback with a Trend Reversal
Not every retracement is a healthy pullback. Sometimes, a pullback turns into a full-scale trend reversal. To protect myself, I pay close attention to key structural levels. If price breaks convincingly below the previous swing low in an uptrend, the bullish thesis is invalidated, and I exit immediately.
Over-fiddling with Timeframes
I used to panic whenever I saw small red candles on a 1-minute chart while waiting for a 4-hour pullback. Zooming in too far creates noise and leads to micro-managing your positions. Stick to your chosen execution timeframe and give your thesis room to play out.
If you are struggling with market discipline or finding it hard to identify key levels, learning how to master candlestick pattern recognition can dramatically improve your confidence when waiting for pullback triggers.
My Daily Trading Checklist for Pullbacks
To keep myself grounded, I follow a strict pre-trade checklist before entering any position:
- Is the higher-timeframe trend clearly defined? If the market is chopping sideways, I close my charts and walk away.
- Has price retraced into a key value zone? I only take trades that overlap with support/resistance, Fibonacci zones, or moving averages.
- Is there structural confirmation on a lower timeframe? I wait for a pin bar, engulfing candle, or market structure shift before placing an order.
- Is my risk-to-reward ratio at least 1:2? If my stop-loss needs to be wider than my potential profit target, I pass on the trade.
- Am I risking no more than 1-2% of my account? Position sizing is the ultimate defense against unexpected market spikes.
Final Thoughts: How to Gain a Lasting Edge
Switching from trading breakouts to trading pullbacks was the single best decision of my trading career. It allowed me to move away from the stress of chasing volatile market spikes and taught me the patience required to buy value at a discount.
Trading is not about predicting the future with 100% accuracy. It is about stacking high-probability factors in your favor and managing risk disciplined manner on every single trade.
If you want to fast-track your trading journey, stop guessing where the market is going next. Get access to professional market commentary, high-probability trade setups, and real-time analytical reports through the BeCoin Forecast Hub.
To truly gain a competitive edge in today's dynamic markets, upgrade your strategy by joining the elite trading community with a subscription to the BeCoin Premium Tariff Plan. Gain access to in-depth analysis, institutional order flow insights, and expert trade breakdowns designed to help you master pullbacks and trade with confidence.

Deriv Volatility 75 Strategy Backtest: What Actually Works After 1,000 Trades?
The first time I tried trading Volatility 75, I thought I had found the perfect market. No news shocks. No central banks. Just clean, continuous price movement. Within two weeks, I blew my first account. That experience forced me to stop guessing and start testing. Instead of chasing indicators or copying strategies from forums, I […]

How Understanding Market Structure Saved My Day Trading
I remember the exact moment my trading account hit zero for the third time in a single month. It was a rainy Tuesday evening, and I was staring at a 1-minute chart on my laptop screen. The price had been moving up aggressively. It looked like a flawless rocket ship to the moon. I clicked […]

Deriv vs Binomo Deposit Methods: My 2026 Real Money Comparison Guide
I sat in the corner of a crowded coffee shop, my eyes fixed on my phone screen. After months of testing strategies on a demo account, I had finally saved up a small pocket of risk capital. I felt ready to trade live. A high-probability setup was forming on my charts, and my heart rate […]

I Started with $10 on Quotex – Day 1 Results (Real Case Study)
Most beginner traders ask the same question:Can you actually grow a small account like $10? Instead of theory, I decided to test it in real conditions. This is a Day 1 case study of trading with $10 on Quotex, documenting everything from setup to execution, mistakes, emotions, and actual results. No hype, no fake screenshots, […]

Trading Currency Strength Instead of Single Pairs
It was a Tuesday afternoon when I realized I was fighting a losing battle against a ghost. My screen was a chaotic web of indicators. I had the EUR/USD chart open, a moving average crossing over here, a relative strength index flashing oversold there, and a price action setup that looked textbook perfect. I clicked […]

The Clock and the Cash: My Journey into the Hidden Rhythm of Session-Based Trading
There was a time when I thought the global financial market was a single, monstrous wave that never stopped moving. I believed that if I sat in front of my monitors long enough, clicking buttons whenever a pretty pattern appeared on my charts, the market would eventually reward my sheer endurance. I was dead wrong. […]