
How 5-Stage Weekly Review Transformed My Trading
Three years ago, my Fridays always ended the exact same way. I would sit in front of my dual monitors, staring at a negative P&L balance, nursing a headache that no amount of coffee could fix. During the week, I was trading fast, taking quick setups, jumping between fast day trading on platforms like IQ Option and high-speed execution tools on Binomo. Yet, despite working ten hours a day, my account was bleeding out.
The turning point was painfully simple. I wasn't losing because my technical indicators failed or because the market was "rigged." I was losing because I had no feedback loop. I was placing dozens of trades every week, closing them, and immediately looking for the next shiny opportunity without understanding what actually happened.
That realization forced me to build a systematic, repeatable weekend audit routine. Over time, this evolved into my complete weekly trading review framework. It took me from a stressed retail trader making emotional mistakes to someone who actually understands their statistical edge.
Here is the exact step-by-step audit framework I use every single weekend to review performance, clean up operational leaks, and prepare for the upcoming trading week.
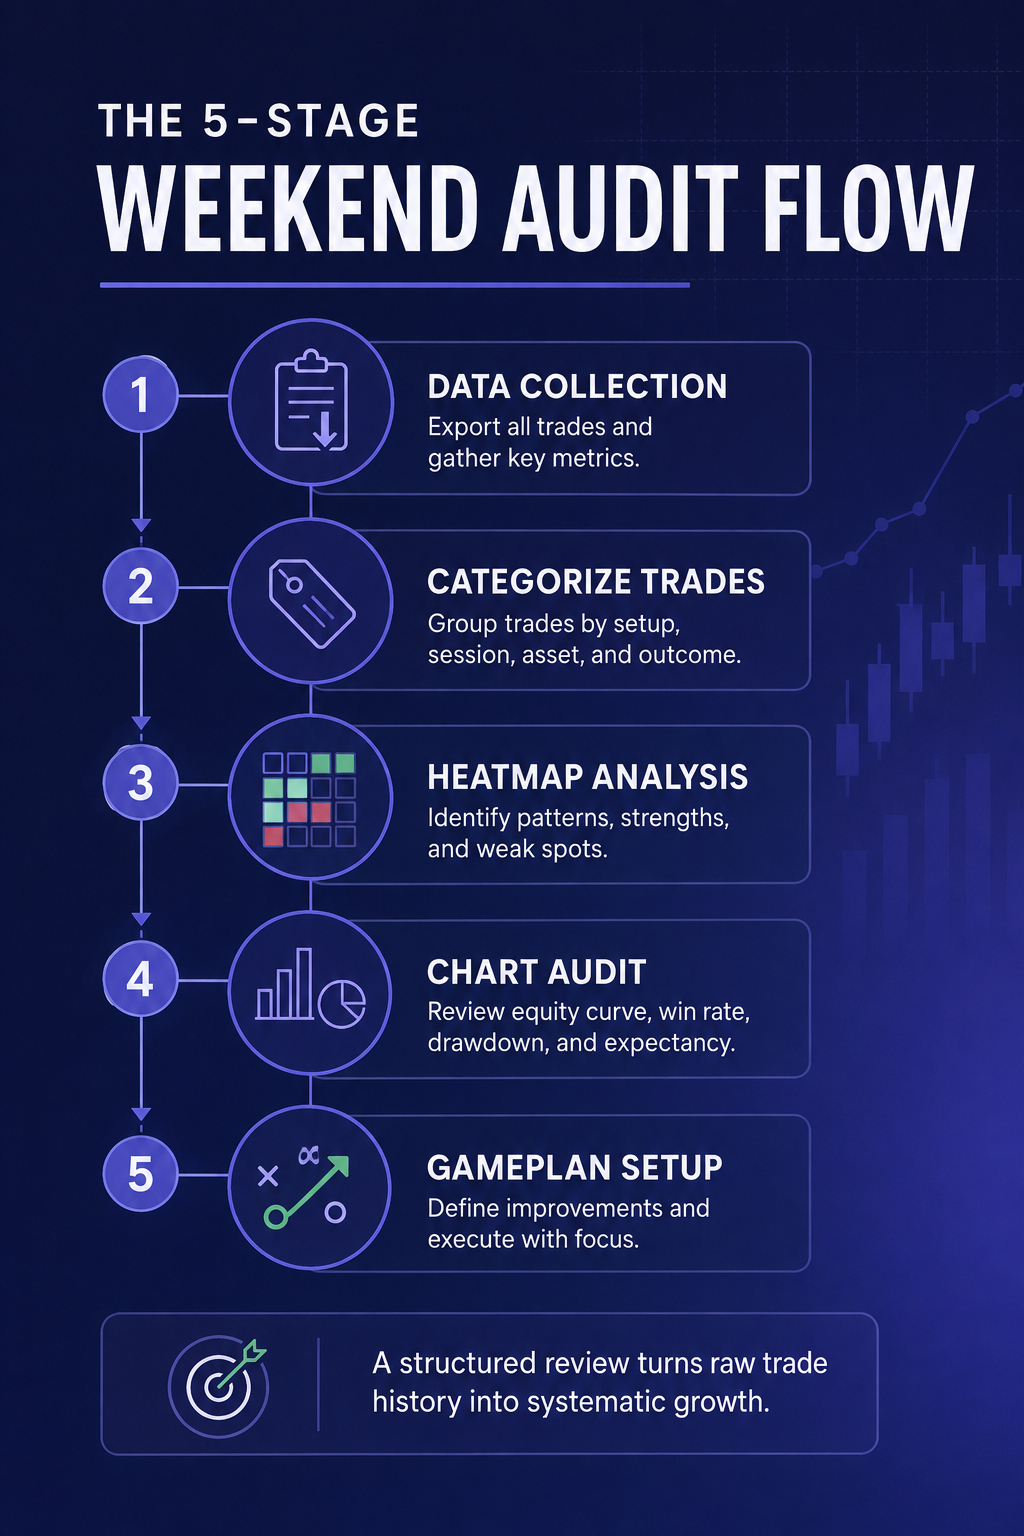
Step 1: Data Extraction and Raw Performance Metrics
When the markets close on Friday night, step away from your charts. Trying to review trades immediately after the final bell is a mistake because your emotions are still running high. I do my reviews on Saturday afternoon when my head is completely clear.
Start by exporting your raw trading logs into a spreadsheet or logging software. If you trade short-term assets or fast setups on brokers like Quotex or Pocket Option, your history tab will give you exact timestamps, payout metrics, and asset splits.
Key Metrics to Track
- Net P&L & Return on Capital: Total monetary and percentage gain/loss for the week.
- Win Rate vs. Payout Ratio: Calculate your win percentage against the average payout or risk-to-reward ratio. To dive deeper into the math behind this relationship, check out our guide on how to calculate your real edge in day trading.
- Asset Distribution: How many trades did you take in Forex, Crypto, or Equity Indices? Are you over-trading a specific asset class?
- Platform Execution Split: Track performance across individual accounts, whether you are utilizing high-speed execution on ExpertOption, short-duration positions on Olymp Trade, or spot holdings via CapitalCore.
Grouping your numbers this way separates feelings from facts. You might feel like you had a terrible week, only to realize that 80% of your losses came from a single hour of impulse trading on a Wednesday.
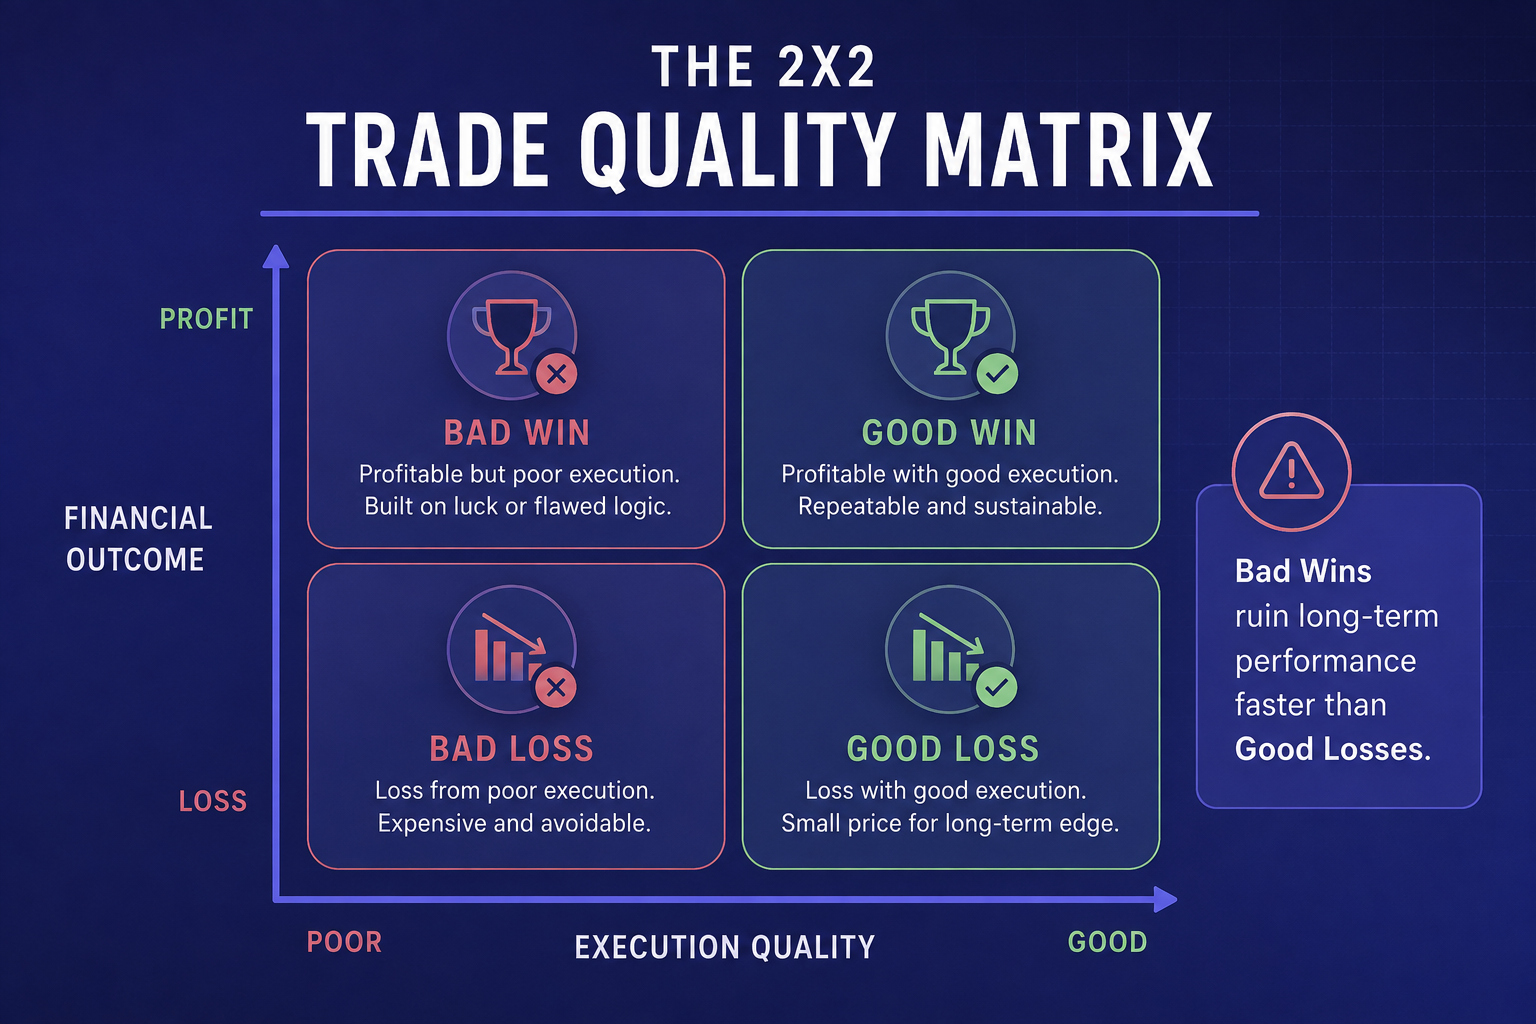
Step 2: Categorizing Your Execution Quality
The biggest secret in professional trading is that a losing trade is not necessarily a bad trade, and a winning trade is not necessarily a good trade.
To turn your trade log into real actionable insights, categorize every single closed order from the week into one of four buckets:
- Good Win: Executed according to your written plan, respected risk limits, resulted in profit.
- Bad Win: Violated your rules (e.g., FOMO entry, moving stop loss), but you got lucky and made money. (These are dangerous because they reinforce bad habits).
- Good Loss: Followed your strategy precisely, hit your defined stop loss, resulting in a controlled loss.
- Bad Loss: Revenge traded, over-leveraged, or ignored your setup triggers, resulting in a loss.
Your primary goal week after week is not to eliminate "Good Losses"—those are just the standard cost of doing business. Your true objective is to systematically eliminate "Bad Wins" and "Bad Losses."
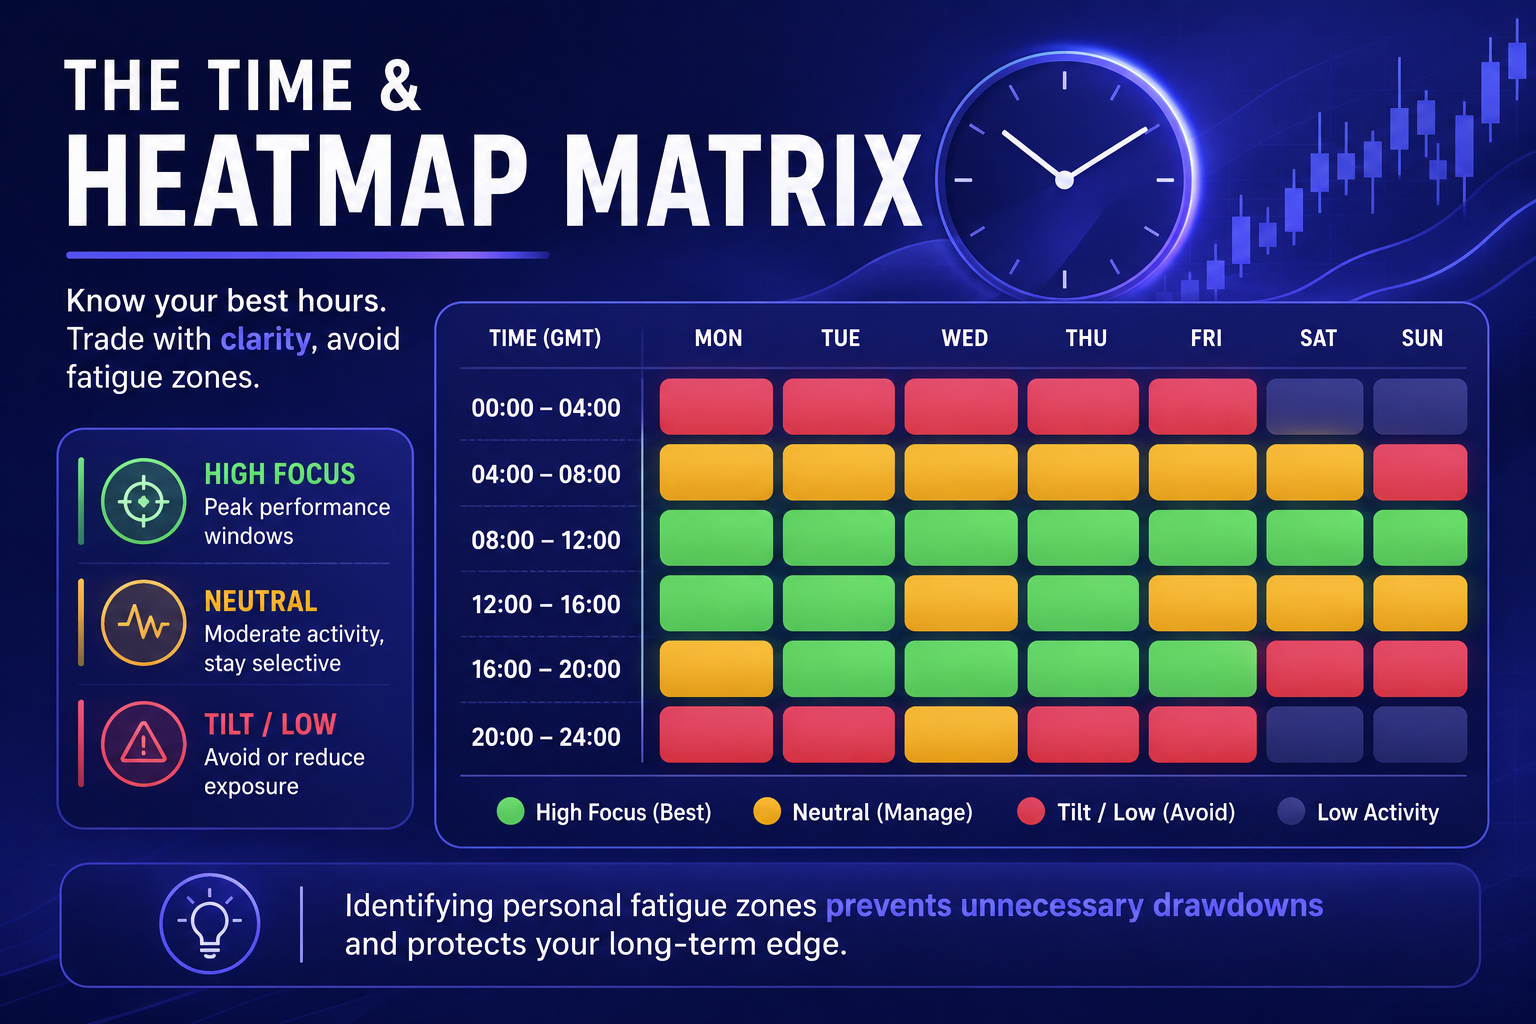
Step 3: Heatmap Analysis (Timing and Emotional Triggers)
Once I started mapping my trades on a grid, I discovered something shocking: I was losing nearly 70% of all trades taken between 1:00 PM and 3:00 PM EST. Why? Because that was my post-lunch lull, a time when I felt bored and forced trades out of thin air.
Look at your trade timestamps across three dimensions:
- Time of Day: Are you forcing entries during low-volume sessions?
- Day of the Week: Do you consistently blow profits on "Frantic Fridays"?
- Session Transitions: How do you handle high volatility during market opens, such as the US session opening bell?
If you struggle with choosing between fast technical indicators and pure price action during volatile session opens, read our breakdown on Price Action vs Indicators: Which Actually Works? to refine your entry timing.
Step 4: Macro Context and Technical Setup Audit
Now, pull up the charts and overlay your actual entry and exit arrows onto the higher timeframe charts.
Ask yourself these critical questions for every setup:
- Did I trade with the dominant trend? Were you trying to pick tops in a raging bull market, or were you aligned with the multi-day direction?
- Was market liquidity available? Did you execute right in front of major high-impact economic news releases without accounting for slippage or rapid spread widening?
- Did I respect my predefined risk parameters?
When I do this, I like to compare my manual execution against automated, systematic market baselines. Studying structured forecast models—like my personal multi-step process outlined in My Complete BTC Analysis Process—helps strip away subjective bias and highlights where trade execution deviated from plan.
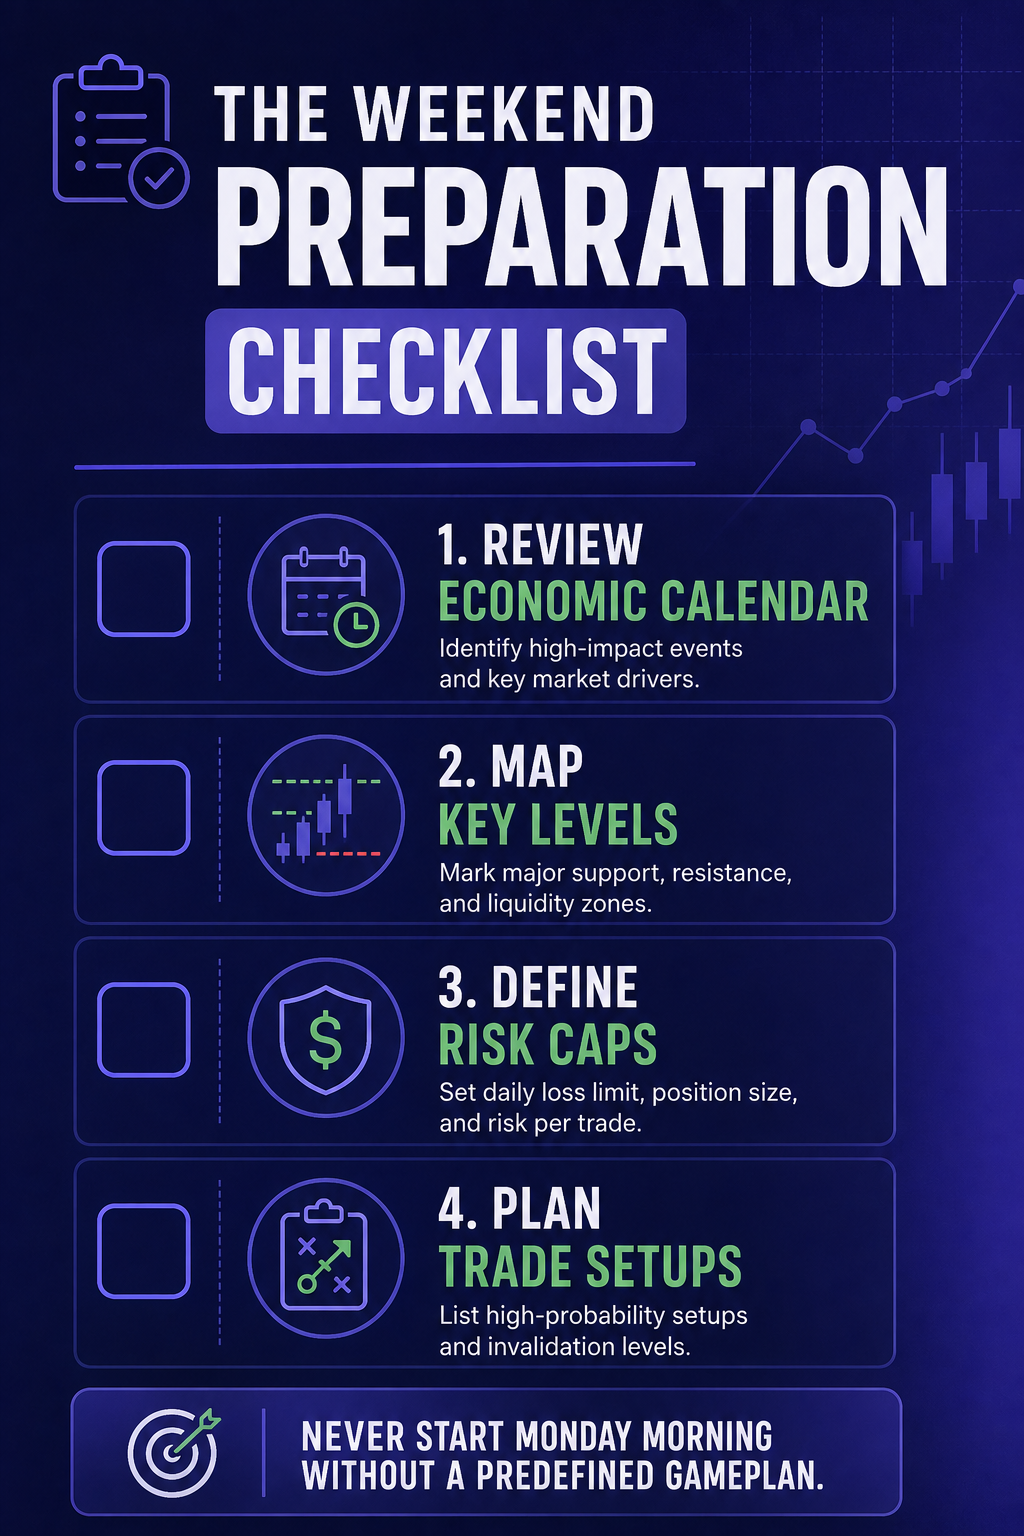
Step 5: Constructing the Actionable Playbook for Next Week
A review without a forward-looking action plan is just active journaling. The final step of the weekly framework is building a clean, simple game plan for the upcoming session.
Write down no more than three targeted adjustments for the coming week. Keeping this list small ensures you actually execute on it.
Example Actionable Adjustments:
- "I will limit my daily maximum loss threshold to 2% of total capital."
- "I will refrain from taking short positions on assets trading above their 200-period moving average on the 1-hour chart."
- "I will cap my trading window to the first 2 hours of the London and New York overlaps."
Gaining a True Edge in Today's Markets
Mastering your weekly trading review framework is the single most effective way to eliminate emotional tilt, tighten up risk management, and build a consistent trading record over time. But conducting deep technical reviews, mapping out macro sentiment, and calculating probability metrics across multiple markets every week takes significant time and technical resources.
If you want to accelerate this process and stop guessing what the markets will do next, you need institutional-grade insights backing up your trading plan.
Upgrade your market analysis today with BeCoin Premium Pricing Plans to unlock advanced, data-driven forecasts. To see how real-time probability models and algorithmic insights can instantly transform your setup selection and weekly planning, explore our live market analysis on the BeCoin Forecast Hub. Give yourself a undeniable edge every single week!

Deriv vs IQ Option for Beginners in 2026: Which Platform Is Better to Start With?
Choosing your first trading platform can decide whether you stay consistent or quit after blowing your first account. Most beginners do not fail because trading is impossible. They fail because they start on platforms that confuse them, encourage emotional trading, or make risk management difficult. Two names that often appear in beginner discussions are Deriv […]

Simple Daily Trading Routine for Consistency
Most traders do not fail because of strategy alone. They fail because they are random. They trade when emotional, skip planning, increase risk after losses, and ignore review sessions. Consistency in trading usually comes from routine more than prediction. A simple daily trading routine helps you stay disciplined, reduce emotional mistakes, and improve decision making […]

Biggest Beginner Mistakes That Kill Trading Accounts
Trading looks simple from the outside. Open an account, place a few trades, and grow your balance. But reality is different. Most beginners do not lose because markets are impossible. They lose because they repeat the same avoidable mistakes. A small account can survive bad market conditions. What usually kills it is poor decision-making, emotional […]

Capital Core Withdrawal Test: How Long Does It Really Take to Get Paid?
If you are thinking about using Capital Core, ignore the flashy payout claims for a minute. The only thing that really matters is whether the broker pays you when you request a withdrawal. That was the exact reason I decided to test it for myself. I wasn’t interested in another recycled broker review built around […]

How Understanding Market Structure Saved My Day Trading
I remember the exact moment my trading account hit zero for the third time in a single month. It was a rainy Tuesday evening, and I was staring at a 1-minute chart on my laptop screen. The price had been moving up aggressively. It looked like a flawless rocket ship to the moon. I clicked […]