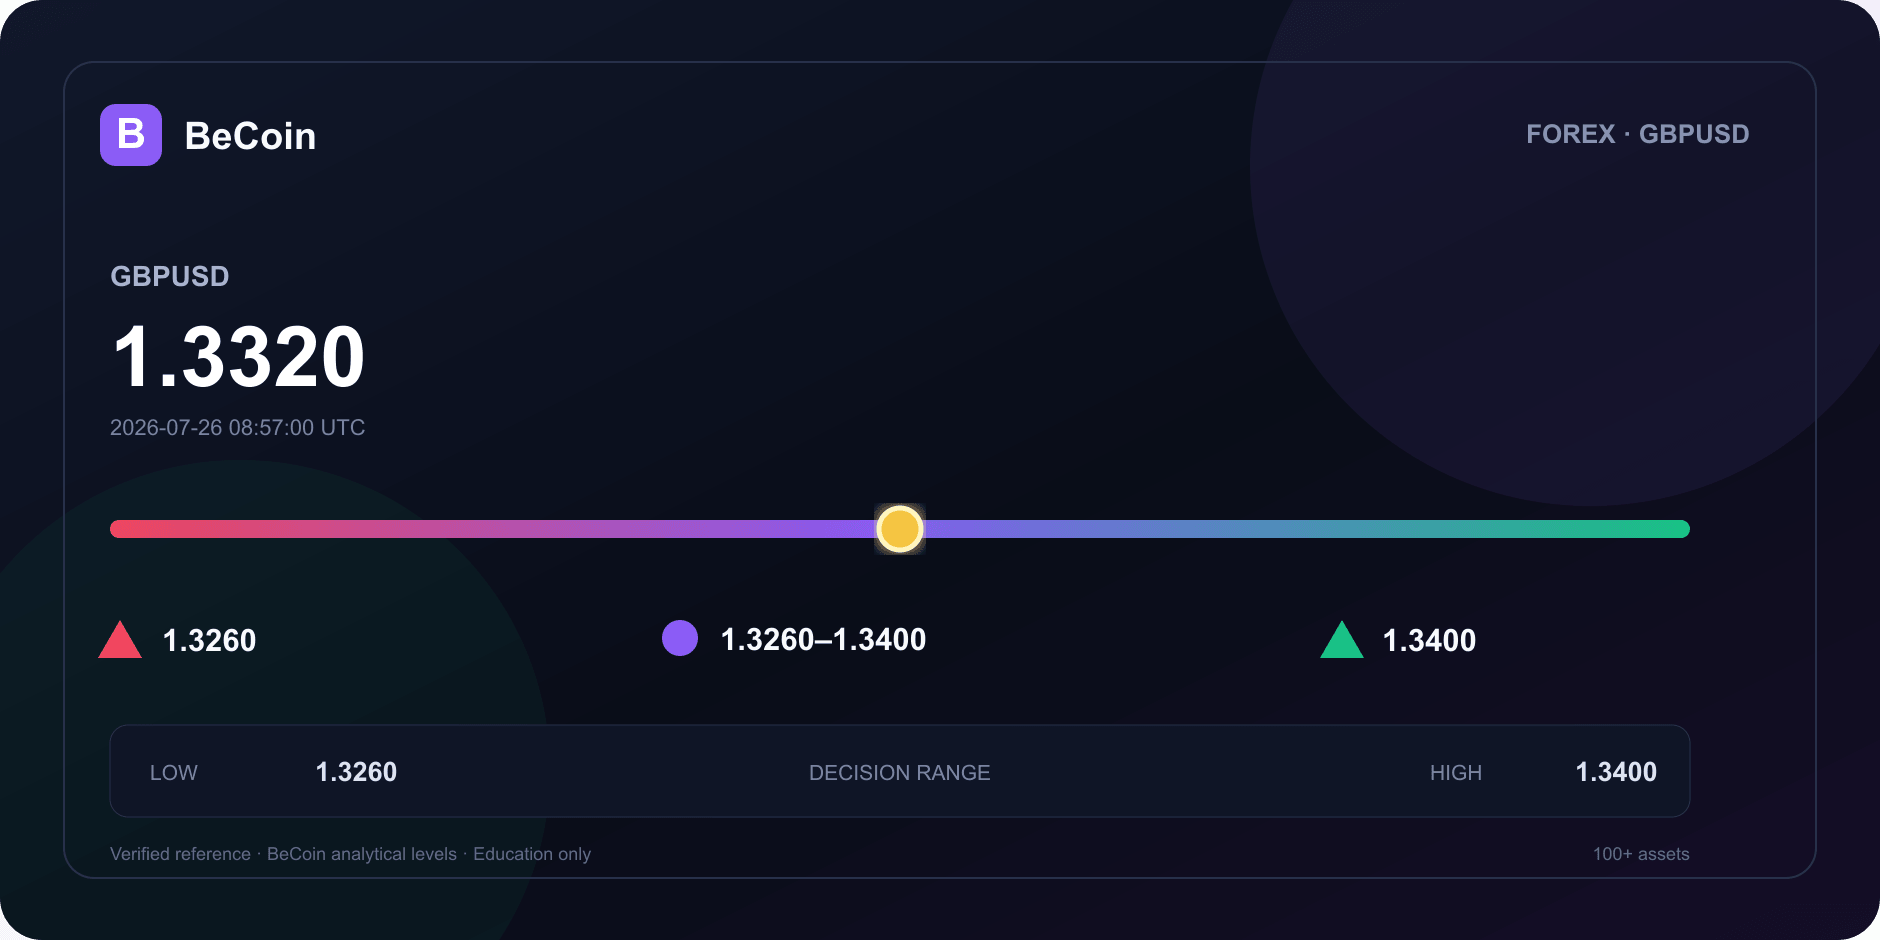
GBP/USD holds near 1.3320 as traders map the next weekly range
# GBP/USD holds near 1.3320 as traders map the next weekly range
GBP/USD is currently positioned at 1.3320, reflecting a slight decline of 0.03% according to Google Finance data. This level serves as a verified reference point for traders as they assess potential movements within the established weekly range of 1.3260 to 1.3400.
Why it matters
The GBP/USD currency pair is a critical indicator in the Forex market, representing the value of the British pound against the US dollar. Understanding its movements is essential for traders and investors alike, as it can influence broader market trends and economic forecasts. The current positioning near 1.3320 highlights the ongoing market debate regarding the direction of the pair, particularly in light of recent monetary policy discussions from the Bank of England.
Technical and market context
The established range for GBP/USD is between 1.3260 and 1.3400. The upper boundary at 1.3400 may indicate a bullish scenario, while the lower boundary at 1.3260 could suggest a bearish outlook. Recent TradingView material has provided mixed opinions, combining a long GBP/USD setup with commentary on broader market consolidation. One specific discussion regarding GBP/JPY was deemed irrelevant, emphasizing the need for focused analysis on GBP/USD itself. The market remains attentive to these technical levels as they may influence trading strategies moving forward.
BeCoin forecast read
The BeCoin analysis indicates that the GBP/USD pair may experience fluctuations within the defined range. In a bullish scenario, if the price breaks above 1.3400, it could signal a stronger upward trend, potentially attracting more buyers. Conversely, if the price dips below 1.3260, it may trigger a bearish sentiment, prompting traders to reassess their positions. The market debate continues as participants weigh these scenarios against the backdrop of economic indicators and central bank policies.
Methodology and sources
This analysis is based on data from Google Finance, which displayed the GBP/USD at 1.3320 as of July 26, 2026. The range levels of 1.3260 to 1.3400 are derived from BeCoin's analytical framework rather than specific price targets. Additional insights were gathered from TradingView, where various opinions on GBP/USD were discussed. For further details on monetary policy, the Bank of England's official summary can be accessed here.
Related market analysis · Related BeCoin tool
Google Finance quote · TradingView ideas
| Evidence field | Value |
|---|---|
| Verified reference | 1.3320 |
| Source time | 2026-07-26 08:57:00 UTC |
| Base range | 1.3260–1.3400 |
| Bull confirmation | 1.3400 |
| Bear confirmation | 1.3260 |
This content is for education only and is not financial advice.

EUR/USD holds 1.1414 before the ECB decision: three scenarios
EUR/USD traded near 1.1414 before the ECB’s July decision. Here is what a hold, hawkish hold or surprise hike could mean for 1.1350 and 1.1480.

Bitcoin slips to $65,741 as oil and yields test the breakout
Bitcoin is near $65,741 as rising oil and Treasury yields test the $65.7K breakout floor. Here are the levels that confirm or invalidate the move.

The Clock and the Cash: My Journey into the Hidden Rhythm of Session-Based Trading
There was a time when I thought the global financial market was a single, monstrous wave that never stopped moving. I believed that if I sat in front of my monitors long enough, clicking buttons whenever a pretty pattern appeared on my charts, the market would eventually reward my sheer endurance. I was dead wrong. […]

Finding My Perfect Workspace: The Search for the Best Broker for My Daily Trading Routine
The alarm goes off at 6:00 AM. By 6:30 AM, I am sitting in front of my monitors with a steaming mug of black coffee. The house is completely quiet, the market is preparing its next major move, and my charts are completely bare. This is my daily sanctuary. For a long time, this morning […]

Deriv vs IQ Option for Synthetic Indices: Which Platform Is Better in 2026?
Synthetic indices have become one of the most talked about trading categories among beginners and experienced traders alike. Unlike forex or crypto markets that depend on real world events, synthetic indices operate 24/7 using algorithm driven price movements. That means traders can access opportunities at any time without waiting for market openings or major news […]
Why Most Deriv Traders Blow Accounts: A Data-Driven Post-Mortem Analysis
The first time I blew a trading account on Deriv, it didn’t happen dramatically. There was no single catastrophic trade. It happened quietly. One loss turned into another. Then I increased the stake to recover the loss. Then the market moved again. Before I realized what had happened, an account balance that took weeks to […]