Fake Breakouts: How to Spot Them Early
I still remember the exact trade that broke my spirit. It was a Tuesday morning. I had been staring at a cleanly defined resistance level on the chart for two days. The price had tested that boundary three separate times, coiling tightly like a compressed spring.
When a giant green candlestick finally sliced through the line, my heart spiked with adrenaline. This was it. The massive breakout everyone in the trading forums talked about.
I slammed the buy button without hesitation. Within two minutes, the candle stalled. Within five minutes, a long wick formed at the top. Ten minutes later, a violent red engulfing candle crashed right back down into the previous range, wiping out my stop loss and leaving me sitting in silence, staring at a red loss column.
If you have spent any time trading forex, crypto, or day trading, you know this pain intimately. It is called a fake breakout or a bull trap, and it is responsible for destroying more trading accounts than almost any other chart phenomenon.
For months, I thought I was just unlucky. I thought the market makers were specifically hunting my stop loss. But once I pulled back the curtain and studied market structure, I realized something fundamental: fake breakouts are not random chaos. They are structured liquidity events, and once you learn how to read the subtle clues leading up to them, you can stop falling for the trap and start trading alongside the smart money.
Here is the exact framework I used to escape the breakout trap, spot fake moves before they happen, and protect my trading capital.
What Actually Causes a Fake Breakout?
To spot a fake breakout early, you have to understand why they happen in the first place.
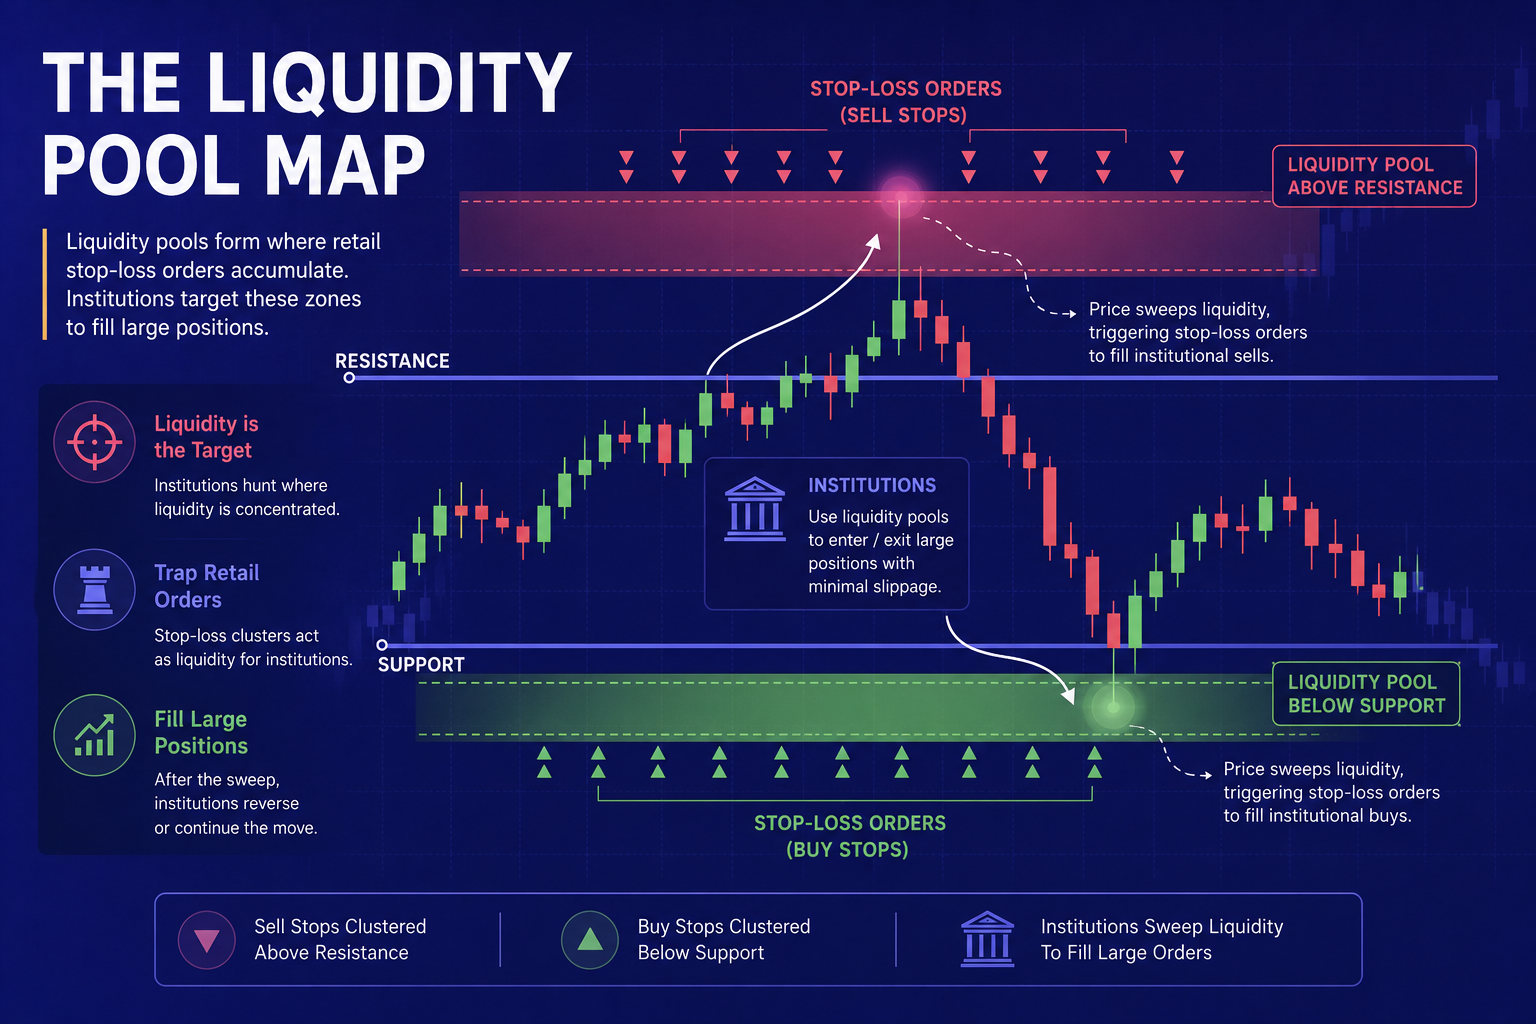
Retail traders tend to view support and resistance levels as rigid walls. Institutional traders and liquidity algorithms view those exact same levels as pools of money.
When price approaches a major resistance level, two massive clusters of orders sit just above that line:
- Buy Stop orders from breakout traders waiting to buy as soon as the price crosses the line.
- Stop Loss orders from short sellers who are protecting their positions.
Both of these order types represent buying pressure. Big institutional players cannot simply buy millions of dollars worth of an asset whenever they want without driving the price up against themselves. They need a massive pool of opposing sell liquidity.
To create that liquidity, they push the price just far enough above the resistance line to trigger all those buy stops and short stop losses. Once that flood of buy orders fills the institutions' massive sell orders, the big players aggressively push the price back down.
The retail breakout traders are left holding the bag right at the top of the move.
4 Visual Clues to Spot a Fake Out Before It Traps You
When I started analyzing my losing trades, I noticed that almost every failed breakout dropped subtle hints before the reversal occurred. Here are the four key indicators you must watch.
1. The Low-Volume Expansion
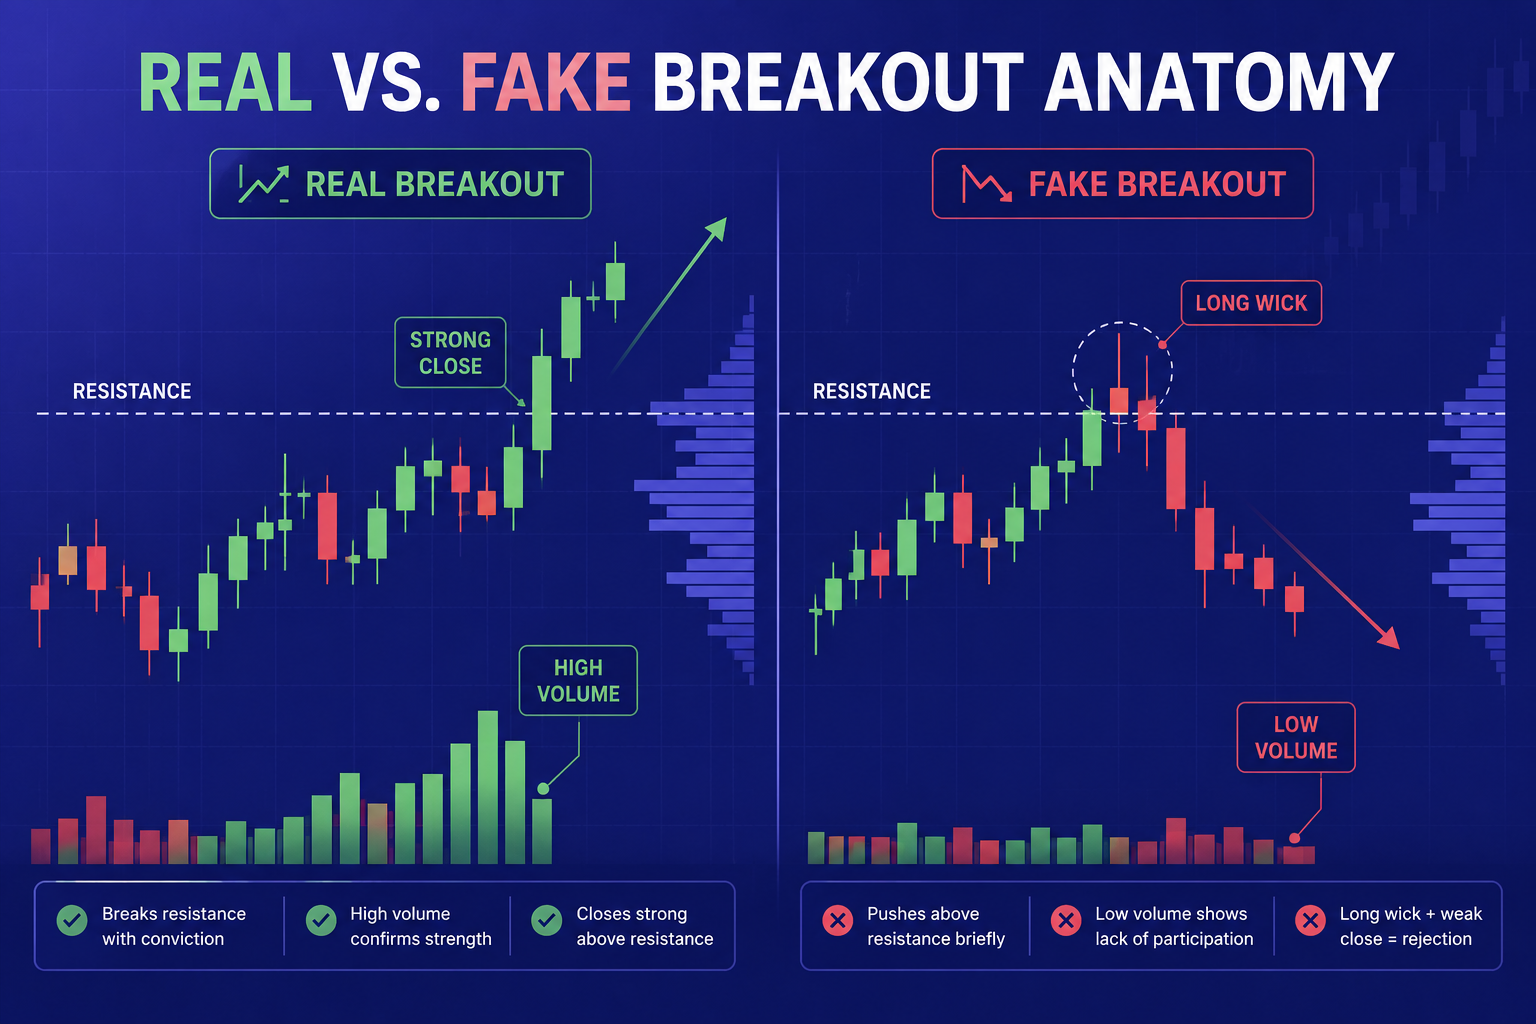
True breakouts require aggressive, sustained participation from major market players. When price pierces a key level, you want to see a noticeable expansion in volume.
If the price pushes past resistance on average or declining volume, it means big institutional money is not backing the move. It is merely retail traders driving the price on thin air. As soon as that retail buying power dries up, the price collapses.
2. The Exhaustion Wick
Pay close attention to how the candle closes relative to its high. A legitimate breakout candle usually closes near its extreme high, showing that buyers maintained control all the way to the bell.
If a candle shoots above resistance but leaves a long upper shadow or wick, closing near or below the breakout level, it indicates immediate selling pressure. That wick is the visual footprint of institutional supply overwhelming retail demand.
3. Extended Distance from Moving Averages
When price stretches too far away from short-term moving averages (like the 20-period EMA) right before piercing resistance, the move is already overextended.
Buying a breakout when the price is far from its mean is like sprinting the last 100 meters of a marathon. The buyers are exhausted, making the position exceptionally vulnerable to a quick snapback reversal.
4. Lack of Compression Before the Break
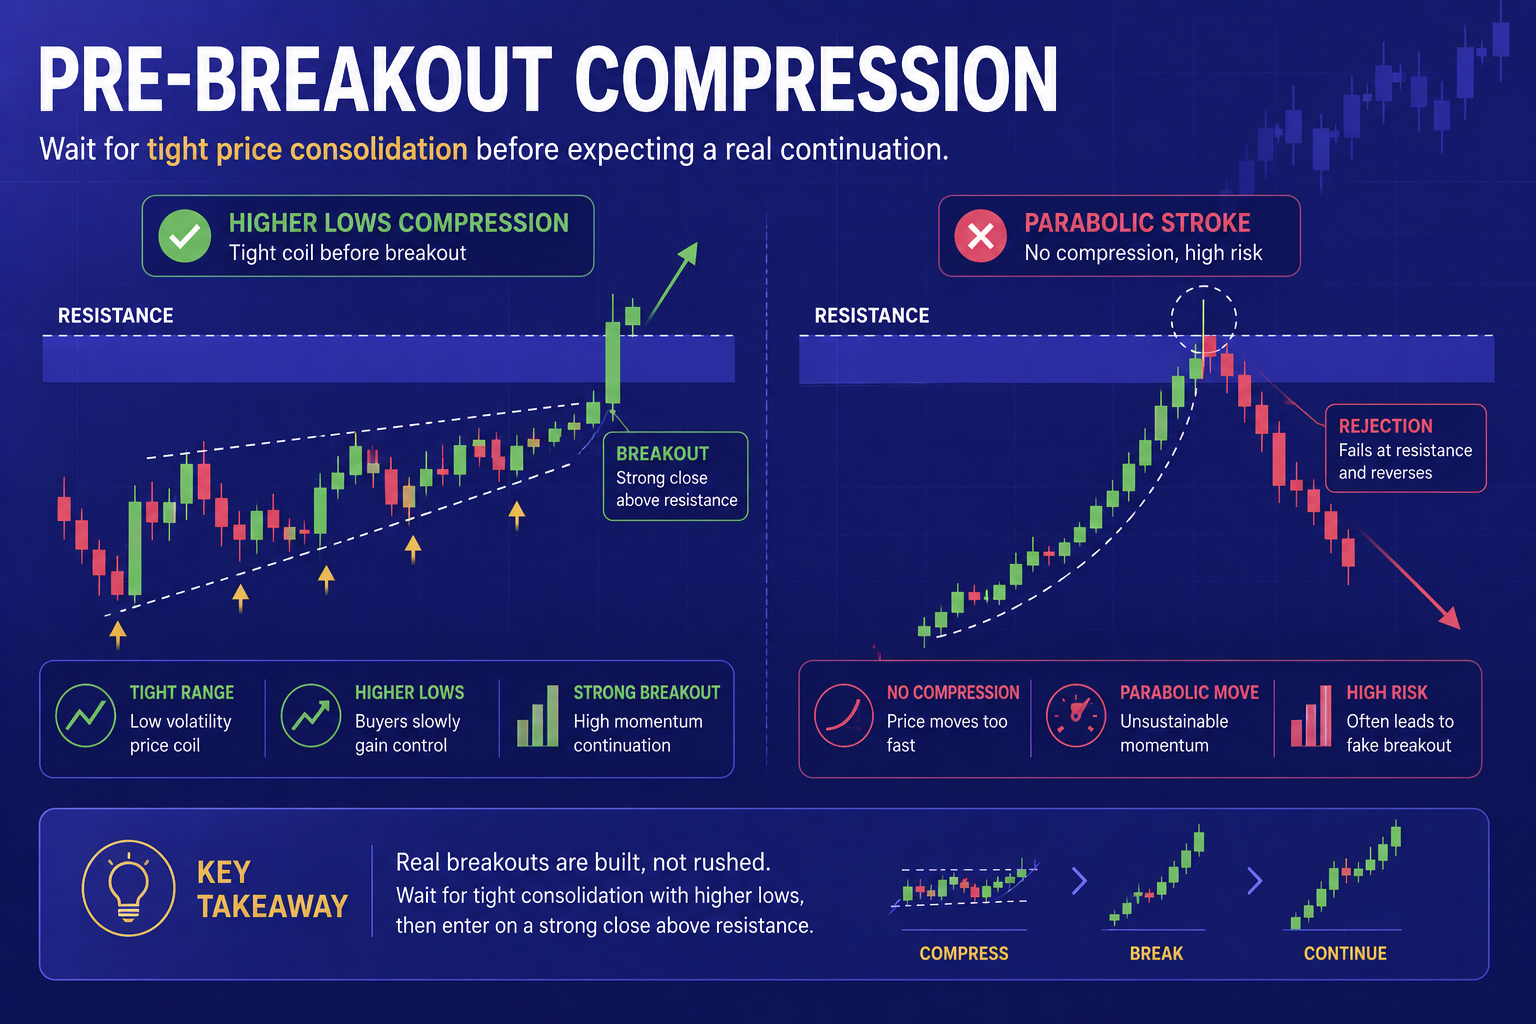
Healthy breakouts usually compress against the key level first. You will see higher lows forming into resistance (an ascending triangle shape) or lower highs pressing against support.
If the price suddenly launches from the bottom of a trading range straight through the top in one single parabolic candle, it rarely has the momentum to sustain the breakout. It almost always results in a sharp rejection.
Step-by-Step Filter Strategy to Trade Breakouts Safely
Once I stopped buying the immediate breakout candle and implemented a strict verification process, my win rate stabilized dramatically. Here is the three-step routine I follow on every single setup.
Step 1: Mark Your Levels on Higher Timeframes
Support and resistance zones drawn on a 1-minute or 5-minute chart are naturally noisy and prone to frequent fake moves. Always identify your major structural boundaries on the 1-hour or 4-hour charts first, then zoom in to look for execution setups.
Step 2: Demand a Confirmed Candle Close
Never jump into a trade while the breakout candle is still active. A candle can look like a massive bullish breakout with ten seconds remaining, only to dump dramatically before the close and leave a huge upper wick. Wait for the candle to close fully outside the zone.
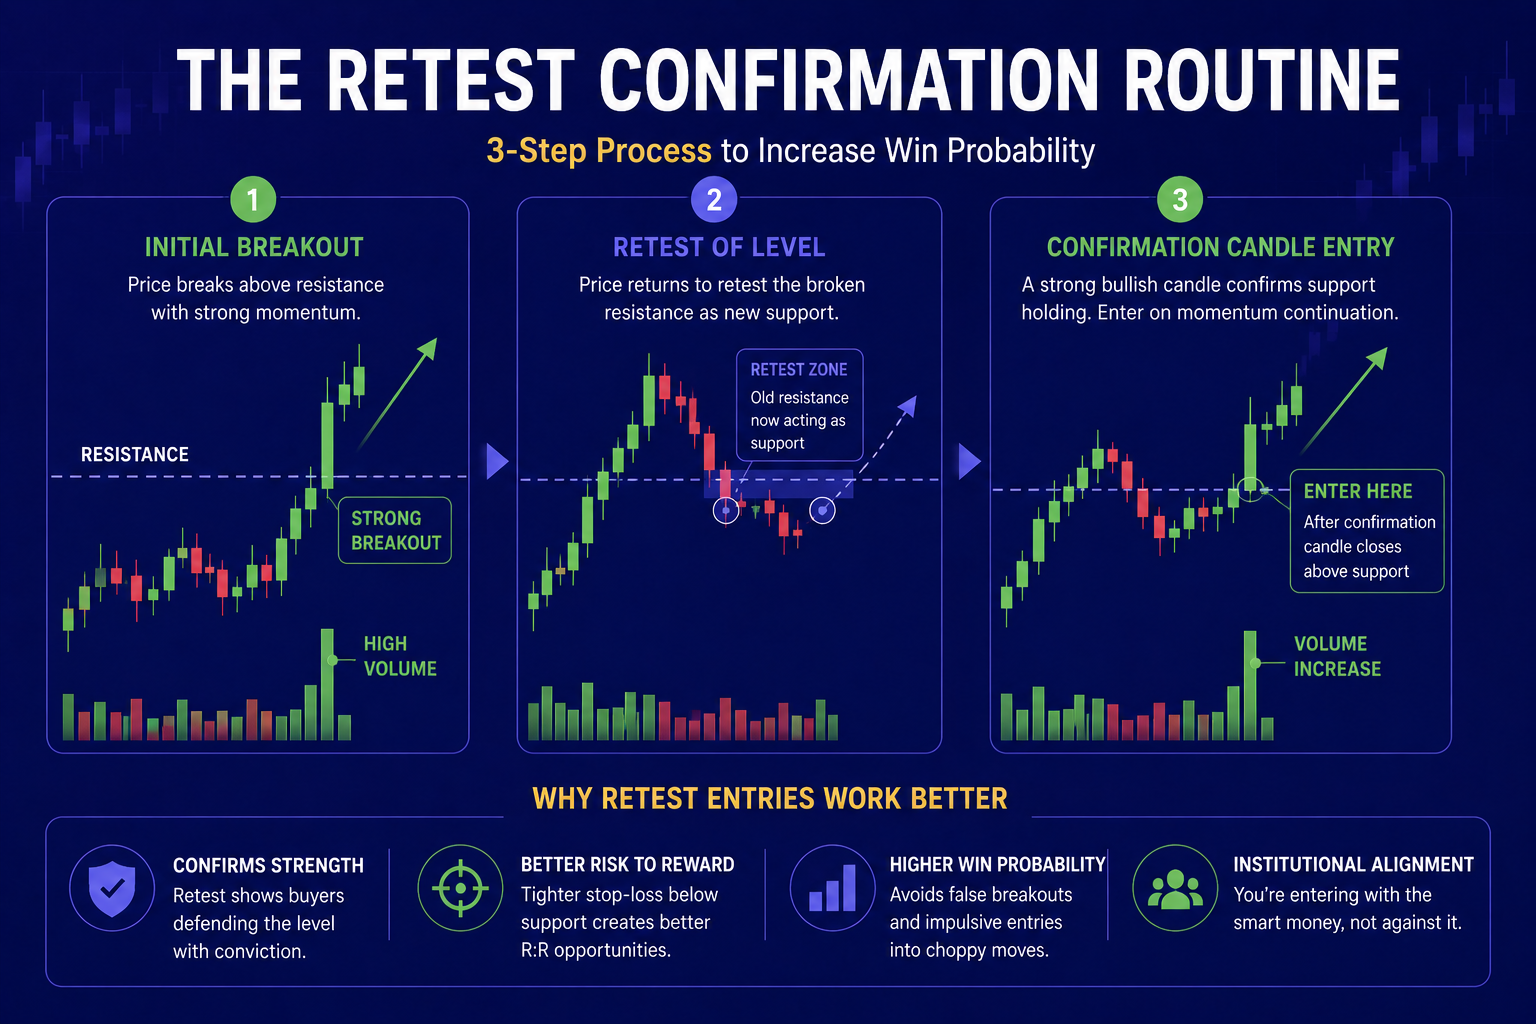
Step 3: Wait for the Retest and Rejection
Instead of chasing the initial move, let the price break out, pull back, and test the broken level from the opposite side.
- For a bullish breakout: Wait for resistance to act as new support.
- For a bearish breakout: Wait for support to act as new resistance.
Enter only when you see a clear confirmation signal on the retest, such as a bullish pin bar or engulfing candle bouncing off the level.
Execution Across Modern Trading Platforms
Applying these price action principles requires a trading interface with reliable chart rendering, rapid execution speed, and clear volume analysis metrics. Different platforms cater to different asset preferences and trading styles.
If you focus on short-term high-yield trading, responsive chart platforms let you monitor micro-structure and price rejection wicks cleanly. You can test these price action strategies on a risk-free demo account using the IQ Option Platform to practice identifying wicks and support levels in real time.
For traders who prefer streamlined technical interfaces with customizable indicators, exploring features on Binomo provides an intuitive workspace to practice drawing key compression zones.
Depending on your region and preferred instrument types, practicing breakout filtering across alternative environments can broaden your market feel:
- Check out the analytical charting options on Pocket Option to test fast time-frame price rejections.
- Analyze asset variety and execution parameters via Quotex.
- Practice short-term structural levels on ExpertOption or evaluate technical indicators on Olymp Trade.
- Advanced multi-asset traders can also explore institutional-grade charts on Capital Core.
Mastering Price Action Beyond the Basics
Learning to identify fake breakouts is just one piece of the broader price action puzzle. Once you stop bleeding capital on fake moves, your next step is developing a complete systematic framework for market structure, trend identification, and risk management.
To build a well-rounded foundation, explore our deep-dive analysis on price action strategies over on the BeCoin Blog. Studying complementary mechanics like order block identification, liquidity grabs, and multi-timeframe alignment will help you build a comprehensive trading edge that stands up to volatile market conditions.
Stop Trading Alone in the Dark
Trading can be an incredibly isolating journey. Trying to decode complex institutional traps on your own usually leads to frustrating trial and error, costly account drawdowns, and endless doubt right when you need execution clarity the most.
You do not have to figure out these complex market shifts by yourself.
By joining BeCoin Premium, you get direct access to institutional-grade market breakdown, real-time strategy updates, and high-probability trade insights designed to keep you on the right side of market liquidity. Instead of guessing whether a breakout is real or fake, align your trading with professional insights.
Check out our real-time trade signals and market updates inside the BeCoin Forecast Hub to stay ahead of key structural moves, protect your account, and level up your trading strategy today.
Day Trading Strategy Explained
This video demonstrates a practical price action strategy on day trading platforms, helping you visually spot candle reversals and avoid common breakout traps discussed in this article.

Trading Currency Strength Instead of Single Pairs
It was a Tuesday afternoon when I realized I was fighting a losing battle against a ghost. My screen was a chaotic web of indicators. I had the EUR/USD chart open, a moving average crossing over here, a relative strength index flashing oversold there, and a price action setup that looked textbook perfect. I clicked […]

Deriv vs Binomo Deposit Methods: My 2026 Real Money Comparison Guide
I sat in the corner of a crowded coffee shop, my eyes fixed on my phone screen. After months of testing strategies on a demo account, I had finally saved up a small pocket of risk capital. I felt ready to trade live. A high-probability setup was forming on my charts, and my heart rate […]

Best Broker for Learning Price Action in 2026 (Tested by Real Traders)
Most traders think they need a better strategy. What they actually need is a better understanding of price. A few years ago, one of our community members had over ten indicators on his chart. RSI. MACD. Moving averages. Bollinger Bands. Stochastic. Every new YouTube video added another indicator. The result? More confusion. Not more profits. […]

I Started with $10 on Quotex – Day 1 Results (Real Case Study)
Most beginner traders ask the same question:Can you actually grow a small account like $10? Instead of theory, I decided to test it in real conditions. This is a Day 1 case study of trading with $10 on Quotex, documenting everything from setup to execution, mistakes, emotions, and actual results. No hype, no fake screenshots, […]

The Best Broker Without Complicated Features (And Why Simplicity Wins)
Most traders don’t fail because they lack knowledge. They fail because their platform buries them in noise before they even place their first trade. Here’s what actually works. It Started With a Confession From a $10 Trader A reader messaged us a few months back. He had been trying to trade for three weeks, had […]

Can You Start Trading with $10 on Deriv?
A lot of beginners enter trading with the same question: “Is $10 actually enough to start trading on Deriv?” The short answer is yes. But the real answer is more complicated. You can start with $10 on Deriv, but whether you can survive, learn, and grow that account depends entirely on your expectations, discipline, and […]