How to Read Market Momentum Without Indicators
I still remember the headache of my early trading days. My screen looked less like a financial chart and more like a neon laser tag arena. I had three moving averages, a Relative Strength Index (RSI) fighting for space at the bottom, Bollinger Bands squeezing the life out of my candlesticks, and a MACD flashing red and green lights. I thought more tools meant more clarity. Instead, it just meant more ways to justify a bad trade.
One evening, after watching a perfectly good setup reverse into a loss while I waited for three different indicators to give me permission to enter, I snapped. I right-clicked, hit "Delete All Indicators," and stared at a completely blank chart. It felt naked. It felt terrifying.
But that was the day I actually started learning how to read the market.
When you strip away the math-derived lagging lines, you are forced to look at the only thing that actually matters: price. Momentum isn't an oscillator crossing above eighty. Momentum is the urgent, aggressive speed at which buyers or sellers are pushing the market right now.
The Illusion of the Perfect Indicator
We use indicators because we crave certainty. We want a machine or an algorithm to tell us that the coast is clear. But every single indicator is just a historical math equation wrapped in a colorful line. They tell you what happened, not what is happening. By the time an RSI tells you the market is oversold, the institutional smart money has already bought the bottom and is getting ready to sell back to you.
When I cleared my dashboard on the IQ Option Platform, the price action suddenly became a living breathing entity. If you are struggling with a cluttered screen, it might be time to look into the best broker without complicated features so you can focus on the raw data.
To read naked momentum, you only need to master three core pillars: candle body expansion, displacement, and the rejection of value. Let us break down exactly how I use these every single day to stay on the right side of the trend.
Pillar 1: Candle Expansion and Velocity
The easiest way to spot real momentum is to look at the size of the candles relative to the ones that came before them.
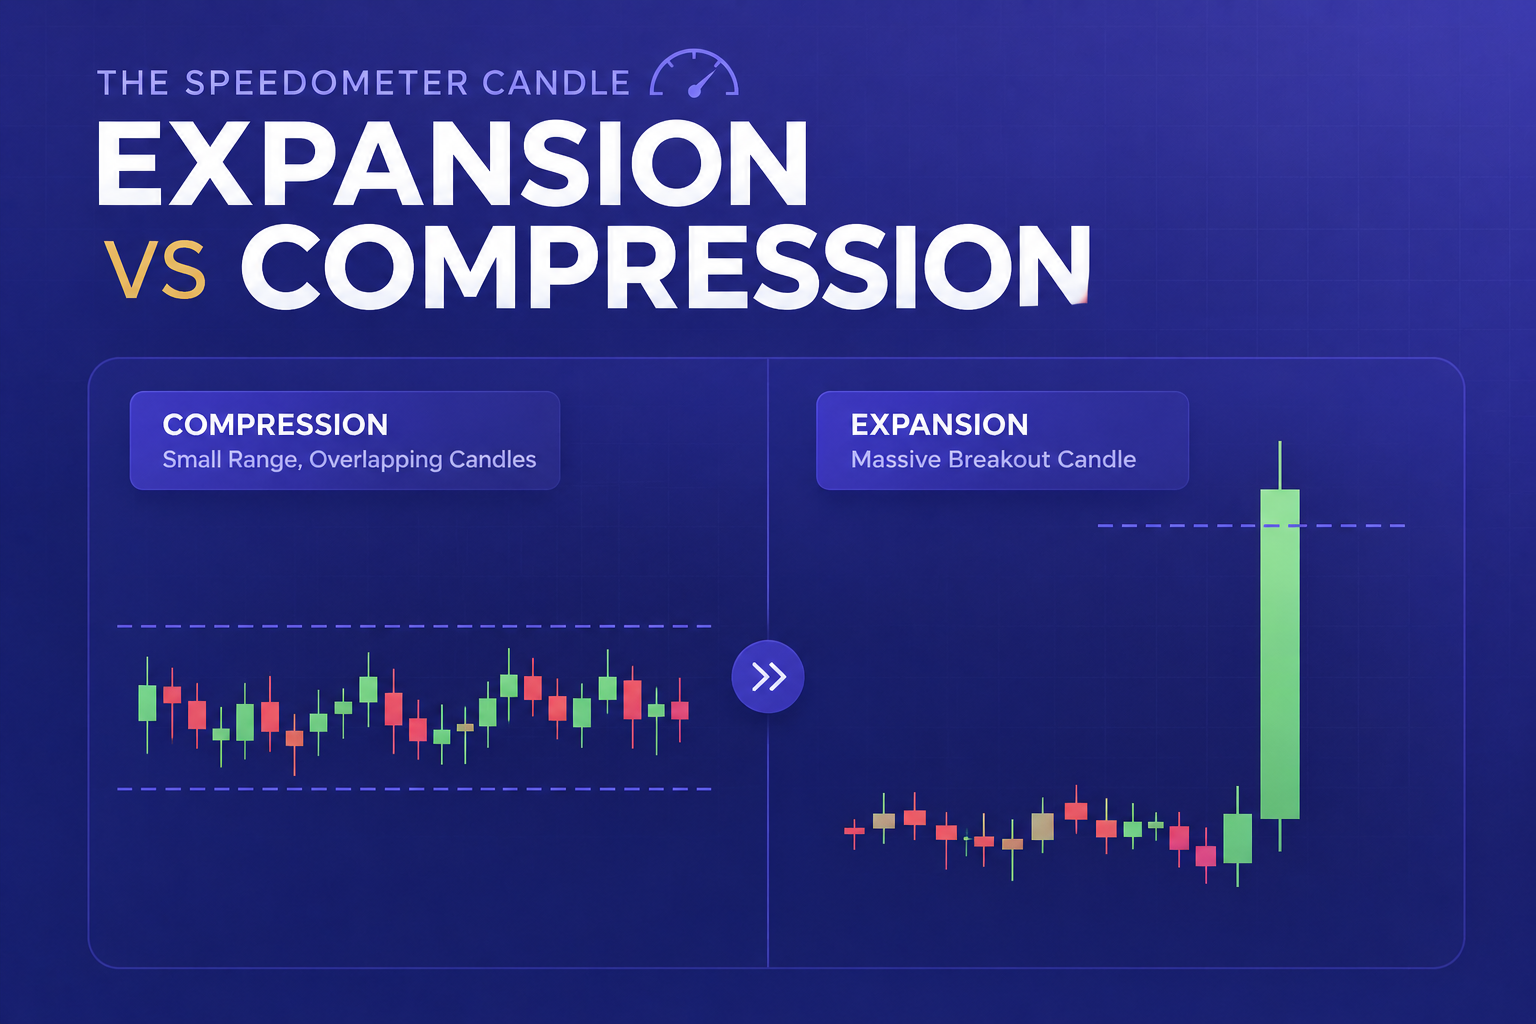
Think of a car accelerating down a highway. If it is moving at twenty miles per hour, then suddenly hits sixty, eighty, and one hundred miles per hour, you do not need a speedometer to tell you it has picked up massive momentum. On a trading chart, candle bodies are your speedometer.
When the market is moving sideways in a boring, choppy range, the candle bodies are usually small, overlapping, and messy. This is the market breathing. But when a true momentum shift happens, you will see a sudden, dramatic expansion in candle size.
A large, full-bodied candle that closes near its absolute high or low tells you that one side completely dominated that specific timeframe. If you want a visual breakdown of how this looks across different trading layouts, check out our comprehensive IQ Option vs Deriv chart comparison to see how clean price action manifests on professional interfaces.
When I trade on Binomo, I look for these expanding candles to break out of recent structures. If three small red candles are instantly swallowed by one massive green candle, that is an immediate visual cue that the sellers have been overwhelmed. This approach is highly effective for traders practicing a best broker for one trade a day strategy in 2026, where patience and high-probability momentum execution are everything.
Pillar 2: Displacement and the Clues of Market Structure
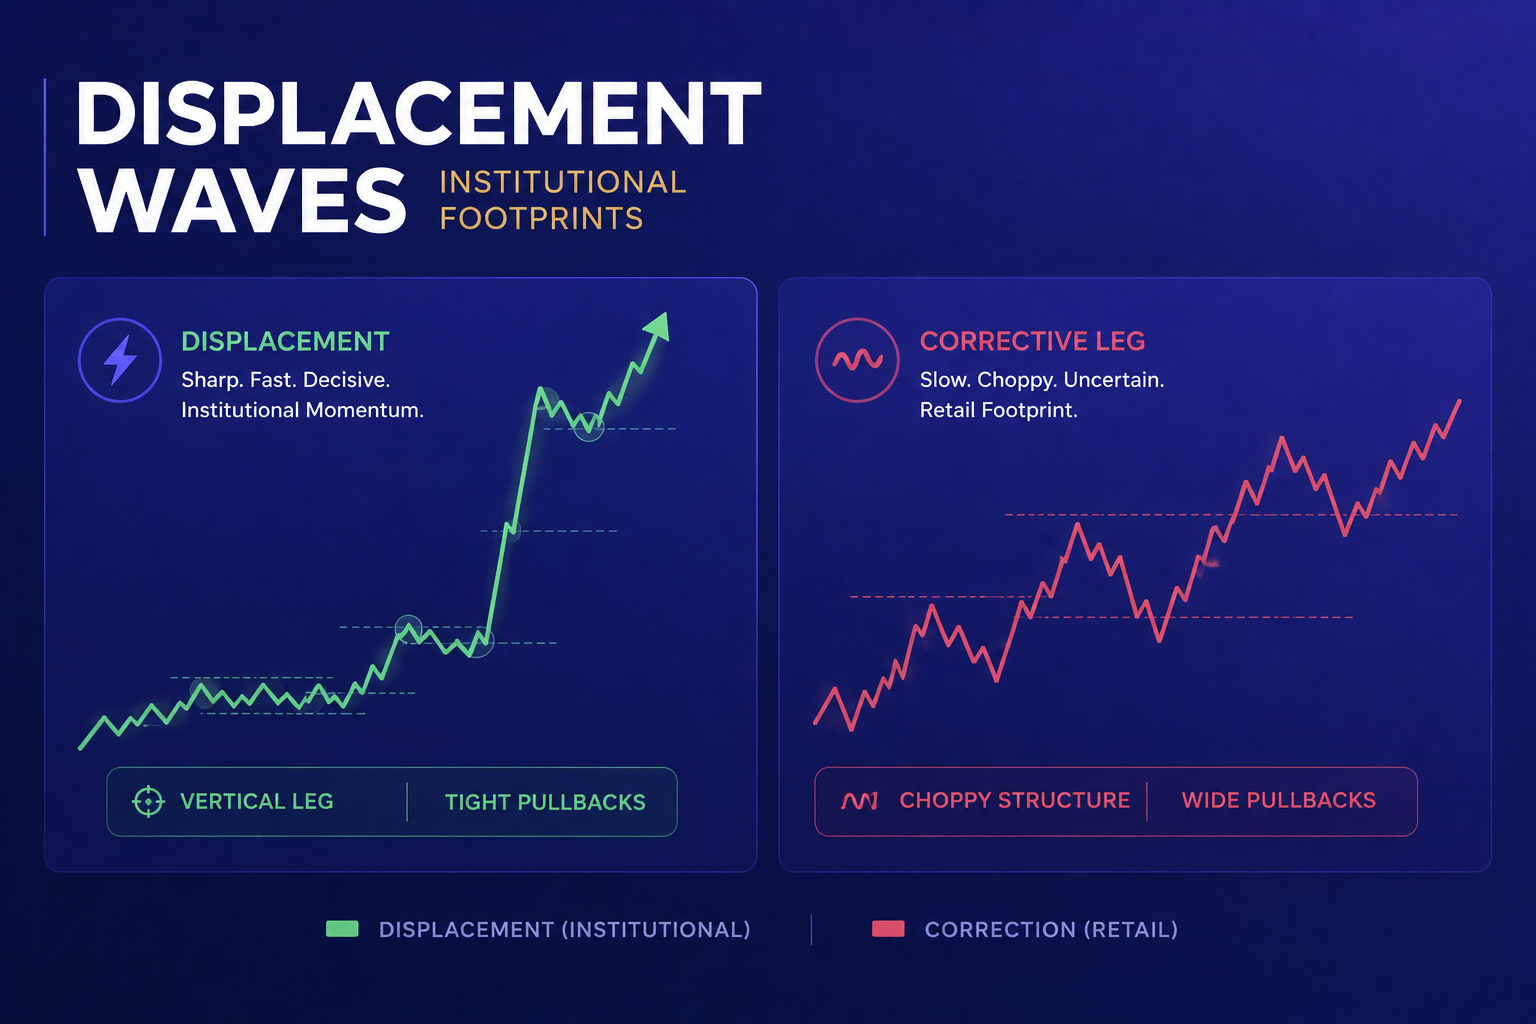
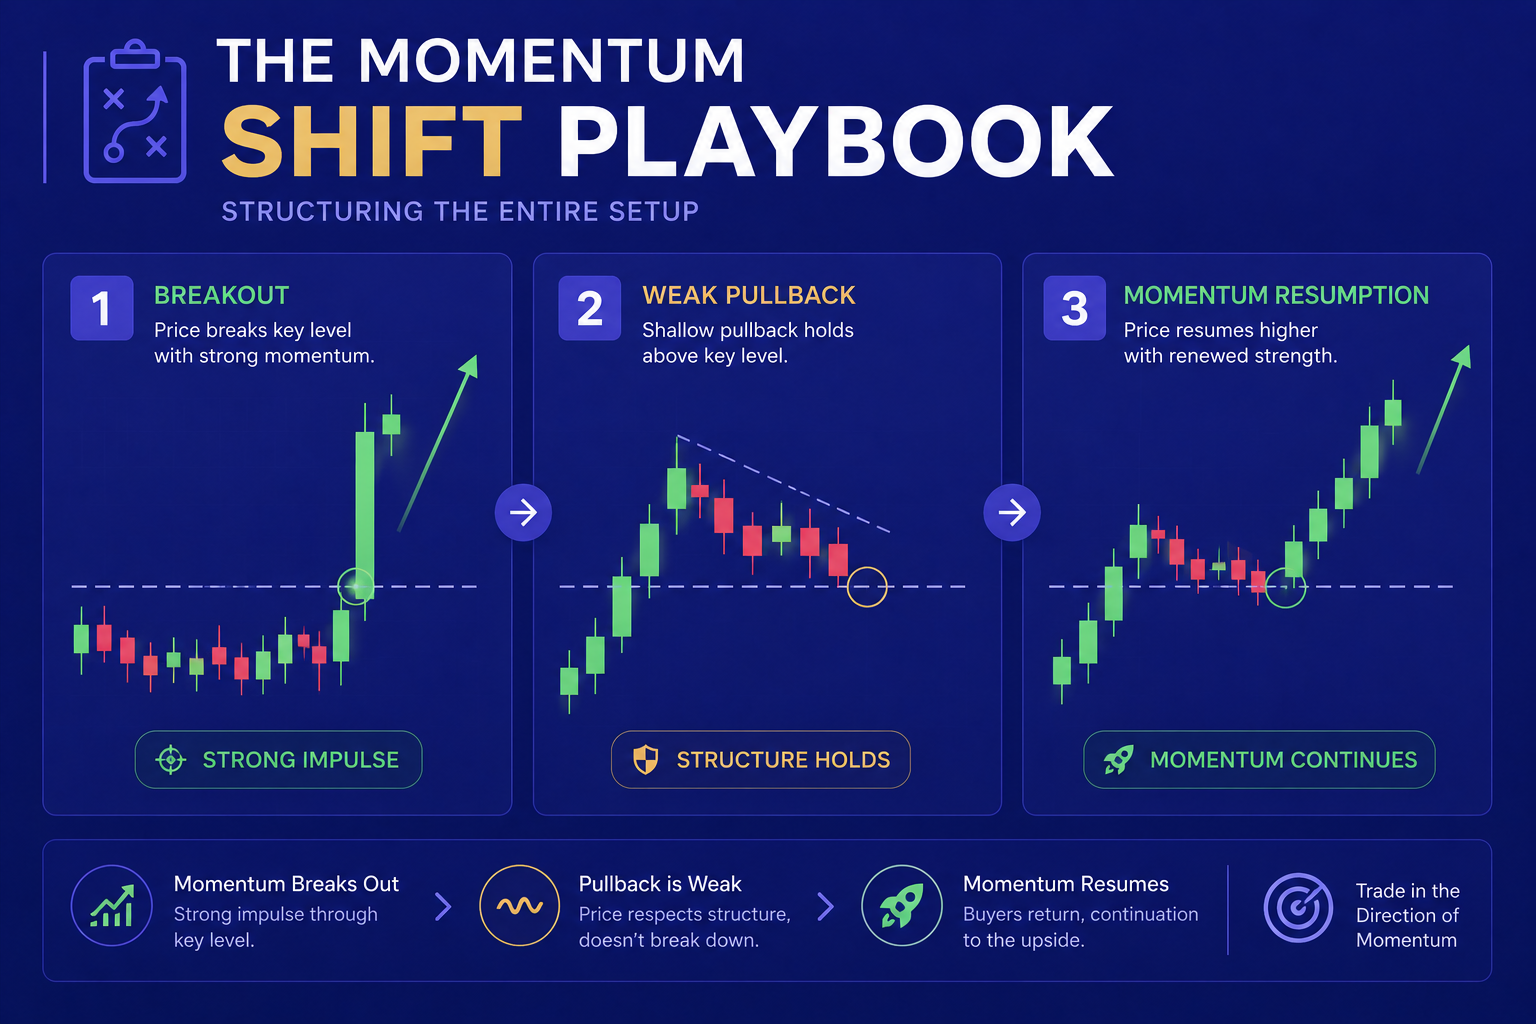
Expansion tells you a single candle is strong, but displacement tells you the entire market structure is shifting. Displacement happens when price moves aggressively away from a specific zone, leaving behind clean, single-colored candles without deep retracements.
When institutional capital enters the market, they cannot hide their footprints. They buy or sell in such massive quantities that they displace the price heavily in one direction.
When you see multiple, consecutive large candles moving in one direction with very small wicks, that is a displacement wave. Trying to trade against this wave because an indicator says the asset is "overbought" is a quick way to blow an account. This raw realization was a major turning point for me, a story I detailed when reflecting on the day I stopped trading and finally started making money.
Instead of fighting the move, I wait for the displacement to pause. Price will almost always pull back slightly as early buyers take profits. If the subsequent pullback consists of small, weak, hesitant candles, it proves the counter-trend lacks real conviction. That slow pullback is your invitation to join the dominant momentum.
Learning this structural rhythm completely saved my trading career, specifically how understanding market structure saved my day trading from the trap of constant, unpredictable whipsaws.
Pillar 3: Rejection Wicks and Value Denial
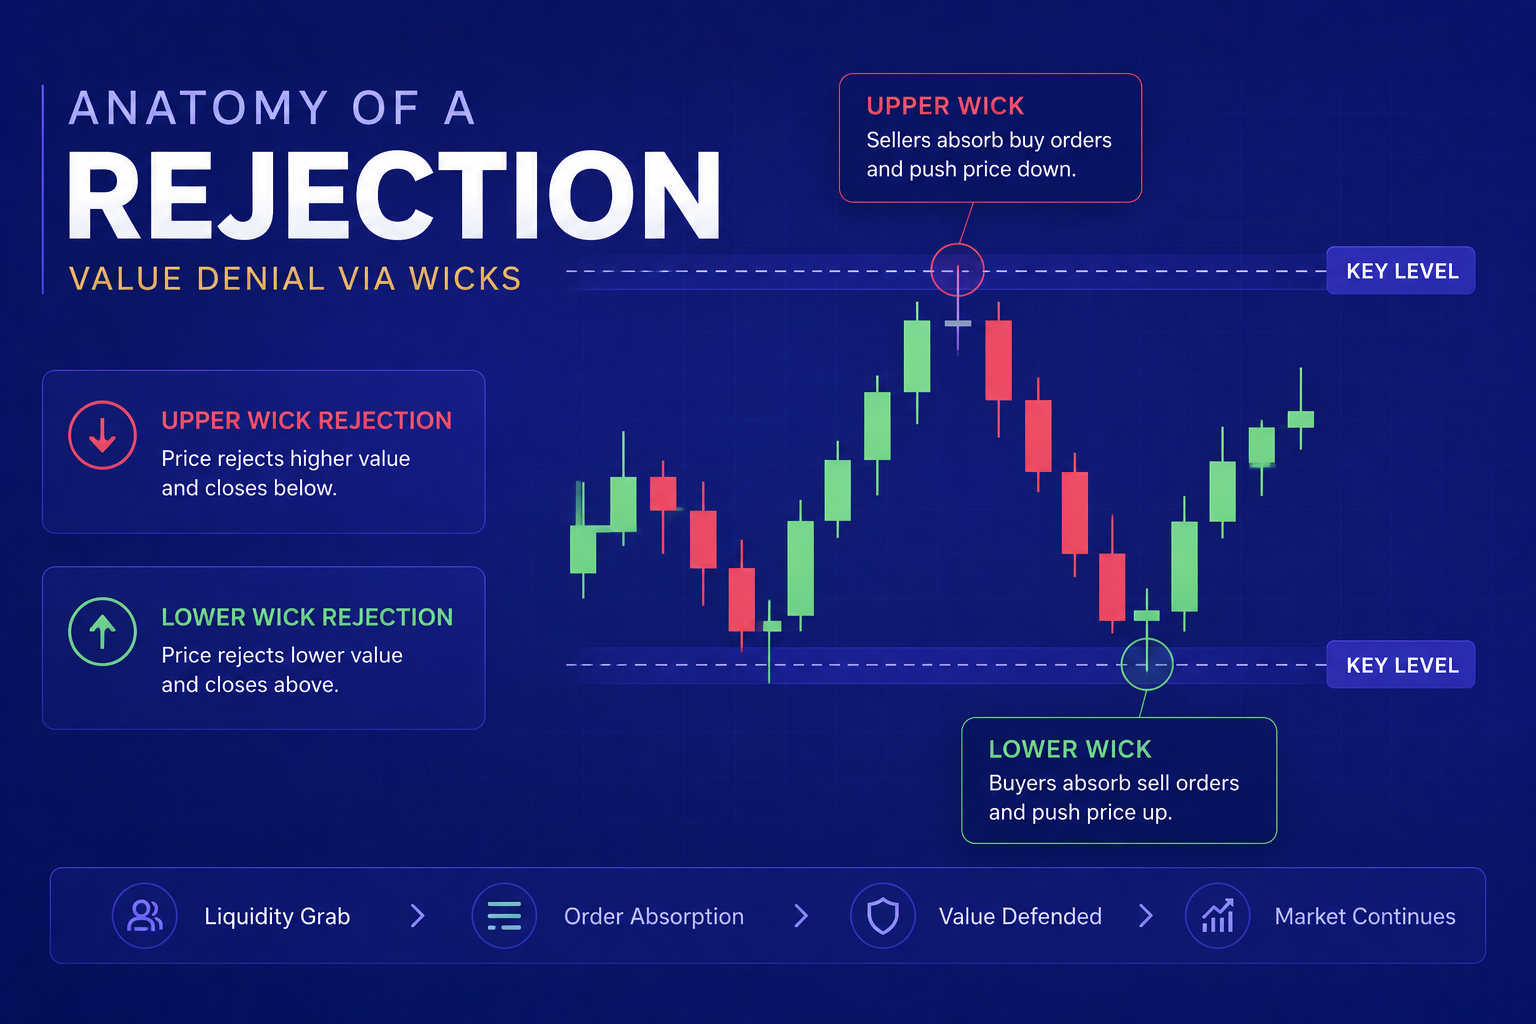
The third pillar of reading naked momentum is identifying where price is aggressively rejected. Wicks are the shadows left behind when price visits a level and gets violently kicked out by the opposing force.
Imagine price rallying hard into a known resistance level. It looks incredibly strong. But within minutes, the candle reverses completely, leaving behind a long upper wick and a tiny, crushed body at the bottom. What does that tell you? It tells you that even though buyers had the momentum to push price up there, the sellers were waiting with heavy ammunition. They completely denied that value level.
A long wick flashing against a key level is often a much faster and more reliable reversal signal than waiting for a slow moving average crossover. If you are learning how to read these quick structural rejections, it is vital to practice on a platform with zero lag. Exploring the best broker for learning price action in 2026 can give you the responsive, real-time environment required to train your eye to see these split-second rejections.
Putting It Together into a Real Strategy
When you sit down at your trading desk tomorrow, try a simple exercise. Turn off your indicators for just one session. Look at your favorite asset class and ask yourself three simple questions:
- Are the recent candle bodies getting larger or smaller?
- Is price displacing cleanly away from zones, or is it grinding sideways in a tight, overlapping cluster?
- Are the wicks showing that a specific price level is being heavily protected?
If you notice large green candles breaking through previous highs with minimal lower wicks, the momentum is undeniably bullish. You do not need an RSI to confirm it. You just need to manage your risk and find a clean entry on a minor pullback.
If you are wondering how much capital you actually need to practice this without putting your life savings on the line, take a look at our guide on how much money do you really need to start trading to see how to start safely.
For those executing these precise momentum setups, matching your strategy with the right execution environment is critical. If you value fast trade processing and rapid payouts when you catch a clean momentum wave, checking out the fastest withdrawal brokers real test results will help you find a reliable home for your capital.
Take Your Market Analysis to the Next Level
Reading the naked market structure gives you an immediate clarity that indicator-heavy traders simply cannot match. You see the shifts as they happen in real-time, not three candles later.
But reading raw momentum is only half the battle; knowing which global assets are primed for the cleanest structural moves is what turns a hobby into a business. If you want to stop guessing and start trading with institutional-grade data, join our premium community.
Unlock daily professional market breakdowns, advanced structure tracking, and predictive order-flow data by upgrading today. Get the ultimate trading edge and view our flexible options on the Becoin Premium Tariff Plan to lock in your access now.
Want to see our raw analytical accuracy in action first? Browse our current active setups and live market insights directly on the Becoin Forecast Hub.

The Clock and the Candle: How I Stopped Guessing the Best Time to Trade Day Trading
I still remember the night I blew my third trading account. It was 11:30 PM. The house was completely quiet, the market charts on my screen were barely crawling, and I was forcing trades out of pure impatience. I kept staring at a flatline asset, placing one-minute positions, convinced that the market owed me a […]

Deriv vs IQ Option for Synthetic Indices: Which Platform Is Better in 2026?
Synthetic indices have become one of the most talked about trading categories among beginners and experienced traders alike. Unlike forex or crypto markets that depend on real world events, synthetic indices operate 24/7 using algorithm driven price movements. That means traders can access opportunities at any time without waiting for market openings or major news […]

Trading Currency Strength Instead of Single Pairs
It was a Tuesday afternoon when I realized I was fighting a losing battle against a ghost. My screen was a chaotic web of indicators. I had the EUR/USD chart open, a moving average crossing over here, a relative strength index flashing oversold there, and a price action setup that looked textbook perfect. I clicked […]

How Understanding Market Structure Saved My Day Trading
I remember the exact moment my trading account hit zero for the third time in a single month. It was a rainy Tuesday evening, and I was staring at a 1-minute chart on my laptop screen. The price had been moving up aggressively. It looked like a flawless rocket ship to the moon. I clicked […]

How I Learned to Sit on My Hands During Choppy Markets
I remember the morning vividly. It was a Tuesday. The coffee on my desk was still piping hot, the charts on my screen were blinking, and I was feeling incredibly confident. I had just finished reading about how market open hours create the best trading opportunities, and I was ready to hunt for a clean […]

Best Broker for Learning Price Action in 2026 (Tested by Real Traders)
Most traders think they need a better strategy. What they actually need is a better understanding of price. A few years ago, one of our community members had over ten indicators on his chart. RSI. MACD. Moving averages. Bollinger Bands. Stochastic. Every new YouTube video added another indicator. The result? More confusion. Not more profits. […]