EUR/NZD Forecast: 1.9570 Support Holds While 1.9750 Caps the Upside
EUR/NZD Forecast: A Reversal That Still Needs Proof
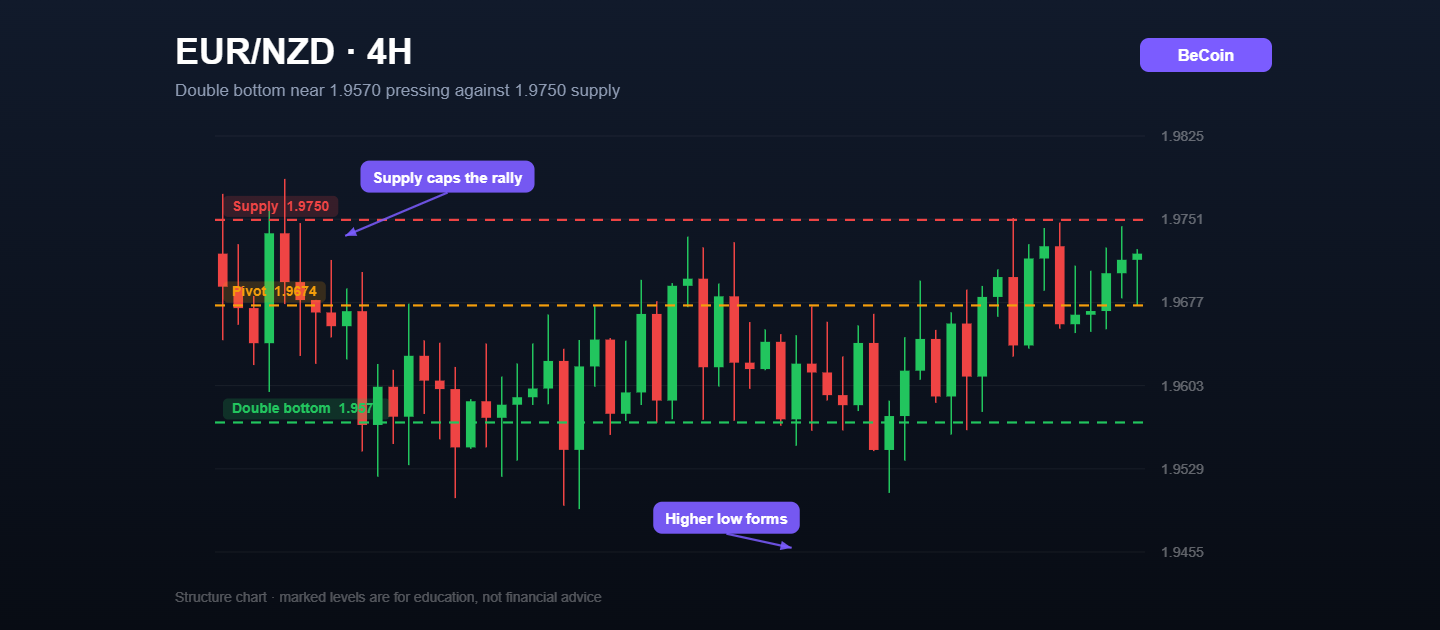
EUR/NZD spent most of the last month sliding, then stopped sliding in a very specific place. Two separate attempts to break beneath 1.9570 failed, and the second attempt produced a higher low rather than a new one. That is the structural definition of a double bottom, and it explains why the tone of published analysis on this cross flipped from bearish continuation to cautious accumulation almost overnight.
The 1.9570 Floor and What It Represents
Round-number support gets a lot of attention, but the reason 1.9570 matters is more mundane: it is where a fresh four-hour demand zone formed, and price has respected it twice. Long setups posted around the pair cluster their entries between 1.9570 and 1.9700, with stops just below 1.9540. That is a tight invalidation for a cross that can move seventy pips in a session, which is either disciplined or optimistic depending on how the week develops.
1.9750 Is Where the Argument Ends
The upside case runs into a wall at 1.9750. That band has rejected price on every approach, and the bearish ideas circulating on this pair all begin there, targeting a rotation back to 1.9641 and then 1.9600. Between 1.9674 and 1.9750 the market is effectively undecided, and trading that pocket without a plan is the fastest way to hand back the gains earned at the lows.
What Drives This Cross
EUR/NZD is a rate-differential story wearing a technical costume. The New Zealand dollar responds to dairy prices, Chinese demand and an RBNZ that has been more willing than most to signal its direction. The euro sits on the other side of the trade with inflation that keeps refusing to fall as fast as forecast. When the differential narrows the cross rallies, and when it widens the cross bleeds. Right now it is doing neither with any conviction, which is precisely why the chart looks like a coil.
Framing the Trade Sensibly
A workable structure is long from the 1.9570 to 1.9620 area with invalidation beneath 1.9540, a first objective at 1.9674 and a second at 1.9746. Traders who prefer confirmation can wait for a four-hour close above 1.9680 and accept a worse entry in exchange for a cleaner signal. Neither approach is wrong, but mixing them halfway through a trade usually is. For levels that are recalculated as the structure develops rather than redrawn by hand, Becoin.net Premium Forecast tracks this cross alongside the other majors, and Becoin.net Tariff Plans breaks down which tier fits a swing-trading routine.
The Invalidation Nobody Should Ignore
A four-hour close beneath 1.9540 destroys the double bottom and turns the pattern into a continuation. At that point the pair has room toward 1.9450 and the entire bullish framing has to be shelved rather than defended.

EUR/USD holds 1.1414 before the ECB decision: three scenarios
EUR/USD traded near 1.1414 before the ECB’s July decision. Here is what a hold, hawkish hold or surprise hike could mean for 1.1350 and 1.1480.

WTI reaches $89.43 as Brent clears $95 on renewed supply risk
WTI traded near $89.43 while Brent moved above $95 as Middle East shipping risk lifted crude for a fifth session. Key levels, catalysts and invalidation.
Deriv Day Trading vs Offshore Brokers: Execution Model Comparison
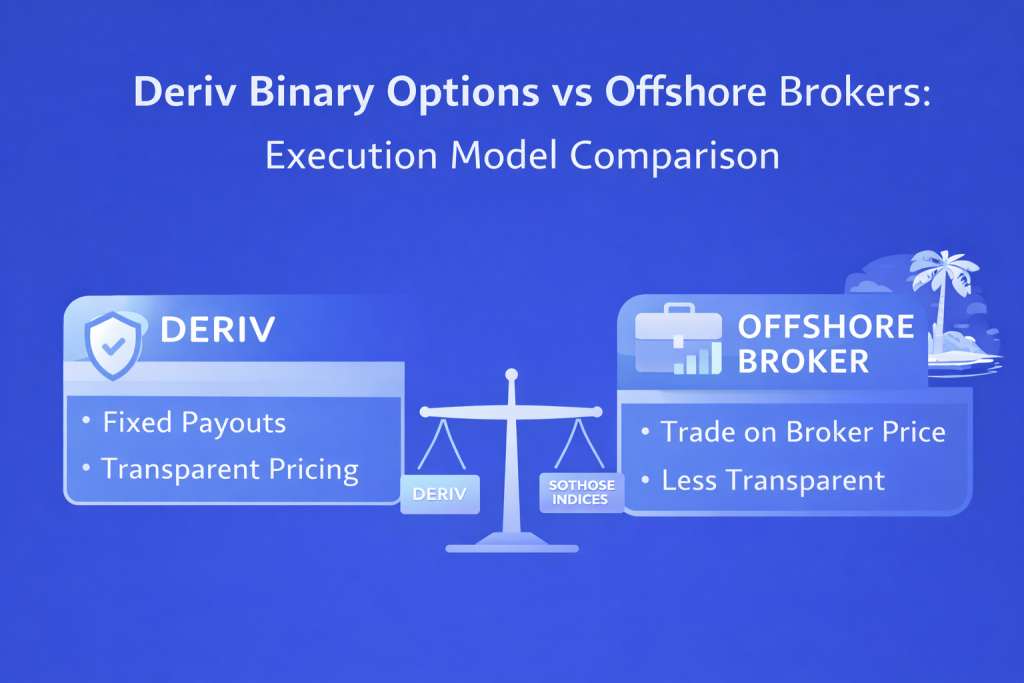
I did not start my trading journey thinking about execution models. Like most beginners, I started with charts, indicators, and the belief that if I could just find the right entry signal, profits would follow. My early trading notebook was full of screenshots of RSI signals, candlestick patterns, and support levels. What it did not […]

Bitcoin slips to $65,741 as oil and yields test the breakout
Bitcoin is near $65,741 as rising oil and Treasury yields test the $65.7K breakout floor. Here are the levels that confirm or invalidate the move.

How Liquidity Affects Day Trading Results
When I first started trading day trading, I believed success was all about finding the perfect indicator. I spent weeks testing moving averages, RSI settings, support and resistance levels, and dozens of YouTube strategies that promised easy wins. Some worked for a few trades, but most failed. What confused me was that the same setup […]

Which Broker Is Better for Weekend Trading?
It was a chilly Saturday morning, and while the rest of the world was sleeping in or catching up on shows, I was staring at a completely frozen screen. My usual EUR/USD chart looked like a heart monitor flatlining. The traditional markets were closed. The banks were shut down. For a long time, that was […]