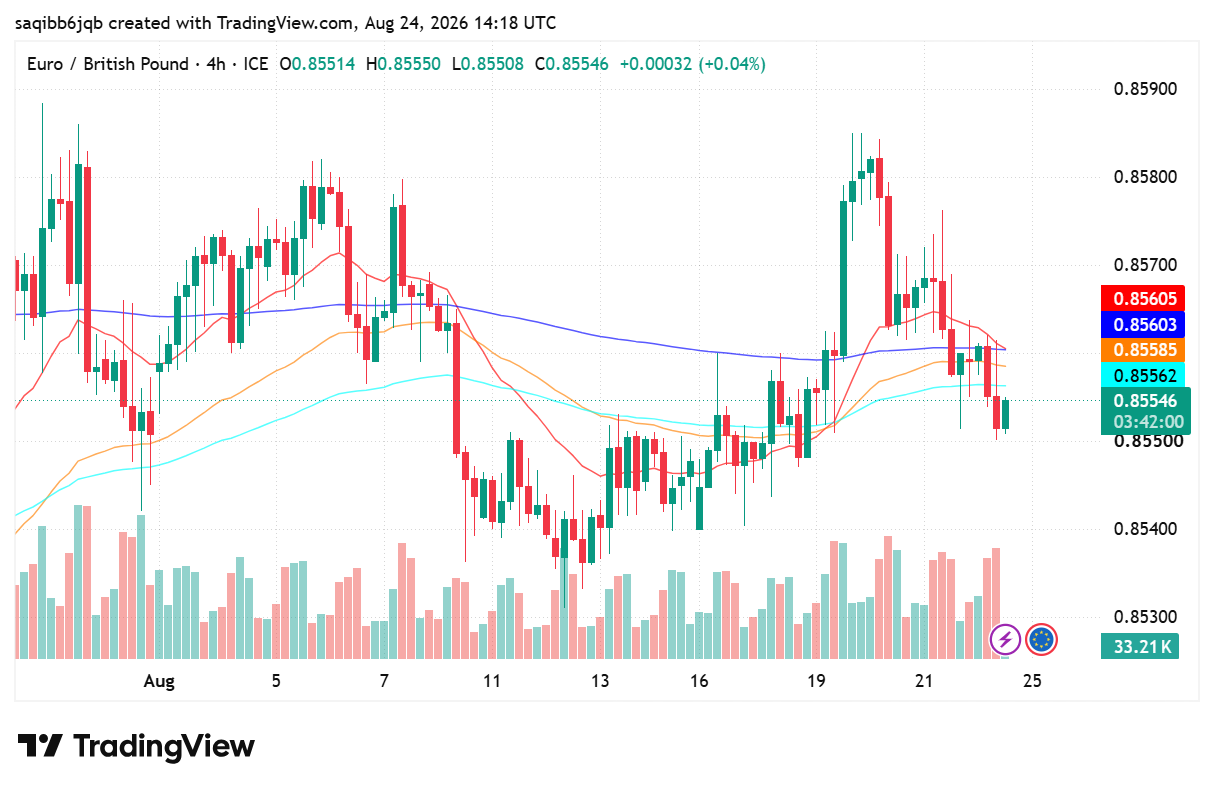
EUR/GBP Forecast: Euro Sterling Coils at 0.8555 as Averages Converge
- EUR/GBP trades at 0.8555, down 0.06% on the day, with all four moving averages compressed inside a 45-pip band.
- The euro area and the UK both printed 2.9% inflation in July, leaving neither central bank with an obvious edge.
- The 0.8585 high and the 0.8535 low bracket the range, and the first clean break sets the direction.
Fundamental Analysis: EUR/GBP
Rarely do two economies hand a currency pair such a symmetrical picture. Euro area inflation came in at 2.9% in July, up from 2.8%, with core at 2.5%. UK inflation came in at 2.9% in the same month, up from 2.6%, with core pressures broadly contained. Both readings sit meaningfully above a 2% target, and both were driven substantially by energy: 10.3% annually in the bloc, and a 13% rise in the household energy price cap in Britain.
The policy responses have been similarly matched in tone if not in level. The European Central Bank raised to 2.40% in June and held in July, watching for second-round effects from energy. The Bank of England held at 3.75% on 30 July on a 6-3 vote, with the three dissenters preferring 4.00%. Both committees therefore contain an active hawkish minority, and both majorities have chosen to wait. The UK sits 135 basis points higher on the policy rate, but that gap has been stable for months and is already in the price.
What is left is a pair with no differential story to trade and no divergence in the inflation data to exploit. That is why the range has tightened rather than resolved. The catalyst will have to come from outside the pair, most plausibly from a broad dollar move that pulls the euro and the pound at different speeds, or from UK labour market data that finally separates the two central banks.
Technical Analysis: EUR/GBP
The 4-hour chart shows a month of chop rather than trend. Price fell from roughly 0.8580 in early August to a 0.8535 low around 12 and 13 August, recovered through the middle of the month, and spiked to 0.8585 on 20 and 21 August before giving all of it back. That spike is the important detail: it was rejected inside two sessions, which marks 0.8585 as a level sellers are defending rather than a breakout attempt.
The averages tell the rest of the story. They now sit at 0.8561, 0.8560, 0.8559 and 0.8556, a cluster so tight it carries no directional information at all. Resistance is 0.8585, support is 0.8535, and compression of this degree typically resolves with a fast move. A sustained close outside either boundary invalidates the range read and should be treated as the start of the next leg rather than noise.

Trading Currency Strength Instead of Single Pairs
It was a Tuesday afternoon when I realized I was fighting a losing battle against a ghost. My screen was a chaotic web of indicators. I had the EUR/USD chart open, a moving average crossing over here, a relative strength index flashing oversold there, and a price action setup that looked textbook perfect. I clicked […]

How Liquidity Affects Day Trading Results
When I first started trading day trading, I believed success was all about finding the perfect indicator. I spent weeks testing moving averages, RSI settings, support and resistance levels, and dozens of YouTube strategies that promised easy wins. Some worked for a few trades, but most failed. What confused me was that the same setup […]

How Understanding Market Structure Saved My Day Trading
I remember the exact moment my trading account hit zero for the third time in a single month. It was a rainy Tuesday evening, and I was staring at a 1-minute chart on my laptop screen. The price had been moving up aggressively. It looked like a flawless rocket ship to the moon. I clicked […]

The Clock and the Cash: My Journey into the Hidden Rhythm of Session-Based Trading
There was a time when I thought the global financial market was a single, monstrous wave that never stopped moving. I believed that if I sat in front of my monitors long enough, clicking buttons whenever a pretty pattern appeared on my charts, the market would eventually reward my sheer endurance. I was dead wrong. […]

Best Broker for Learning Price Action in 2026 (Tested by Real Traders)
Most traders think they need a better strategy. What they actually need is a better understanding of price. A few years ago, one of our community members had over ten indicators on his chart. RSI. MACD. Moving averages. Bollinger Bands. Stochastic. Every new YouTube video added another indicator. The result? More confusion. Not more profits. […]

Best Broker for One Trade a Day Strategy in 2026
Most traders lose money because they trade too much. They enter random setups, chase candles, overreact emotionally, and turn a simple strategy into pure gambling. That is exactly why the one trade a day strategy is becoming more popular among smart traders in 2026. Instead of sitting in front of charts all day, this approach […]