Ethereum H4 Idea: $1,872 Support vs. the $1,935.68 Reclaim
Ethereum is trading at $1,919.71 against the dollar on Binance spot, a price retrieved at 11:16:17 UTC on 30 July 2026 and cross-checked at $1,920.70 on BeCoin's own trading simulator. That puts it almost exactly in the middle of the range the Federal Reserve carved out yesterday afternoon, and it is why this setup is worth mapping now rather than after one side breaks.
The catalyst, as reported
The Federal Open Market Committee announced its decision on 29 July 2026 at 2:00 PM EDT, which is 18:00 UTC. The facts, drawn from published reporting rather than from our own interpretation:
- The federal funds target range was left unchanged at 3.50% to 3.75%.
- The vote was 9 to 3. Beth Hammack of the Cleveland Fed, Neel Kashkari of Minneapolis and Lorie Logan of Dallas all dissented, and all three wanted a 25 basis point increase. Coinpedia notes this is the first time since September 2016 that three officials dissented in the same direction.
- Chair Kevin Warsh framed the backdrop this way: "The Treasury market appears to be signaling many of the same things. While we have not done much over the past 42 days, the markets have done quite a bit."
- The CME FedWatch tool put roughly 62% odds on a 25 basis point hike at the September meeting.
- Spot Bitcoin ETFs recorded a fourth consecutive day of net outflows, about $527 million cumulatively, including roughly $49.75 million on 29 July.
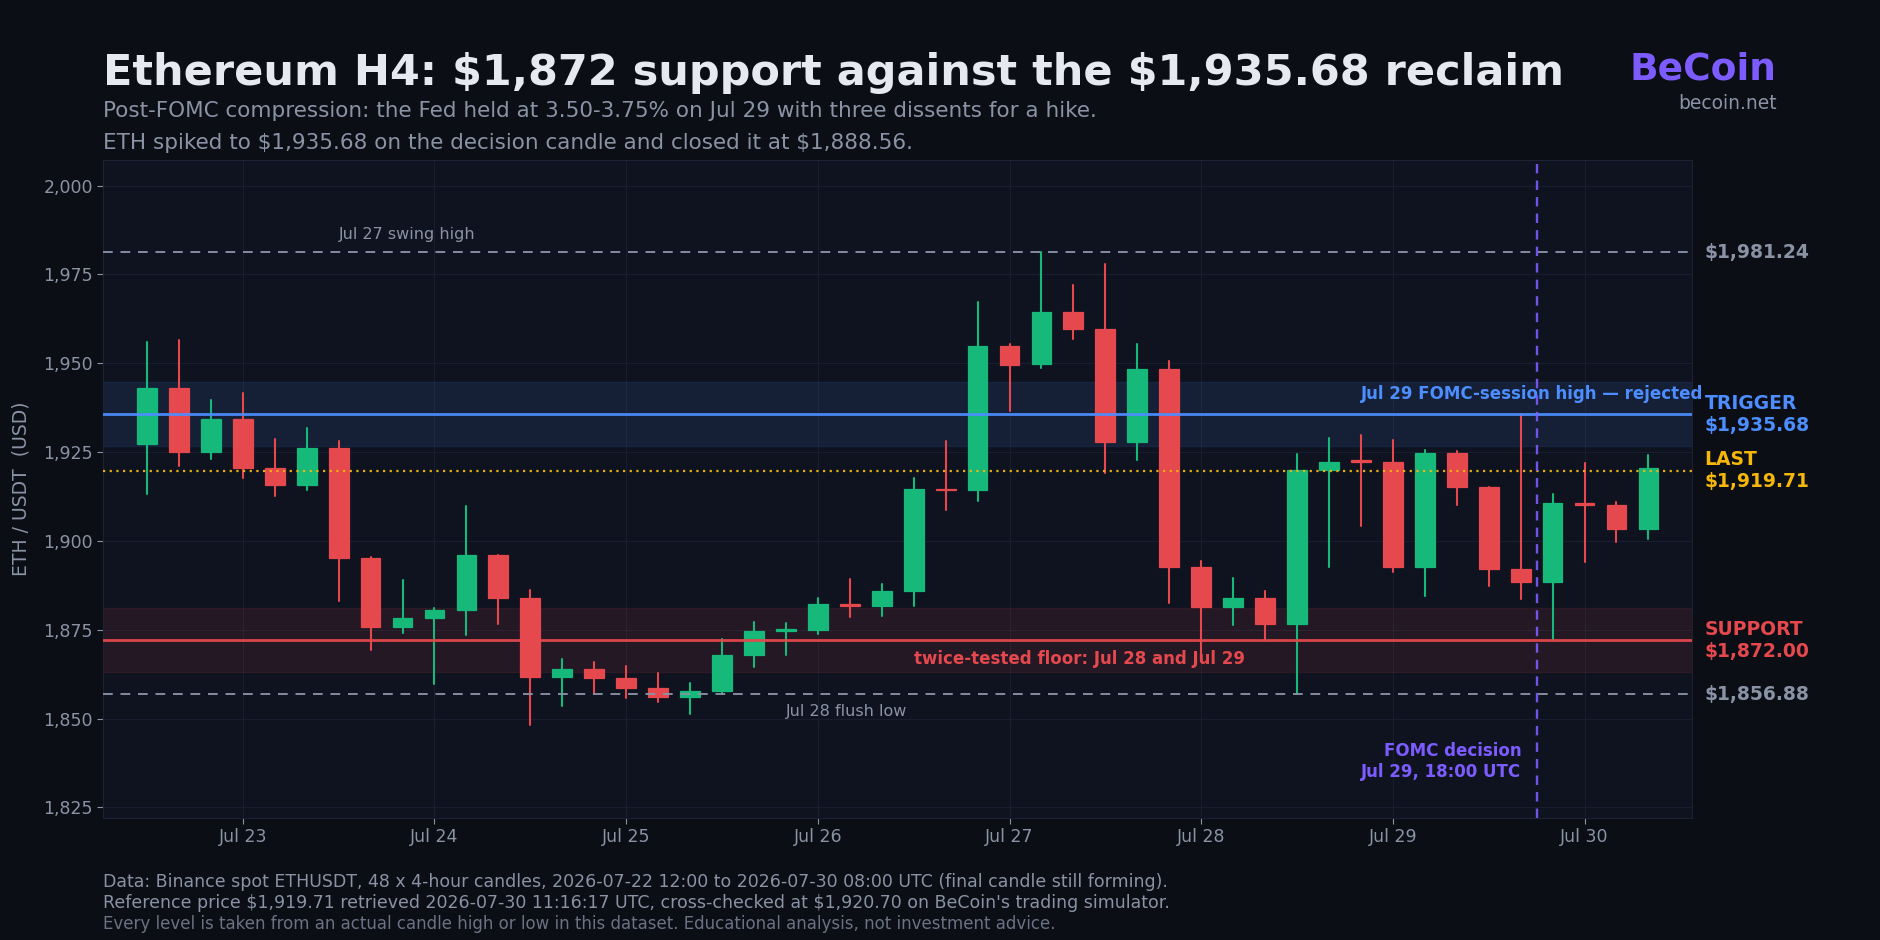
Ethereum's own reaction is visible in the candles. The four-hour candle that contains the announcement opened at $1,892.11, spiked to $1,935.68, and closed at $1,888.56. The next candle traded down to $1,872.00 before buyers stepped in.
BeCoin's read on that
This section is our analysis, separate from the sourced facts above.
A hold that arrives with three dissents pointing at a hike is not a dovish hold. The rate did not move, but the distribution of opinion inside the committee moved, and a 62% probability of a September increase is the market pricing that shift. For a non-yielding risk asset like Ethereum, that combination usually compresses volatility before it resolves it: buyers will not commit ahead of the next inflation print, and sellers have no fresh shock to lean on.
What makes this tradeable rather than merely interesting is that the FOMC session printed both boundaries itself. The high of the decision candle and the low of the candle after it are now the two prices the market has agreed to respect, and Ethereum has spent every hour since between them.
The levels that matter
All four levels below are actual candle highs and lows in the 48-candle four-hour dataset shown on the chart, from 22 July 12:00 UTC to 30 July 08:00 UTC. None of them is derived from an indicator or rounded for convenience.
- $1,935.68 is the trigger. This is the high of the FOMC decision candle, the level Ethereum reached on the announcement and immediately gave back.
- $1,872.00 is the support. It has been tested exactly twice at the same price: as the low of the 28 July 08:00 UTC candle, and again as the low of the 29 July 20:00 UTC candle after the decision.
- $1,981.24 is the upper reference, the 27 July swing high and the highest print in this dataset.
- $1,856.88 is the lower reference, the 28 July flush low.
Scenario one: the reclaim
The condition is a four-hour close above $1,935.68, not a wick through it. A close above that price means the post-FOMC rejection has been undone by the same timeframe that created it.
If that happens, the first bounded objective is $1,954.72, the 26 July daily close and an area that acted as a shelf on the way down. Above it, the next objective is $1,981.24. We are not projecting beyond that level, because there is no reference price in this dataset above it to project towards.
This scenario is invalidated by a four-hour close back below $1,935.68 after the breakout. A failed reclaim tends to be a worse signal than no reclaim at all, and it should be treated as a reason to stand aside rather than to reverse immediately.
Scenario two: the floor gives way
The condition is a four-hour close below $1,872.00. A level tested twice at an identical price attracts resting orders underneath it, so a close through it is more likely to accelerate than to drift.
The first bounded objective is $1,856.88. Below that, the next reference is $1,848.09, the 24 July low and the lowest print in this dataset. This scenario is invalidated by a four-hour close back above $1,872.00.
Risk, sizing and how this Ethereum trading idea was checked
Neither scenario is live at $1,919.71. Both need a confirmed four-hour close, and sizing should assume the first attempt can fail: a common approach is to risk no more than 1% of account equity per idea, with the stop placed on the far side of the invalidation price rather than a fixed distance from entry. Between $1,872.00 and $1,935.68 there is roughly $63.68 of range, so a position sized for a breakout of that range is not the same size as one sized for a scalp inside it.
The reference price was checked on BeCoin's trading simulator, which quoted ETH/USDT at $1,920.70 against Binance's $1,919.71. The simulator is a paper-trading environment: it uses spot quotes and does not model funding costs, slippage, or exchange fees, so live fills will differ from simulated ones. Treat it as a place to rehearse the mechanics of these two triggers, not as a forecast of your execution.
What would make this idea wrong
Stated plainly, so it can be checked later: if Ethereum closes a four-hour candle through neither $1,935.68 nor $1,872.00 before 2 August 2026 00:00 UTC, this range has stopped being informative and the setup should be discarded rather than stretched. Equally, if price closes through one boundary and then closes back inside the range on the following candle, the level has failed as a signal and both scenarios above are void.
The single biggest external risk to both scenarios is data. September hike pricing at 62% is not a settled question, and any inflation or labour market release before 2 August can reprice it in minutes, which would make a technical trigger fire for a reason that has nothing to do with the structure described here.
This is educational analysis of price structure, not investment advice, and not a recommendation to buy or sell any asset. Levels can and do fail. Trade your own plan and size positions so that being wrong is survivable.
Binomo Deposit/Withdrawal: Why Using Different Payment Methods Causes Delays
The first time I hit a decent withdrawal on Binomo, I thought the hard part was over. I had done the trades. I had managed the risk better than usual. I had finally resisted the urge to overtrade after a win streak. So when I clicked withdraw, I expected the money to move as smoothly […]

EUR/USD holds 1.1414 before the ECB decision: three scenarios
EUR/USD traded near 1.1414 before the ECB’s July decision. Here is what a hold, hawkish hold or surprise hike could mean for 1.1350 and 1.1480.

Bitcoin slips to $65,741 as oil and yields test the breakout
Bitcoin is near $65,741 as rising oil and Treasury yields test the $65.7K breakout floor. Here are the levels that confirm or invalidate the move.

How Liquidity Affects Binary Options Results
When I first started trading binary options, I believed success was all about finding the perfect indicator. I spent weeks testing moving averages, RSI settings, support and resistance levels, and dozens of YouTube strategies that promised easy wins. Some worked for a few trades, but most failed. What confused me was that the same setup […]

Finding My Perfect Workspace: The Search for the Best Broker for My Daily Trading Routine
The alarm goes off at 6:00 AM. By 6:30 AM, I am sitting in front of my monitors with a steaming mug of black coffee. The house is completely quiet, the market is preparing its next major move, and my charts are completely bare. This is my daily sanctuary. For a long time, this morning […]

Why Traders Move from Binomo to Deriv in 2026: The Real Reasons Behind the Switch
If you spend enough time around trading communities, you’ll notice a pattern. Many traders start with Binomo. Then, after a few months, a surprising number begin looking at Deriv. Some switch completely. Others keep both accounts but gradually move most of their trading activity to Deriv. I noticed this trend while talking to beginner traders […]