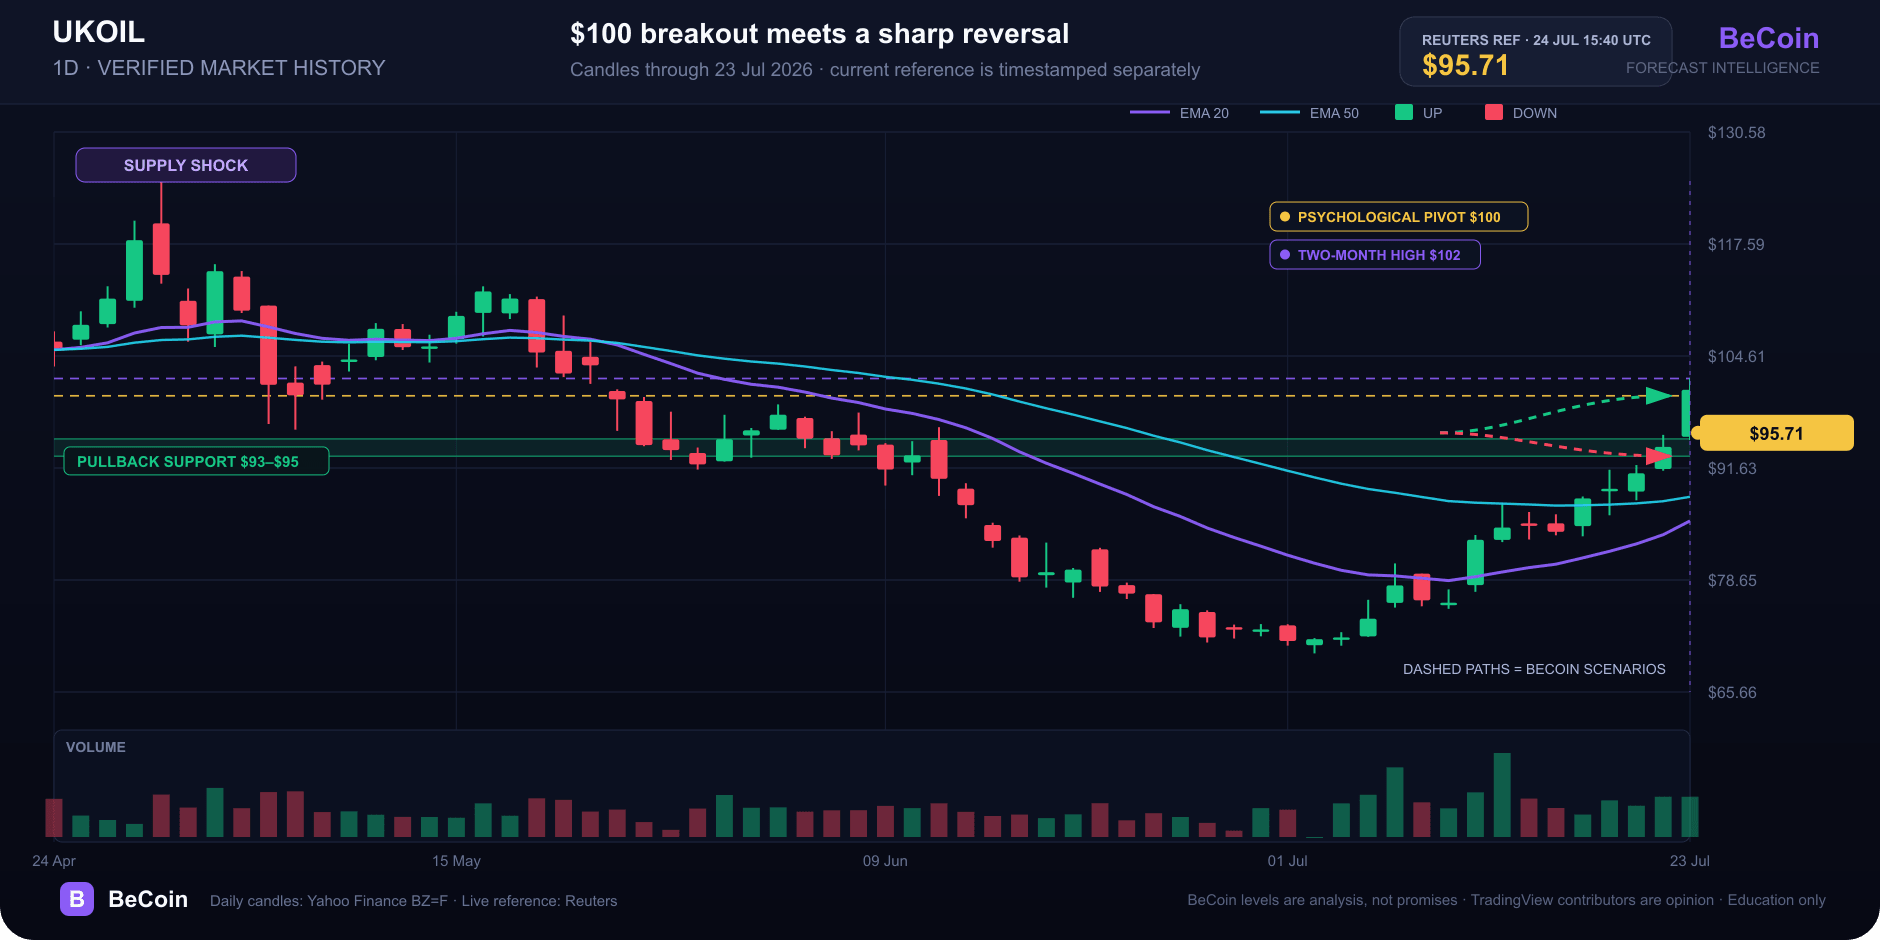
Brent retreats to $95.71 after its first close above $100 since May
Brent crude traded at $95.71 on July 24 in Reuters’ latest global-markets update, down about 5% after reaching a two-month high near $102 and settling above $100 in the previous session for the first time since May. The direct read is a sharp pullback from a psychological breakout, not a resolution of the supply shock.
Why it matters
The move has two competing forces. Iran-aligned Houthi attacks on Saudi tankers increased concern about the Bab el-Mandeb route, while Hormuz traffic remained subdued and Kazakhstan temporarily reduced output after disruption at its main Black Sea export terminal. At the same time, the market is testing whether a $100 price can hold when physical flows have not stopped completely.
Google’s leading results focused on the retreat, physical barrels nearing $110 and renewed stagflation risk. BeCoin adds a timestamped futures level and a scenario map that distinguishes headline risk from confirmation in price.
Technical and market context
The first support is $95, followed by the $92–$93 gap area. A recovery above $98 would put $100 back in play; a daily close above $102 would confirm that the market has absorbed today’s reversal.
TradingView ideas published before the pullback were heavily bullish. Contributors projected $104–$107 or higher if $100 held. Because Brent subsequently fell below $100, those calls are now unconfirmed opinions. Their invalidation levels around $95–$96 are more useful than their targets.
BeCoin forecast read
BeCoin’s base case is a volatile $93–$100 range while shipping evidence changes by the hour. The bull case needs a close back above $100 and continued verified disruption. The bear case strengthens below $93, where the latest geopolitical premium would be unwinding despite unresolved risk.
Track Brent forecasts and compare the move with other markets on the Forecast Hub.
Methodology and sources
Price and event facts: Reuters oil and global-markets reports dated July 24, with the latest retrieved update reviewed at 15:45 UTC. Google results were reviewed July 24; no People Also Ask module appeared for the exact query. TradingView UKOIL ideas dated July 21–23 are treated as opinion.
This content is for education only and is not financial advice.

WTI reaches $89.43 as Brent clears $95 on renewed supply risk
WTI traded near $89.43 while Brent moved above $95 as Middle East shipping risk lifted crude for a fifth session. Key levels, catalysts and invalidation.

Deriv vs IQ Option for Beginners in 2026: Which Platform Is Better to Start With?
Choosing your first trading platform can decide whether you stay consistent or quit after blowing your first account. Most beginners do not fail because trading is impossible. They fail because they start on platforms that confuse them, encourage emotional trading, or make risk management difficult. Two names that often appear in beginner discussions are Deriv […]
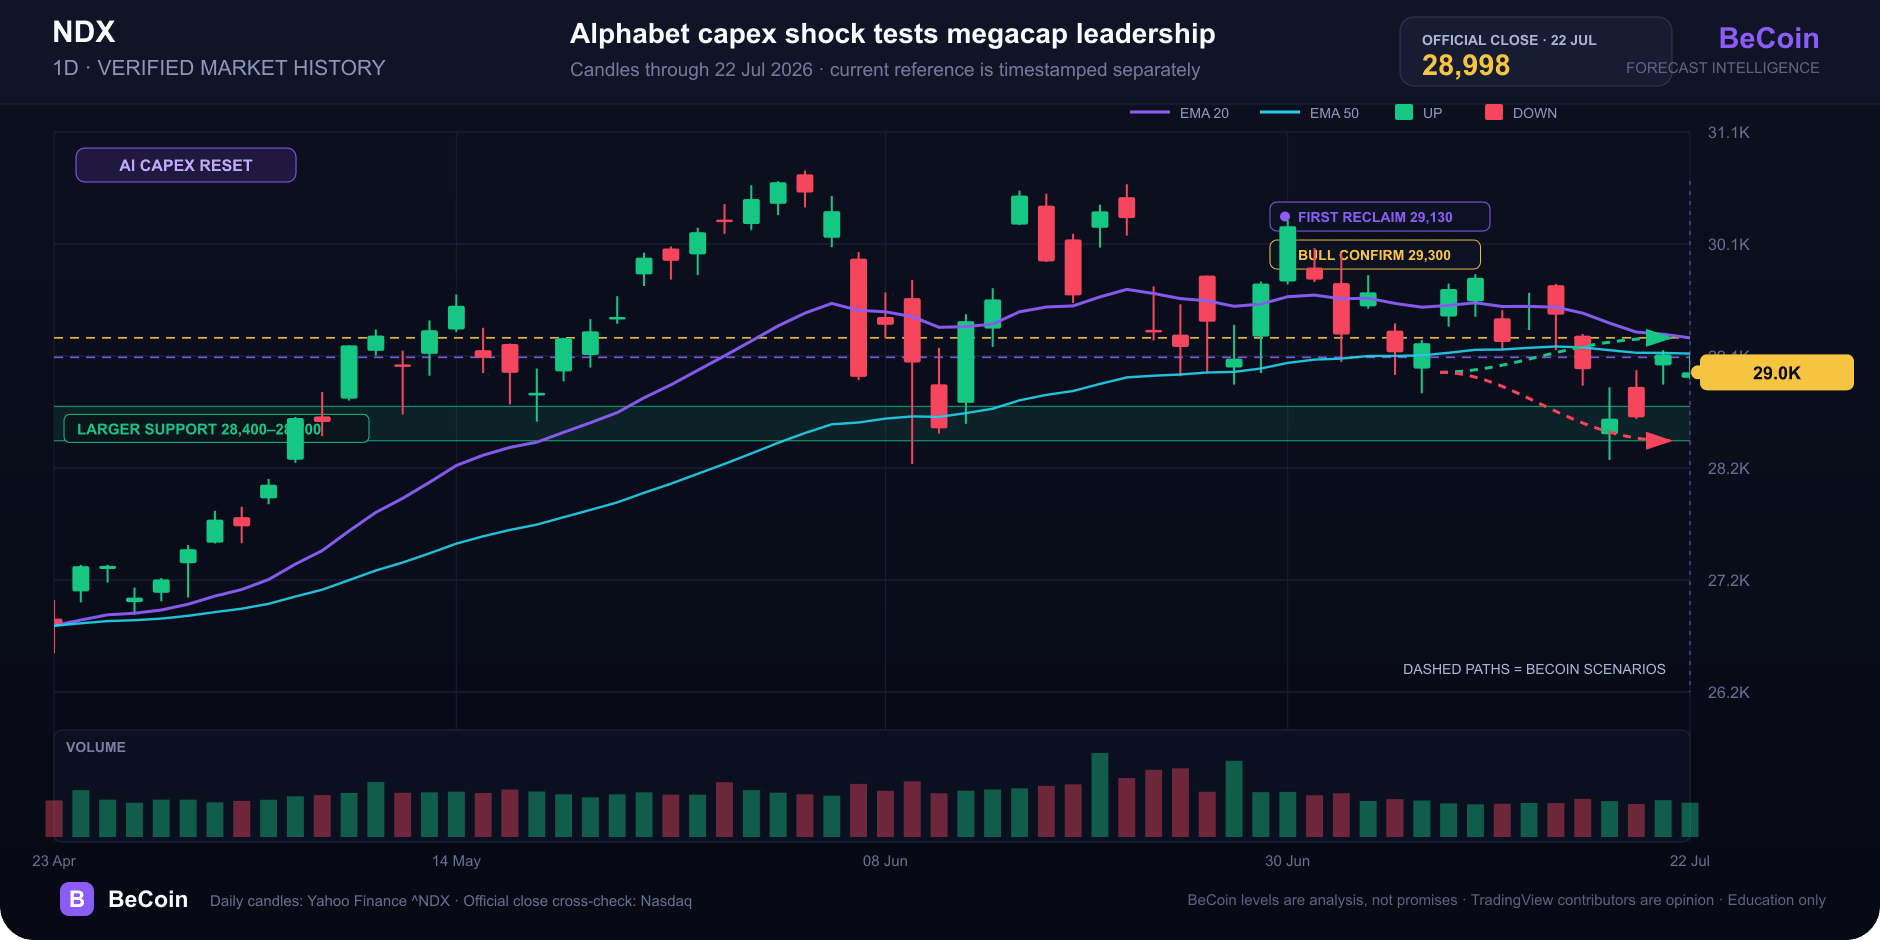
Nasdaq 100 closes at 28,998 as Alphabet spending resets AI risk
The Nasdaq 100 closed at 28,998.10 and futures slipped after Alphabet raised AI spending expectations. The 28,400–29,300 decision zone explained.

Bitcoin slips to $65,741 as oil and yields test the breakout
Bitcoin is near $65,741 as rising oil and Treasury yields test the $65.7K breakout floor. Here are the levels that confirm or invalidate the move.

How Liquidity Affects Binary Options Results
When I first started trading binary options, I believed success was all about finding the perfect indicator. I spent weeks testing moving averages, RSI settings, support and resistance levels, and dozens of YouTube strategies that promised easy wins. Some worked for a few trades, but most failed. What confused me was that the same setup […]

Which Broker Has Faster Withdrawals? Real 2026 Comparison for Traders
When most beginners choose a broker, they focus on bonuses, signals, or flashy interfaces. But after trading for a while, you realize one thing matters more than almost anything else: How fast can you actually withdraw your money? A broker can look perfect until your first withdrawal request gets stuck in “processing” for three days. […]