
Blowing Accounts and Market Momentum Indicator Guide
I still clearly remember the late-night trading session where I lost nearly three thousand dollars in under twenty minutes. It was 2:00 AM, my eyes were bloodshot, and I was staring at a massive green candle exploding upward on my chart.
Fear of missing out hit me hard. I slammed the buy button, convinced I was riding a rocket to easy profits. The moment my trade opened, the market stalled. Two minutes later, that giant green candle collapsed into a sharp red needle. My stop-loss got hit, my margin vanished, and I was left asking the exact question every beginner asks: Why does the market immediately reverse the second I place an order?
It took me almost two years of trial, error, and heavy losses to realize my core mistake. I was chasing price speed instead of measuring underlying momentum. I was buying at the exact moment the buyers were running out of breath.
When I finally learned how to read momentum indicators properly, my entire relationship with the market changed. I stopped gambling on random moves and started trading with surgical precision. Here is the exact blueprint I developed to turn momentum indicators into a reliable trading edge.
What Momentum Actually Is (And Why Your Indicators Keep Lying to You)
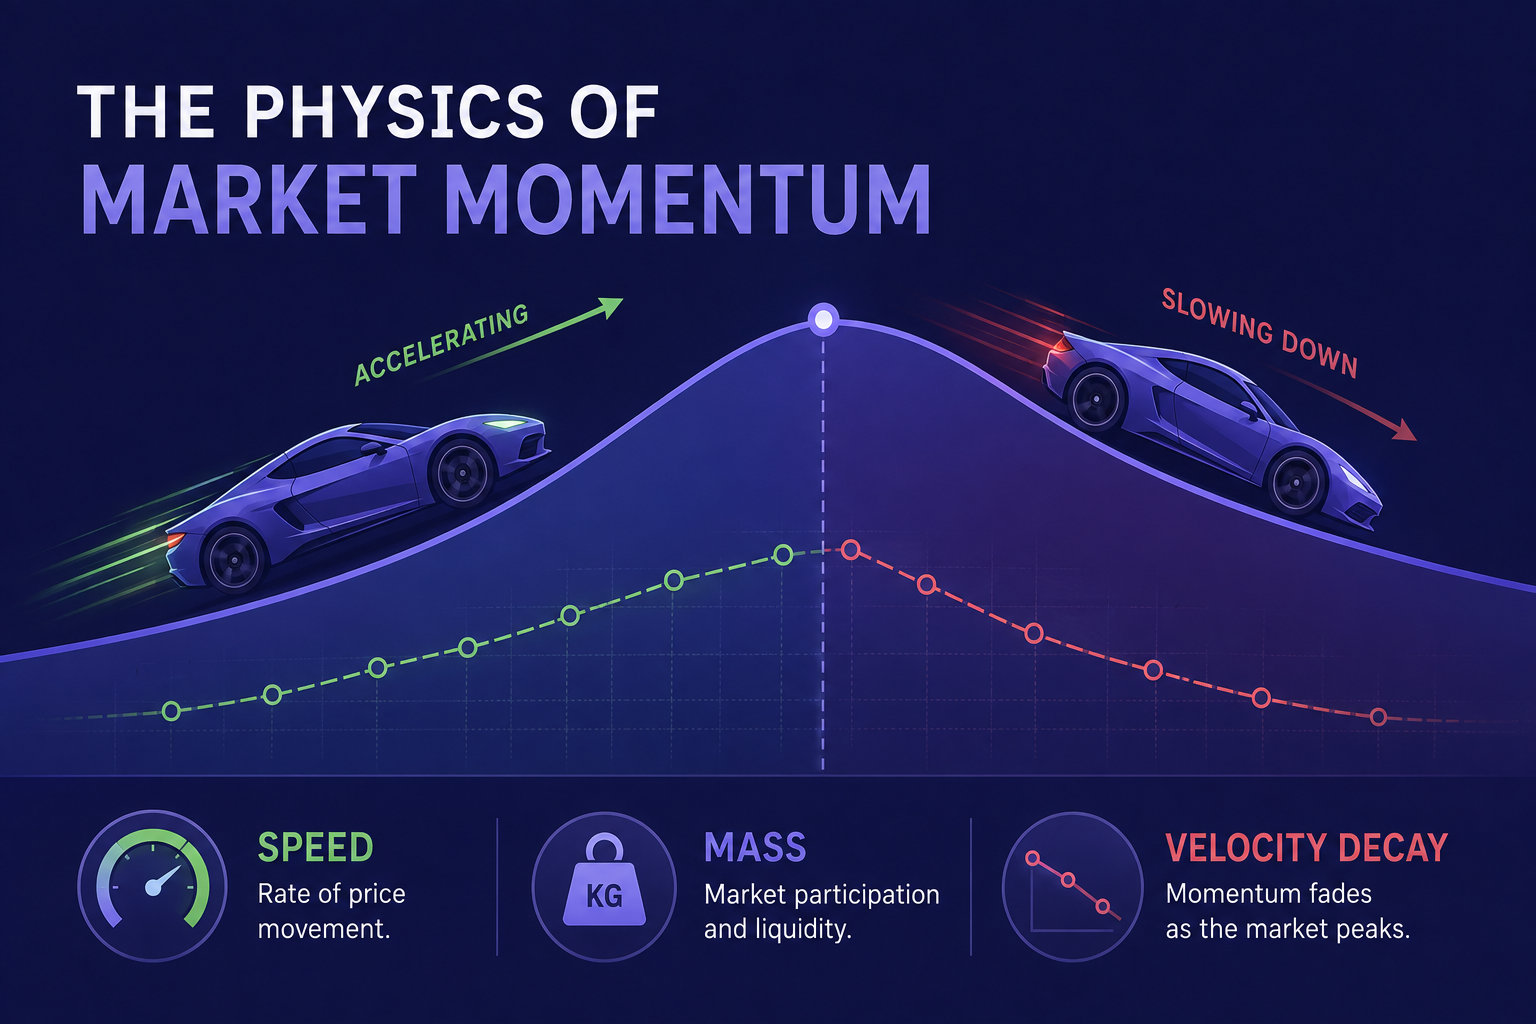
Most traders think momentum is simply how fast price moves. That is only half the story.
Think of momentum like throwing a baseball straight up into the air. When the ball leaves your hand, it travels fast. As it reaches its highest point, the ball is still moving upward, but its acceleration drops to zero before gravity pulls it back down.
In financial markets, price often continues making higher highs even when the underlying force pushing it upward is completely exhausted. When you buy at the peak of a green candle without checking momentum, you are grabbing the baseball right at the moment it pauses before dropping.
To build a consistent strategy, you need charting platforms that render price action and custom indicators smoothly without lagging. In my early backtesting phase, I spent hours practicing visual indicator setups across smooth chart interfaces like IQ Option to get a feel for real-time oscillator movements. For traders who focus heavily on fast-moving assets or volatility indices, platforms such as Deriv also offer excellent flexible charting setups to test these technical concepts
My Core Toolkit: Mastering RSI, MACD, and Stochastic Without Chart Clutter
Early in my trading journey, my charts looked like a colorful bowl of spaghetti. I had six different indicators cluttering my screen, each giving conflicting signals. It was pure sensory overload. Over time, I stripped everything down to three vital tools.
The Relative Strength Index (RSI) Re-imagined
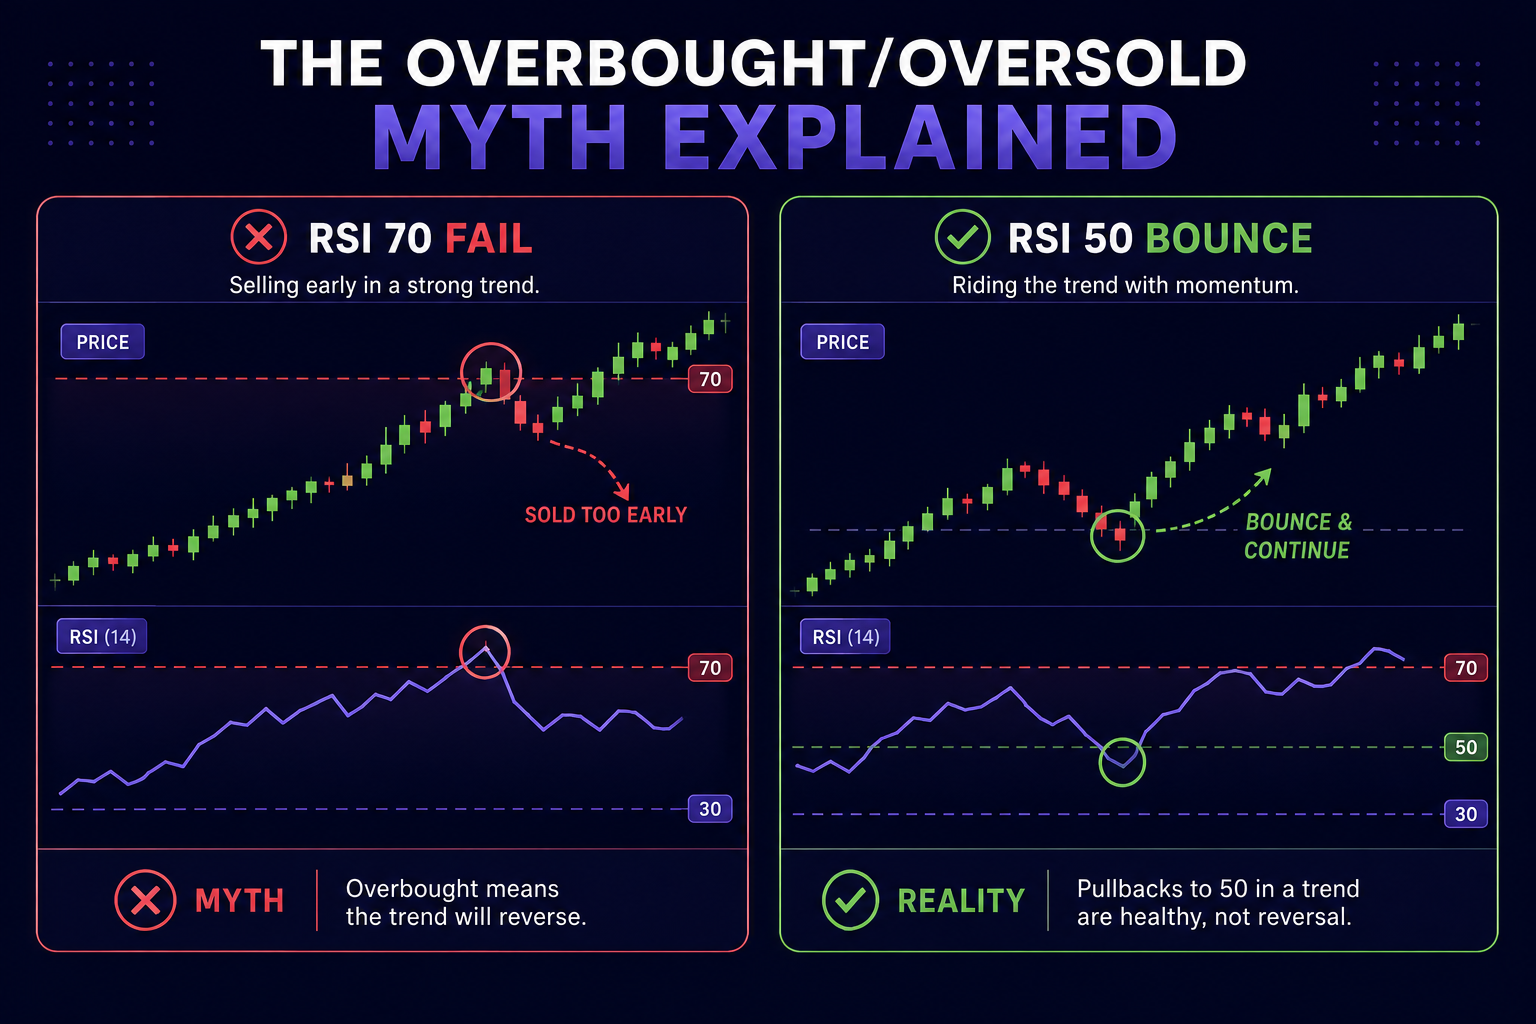
The standard textbook rule says to sell when RSI crosses above 70 (overbought) and buy when it drops below 30 (oversold). Following that rule blindly wiped out my first trading account.
In a strong trend, the RSI can stay overbought for days while price continues to skyrocket. Instead of looking at 70 and 30 as automatic reversal zones, I began using the 50 centerline as a momentum anchor.
When RSI holds above 50 and tests it as support, buyers are in complete control. I only look for short trades when RSI drops and stays below the 50 mark.
The Moving Average Convergence Divergence (MACD) Engine
The MACD measures the relationship between two exponential moving averages. While many traders wait for the slow signal line crossover, I focus on the histogram bars.
When the histogram bars start shrinking while price is still pushing higher, it tells me acceleration is fading. It gives me an advance warning that the current move is losing fuel well before the price chart shows a visible reversal candle.
The Stochastic Oscillator for Fine Tuning
The Stochastic Oscillator moves much faster than the RSI. I use it strictly for entry timing inside an established trend. If the higher timeframe trend is bullish and the RSI is above 50, I wait for the Stochastic to drop into oversold territory on a lower timeframe to enter at a discount.
Executing fast trades during high-volatility sessions requires reliable broker execution with zero lag. I often monitor price reaction on brokers like Quotex and ExpertOption, where quick execution helps capture momentum bursts right as the oscillator confirms the entry.
The Game Changer: How Divergence Turned My Strategy Into a High-Win-Rate Engine
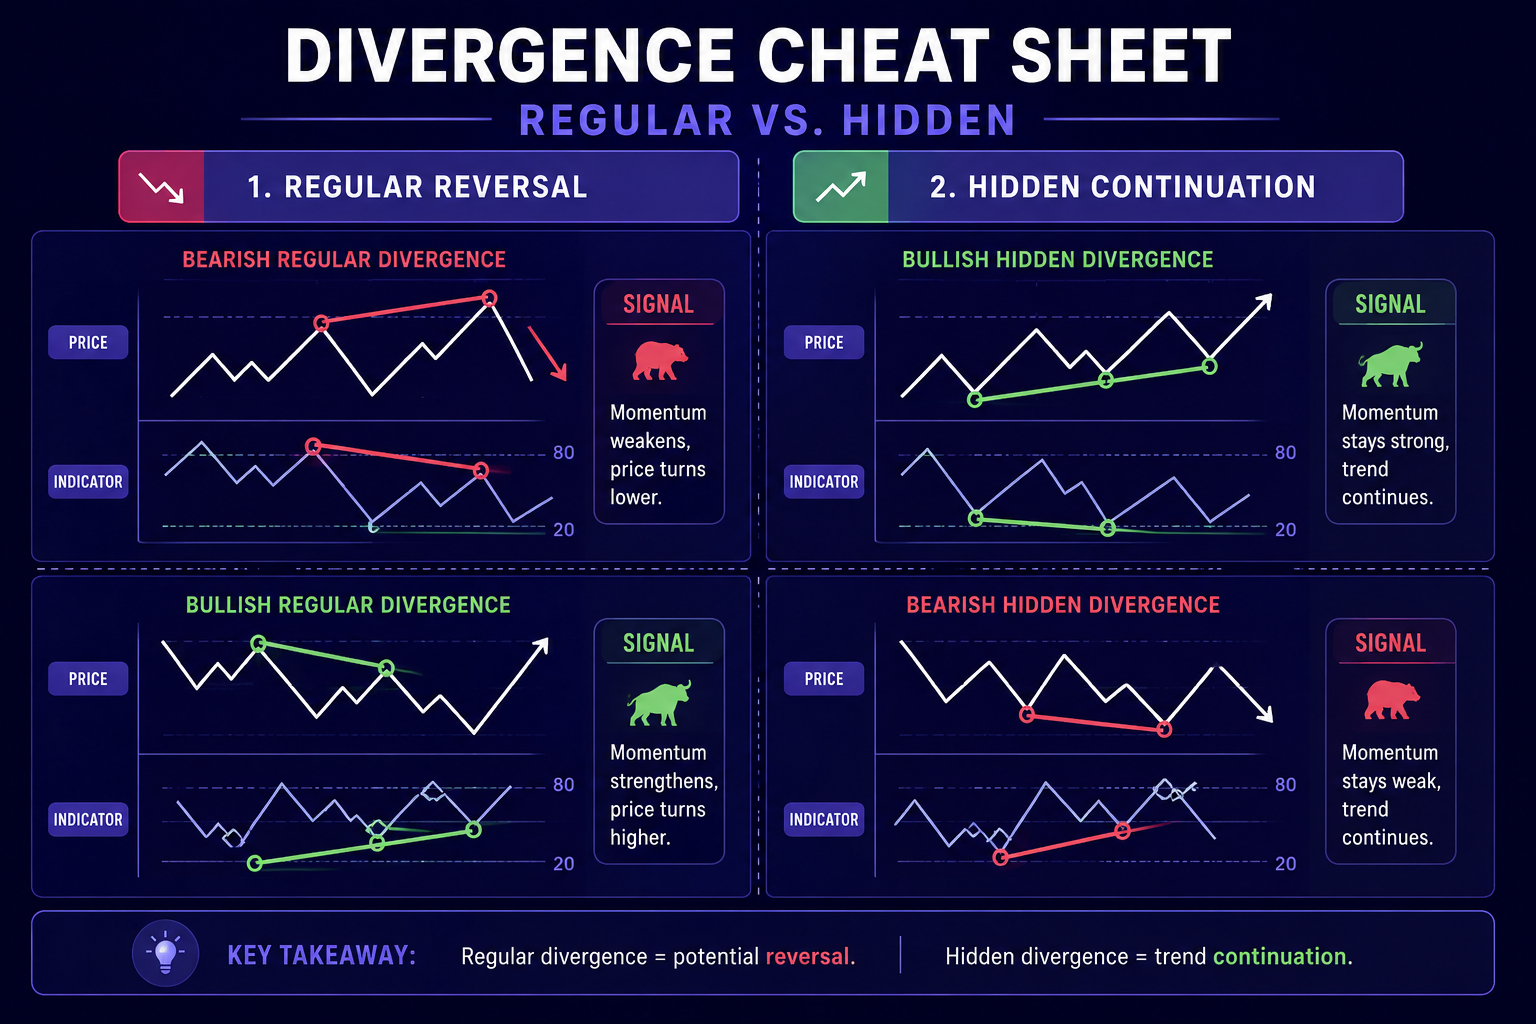
If I could only use one technical edge for the rest of my life, it would be momentum divergence. Divergence happens when price action and your momentum indicator disagree with each other. It is the closest thing to a market cheat code I have ever found.
Regular Divergence: Catching Reversals Early
Regular bearish divergence occurs when price makes a Higher High, but the RSI or MACD histogram makes a Lower High.
This tells you that even though price reached a new peak, fewer buyers participated in the move. The push was hollow. Whenever I spot regular divergence at a key historical support or resistance level, I prepare for a high-probability reversal trade.
Hidden Divergence: Riding Trend Continuations
While regular divergence spots reversals, hidden divergence reveals trend continuation.
In an uptrend, if price makes a Higher Low, but the RSI makes a Lower Low, you are looking at hidden bullish divergence. It indicates that sellers tried aggressively to push the market down, yet failed to beat the previous price low. It is my absolute favorite pattern for hopping back onto a strong trend.
Mastering these visual nuances takes practice across different asset classes. You can read deeper technical breakdowns on candle patterns and market structure on the BeCoin blog, where we regularly dissect real-time price setups.
My 3-Step Momentum Execution Blueprint
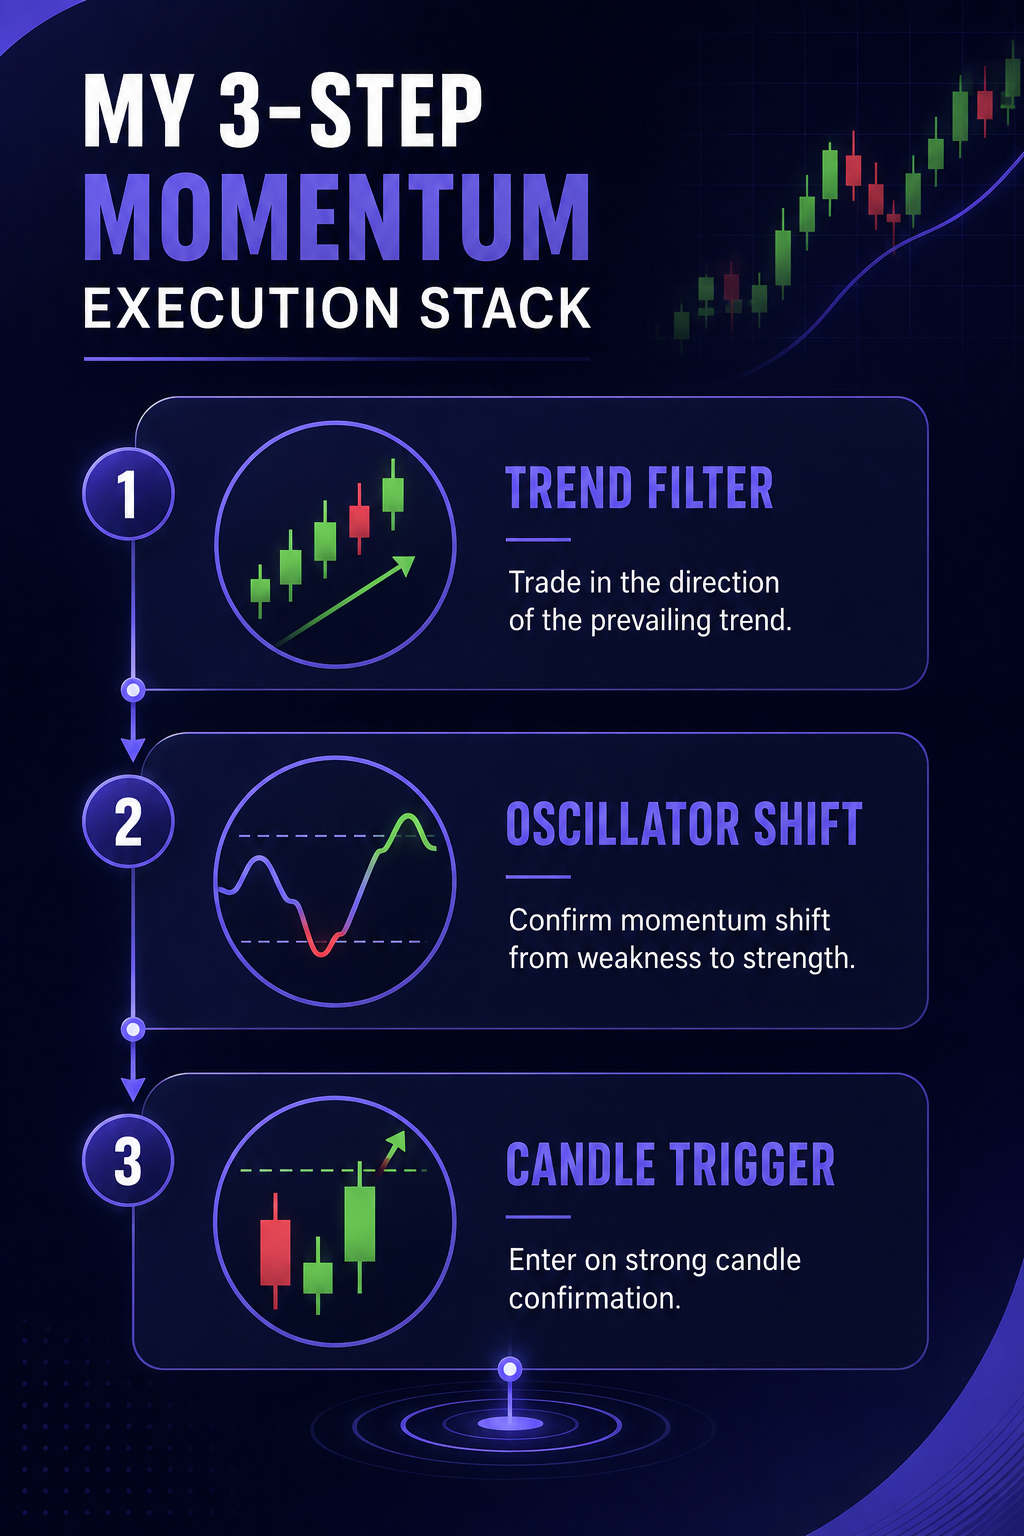
Having indicators on your chart is useless without a strict execution protocol. To remove emotion from my trades, I developed a simple three-step checklist that I follow every single time I place an order.
- Step 1: Identify the Higher Timeframe Trend. I start on the 4-hour chart to establish market direction. I check if the price is trading above the 50-period moving average and ensure the RSI sits above 50.
- Step 2: Locate Momentum Divergence. I drop down to the 15-minute or 1-hour chart and wait for regular divergence near key support or resistance, or hidden divergence in the direction of the main trend.
- Step 3: Confirm with a Trigger Candle. I never enter on an indicator signal alone. I wait for price confirmation, such as a strong pin bar or an engulfing candle, closing in my predicted direction.
When execution speed and platform reliability are critical, traders often choose established setups such as Olymp Trade or Pocket Option to execute their entries clean without slippage issues. For multi-asset institutional access and advanced order types, platforms like CapitalCore provide robust tools for serious technical traders.
The 3 Costly Mistakes That Kept Me Unprofitable for Years
Looking back at my trading journals, my lack of profitability was rarely due to market randomness. It was almost always self-inflicted through three recurring mistakes.
1. Treating Overbought Conditions as an Immediate Sell Signal
During strong market rallies, indicators can remain overbought for prolonged periods. Shorting a strong bull market just because the RSI reached 80 is a quick way to destroy your capital. Always wait for price action to confirm a shift before standing in front of a moving freight train.
2. Using Too Many Indicators of the Same Class
Loading your chart with RSI, Stochastic, and Williams %R simultaneously is redundant because all three measure velocity. They will tell you the exact same thing at the exact same time. Pair one momentum oscillator with price action levels and a moving average for trend context.
3. Ignoring Higher Timeframe Market Context
A perfect momentum signal on a 1-minute chart will fail miserably if it counters a massive trend on the 4-hour chart. Higher timeframe momentum always crushes lower timeframe noise.
Elevating Your Trading Edge with Real-Time Forecasts and BeCoin Premium
Learning to read momentum indicators independently is a crucial milestone for any trader. However, scanning dozens of pairs daily, tracking macroeconomic developments, and identifying institutional divergence setups manually can quickly become overwhelming.
To stay ahead of swift market turns, I regularly compare my personal chart analysis with comprehensive market data available on the BeCoin Forecast Hub. Having access to daily institutional projections and multi-asset sentiment metrics helps validate trades before risking capital.
If you are ready to transition from a retail guesser to a systematic trader, you do not have to do it alone. By joining BeCoin Premium, you gain direct access to in-depth analytical reports, real-time trade signals, premium forecast models, and a community of disciplined traders committed to long-term profitability. Stop guessing momentum and start trading with actionable data today.

The Clock and the Cash: My Journey into the Hidden Rhythm of Session-Based Trading
There was a time when I thought the global financial market was a single, monstrous wave that never stopped moving. I believed that if I sat in front of my monitors long enough, clicking buttons whenever a pretty pattern appeared on my charts, the market would eventually reward my sheer endurance. I was dead wrong. […]

Best Broker for Learning Price Action in 2026 (Tested by Real Traders)
Most traders think they need a better strategy. What they actually need is a better understanding of price. A few years ago, one of our community members had over ten indicators on his chart. RSI. MACD. Moving averages. Bollinger Bands. Stochastic. Every new YouTube video added another indicator. The result? More confusion. Not more profits. […]

How Liquidity Affects Day Trading Results
When I first started trading day trading, I believed success was all about finding the perfect indicator. I spent weeks testing moving averages, RSI settings, support and resistance levels, and dozens of YouTube strategies that promised easy wins. Some worked for a few trades, but most failed. What confused me was that the same setup […]

The Clock and the Candle: How I Stopped Guessing the Best Time to Trade Day Trading
I still remember the night I blew my third trading account. It was 11:30 PM. The house was completely quiet, the market charts on my screen were barely crawling, and I was forcing trades out of pure impatience. I kept staring at a flatline asset, placing one-minute positions, convinced that the market owed me a […]

Which Broker Has Better Risk Management Tools?
The burning smell of my own account blowing up is a scent I will never forget. It was a rainy Tuesday afternoon a few years back. I sat huddled over my laptop, watching a currency pair oscillate. Confident, arrogant, and entirely unprotected, I clicked buy. Minutes later, a sudden market spike completely wiped out my […]