AUD/NZD Presses 1.2050 With 1.2130 as the Line Bears Cannot Give Up
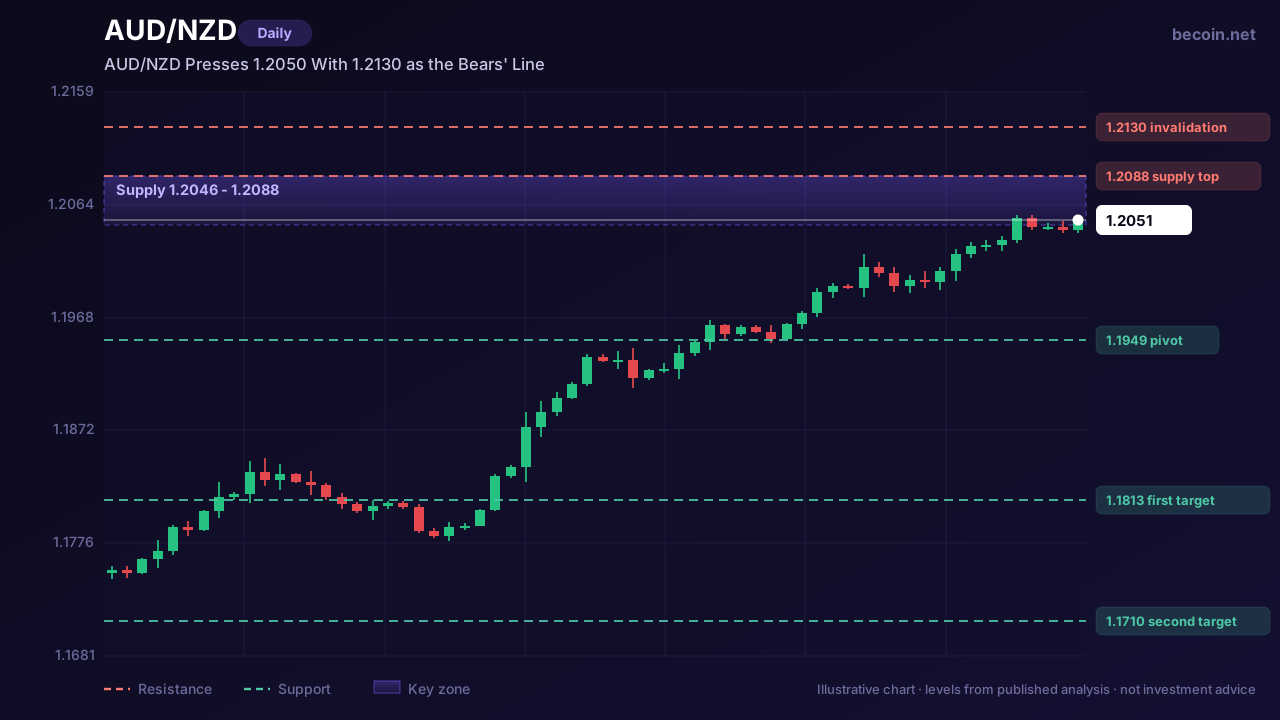
AUD/NZD sits at 1.2051, up a fraction on the day, and it has arrived at the one place on the chart where the last several months of price action have repeatedly stopped. The 1.2046 to 1.2088 band has turned back attempt after attempt. Price is inside it again.
A pair that pays you to be patient
Antipodean crosses are not fast movers, and AUD/NZD is the slowest of the group. Both currencies respond to the same commodity cycle, the same China demand impulse and broadly similar central bank reaction functions, which means the pair spends most of its life compressing rather than trending. That frustrates traders who want daily range, but it makes the eventual breaks unusually clean when they come, because so much positioning accumulates inside the coil.
The practical consequence is that levels matter more here than momentum does. A momentum signal on a pair that moves forty pips a day is mostly noise. A weekly close outside a range that has held for a quarter is information.
What separates this attempt from the last
Two things. First, the approach has been steadier — a sequence of higher lows rather than a single vertical push, which usually means the buying is real rather than a squeeze. Second, price is testing the zone rather than spiking through and rejecting, which is what happened on the previous two visits. Our Becoin.net Premium Forecast tracks this pair through each of those levels session by session.
Against that, the pair is still below 1.2130, and that is the number that matters. Sellers working this zone have generally used a daily close above roughly 1.2130 as their line, and price has not challenged it. Until it does, the bearish structure on the higher timeframe is technically intact, however uncomfortable it looks from inside the zone.
The AUD/NZD downside map if 1.2130 holds
If the zone does its job again, the path down is well signposted. The first shelf is the 1.1949 pivot, which has acted as both support and resistance this year and is the natural place for a first reaction. Below that, 1.1813 is the more meaningful objective — it is where the previous consolidation began and where a measured move from the current supply band projects. A deeper flush targets 1.1710, which would take the pair back to the bottom of its multi-month range.
Note that these are three separate destinations, not one trade. Traders who treat 1.1710 as the target from 1.2050 are asking a slow pair to travel 340 pips without a pause, which is not how this cross behaves. Working the move in stages, with the pivot levels as decision points, matches the instrument better.
When to abandon the short thesis
A daily close above 1.2130 is the cleanest invalidation available. It would mean the zone that has organised the entire range has failed on a closing basis, and the next real friction is not until the 1.22 handle. At that point the correct response is not to widen the stop and hope — it is to accept that the range broke and let the market prove where the new one is.
There is also a fundamental version of the same trigger. This cross is essentially a bet on the relative path of two central banks. If the rate differential starts moving decisively in the Aussie's favour — through a hawkish RBA shift, a dovish RBNZ turn, or both — the technical zone will eventually give way regardless of how many times it has held. Levels hold until the reason they existed stops being true.
Access levels for the daily level maps, scenario updates and alerts are set out on Becoin.net Tariff Plans.
This is market analysis for educational purposes and is not investment advice. Trading carries risk of loss.

The Rookie Dashboard: My Raw Hunt for the Best Beginner Broker in 2026
We have all been there. It is late at night, your morning coffee is hours away, and you are staring at a screen pulsing with bright green and red lines. You have twenty dollars burning a hole in your digital wallet and a sudden, burning desire to conquer the financial markets. That was me exactly […]

Finding My Perfect Workspace: The Search for the Best Broker for My Daily Trading Routine
The alarm goes off at 6:00 AM. By 6:30 AM, I am sitting in front of my monitors with a steaming mug of black coffee. The house is completely quiet, the market is preparing its next major move, and my charts are completely bare. This is my daily sanctuary. For a long time, this morning […]

Is Capital Core Safe or a Scam? What Day Traders Should Know Before Depositing
I’ll be honest: the first time I landed on Capital Core, I didn’t feel excited. I felt suspicious. That might sound strange coming from someone who has spent years around day trading and offshore brokers, but if you’ve traded long enough, you know the pattern. A polished homepage. Big payout claims. A low minimum deposit. […]

Trading Currency Strength Instead of Single Pairs
It was a Tuesday afternoon when I realized I was fighting a losing battle against a ghost. My screen was a chaotic web of indicators. I had the EUR/USD chart open, a moving average crossing over here, a relative strength index flashing oversold there, and a price action setup that looked textbook perfect. I clicked […]

How Liquidity Affects Day Trading Results
When I first started trading day trading, I believed success was all about finding the perfect indicator. I spent weeks testing moving averages, RSI settings, support and resistance levels, and dozens of YouTube strategies that promised easy wins. Some worked for a few trades, but most failed. What confused me was that the same setup […]

The Clock and the Cash: My Journey into the Hidden Rhythm of Session-Based Trading
There was a time when I thought the global financial market was a single, monstrous wave that never stopped moving. I believed that if I sat in front of my monitors long enough, clicking buttons whenever a pretty pattern appeared on my charts, the market would eventually reward my sheer endurance. I was dead wrong. […]