Amazon Stock Forecast: 253 Support Keeps 288 in View
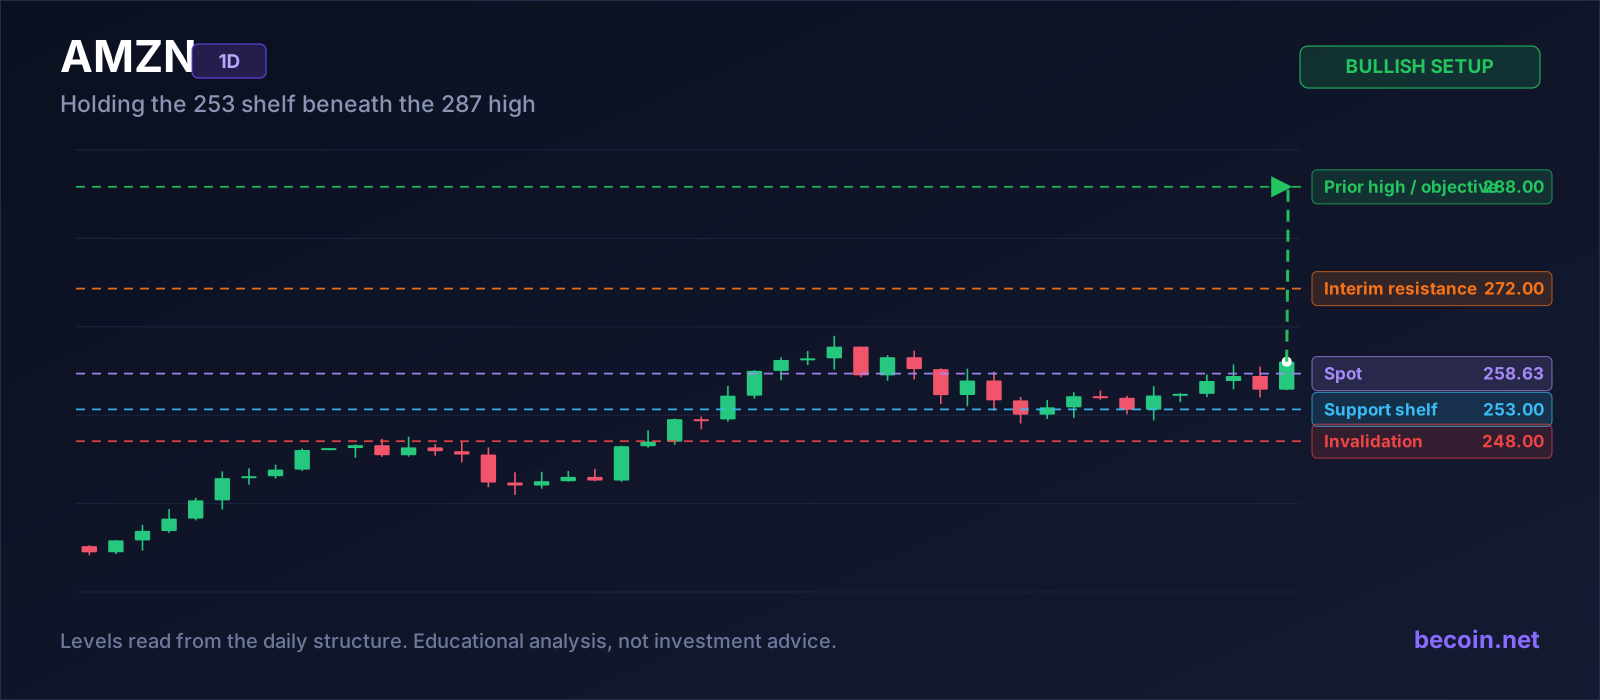
Amazon has quietly done a lot of work this summer. The stock is up roughly ten percent over the past month and about twenty-six percent across six, and it printed a 52-week high at 287.20 in early August before easing back. At 258.63 the shares are sitting on the shelf that matters, roughly ten percent below that high, with the structure still constructive rather than broken.
What this Amazon stock forecast rests on
The technical case is simple: a multi-week base has formed between 253 and 258, and it has held every test so far. That band is where the last consolidation broke out from, so it carries the orders of everyone who bought the move. As long as the daily closes stay above it, the pullback from 287 is a normal correction within an uptrend rather than a distribution top.
The fundamental backdrop supports the read rather than contradicting it, which is not always the case. AWS growth accelerated to thirty-seven percent year on year and group revenue reached 200.6 billion dollars in the latest quarter, up twenty percent. A cloud business that is accelerating rather than decelerating is the reason the market has been willing to defend a higher base after each leg.
The levels that matter
| Level | Price | Why it matters |
|---|---|---|
| Prior high / objective | 288.00 | The August peak and the natural upside target |
| Interim resistance | 272.00 | Where the pullback began; first obstacle on the way back |
| Spot reference | 258.63 | Just above the base, inside the correction |
| Support shelf | 253.00 | Breakout origin; has held every retest |
| Invalidation | 248.00 | Below the base; the uptrend structure is gone |
The constructive path
The straightforward version of this idea is to treat 253 to 258 as the entry zone rather than chasing strength. A stop beneath 248 gives roughly ten dollars of risk against nearly thirty to the prior high, and the level is easy to monitor because it is horizontal rather than diagonal. Traders who want confirmation instead of a good price can wait for a daily close above 272, which would signal the correction is finished.
What would make the setup stronger is a multi-week hold rather than an immediate bounce. Bases that spend time above a level tend to produce more durable moves than bases that spike off it, because time above a price is how ownership changes hands.
Where the idea breaks
A daily close beneath 248 would end it. That would put the stock back inside the range it broke out of and turn 253 from support into resistance, with the previous consolidation in the low 240s as the next reference. It would also suggest the market has stopped rewarding the AWS acceleration story, which is a bigger signal than the level itself.
The near-term risk is the broader tape rather than the company. Participation across the index has been narrowing and the market has shown a risk-off tilt, and in that environment even well-supported large caps get sold alongside everything else. A base is only as reliable as the conditions around it.
Turning it into a plan
Mark 253, 272 and 288, decide whether you are buying the shelf or the confirmation, and size the position off the distance to 248 rather than off the strength of the fundamental story. The numbers justify holding the stock. Only the levels tell you where to be wrong.
For a modelled equity projection to compare with your own read, the Becoin.net Premium Forecast tracks major single names alongside the simulator, and the access tiers are listed on the Becoin.net Tariff Plans page.

Binomo Demo vs Real Account: What Changes After You Deposit (KYC, Payout, Support, Limits)
I spent far too long thinking my Binomo demo results meant I was “ready.” On demo, everything felt clean. My entries looked sharp. My timing looked better than it probably was. I could reset virtual balance, test ideas, and convince myself I had control. Then I made my first real deposit, and that’s when I […]
Deriv Day Trading vs Offshore Brokers: Execution Model Comparison
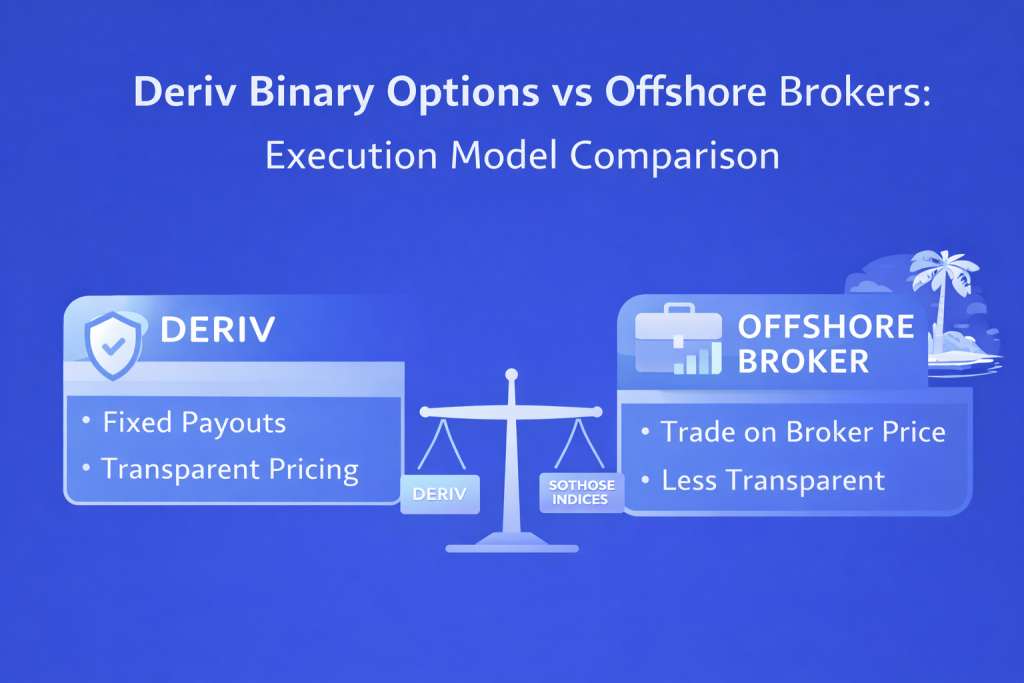
I did not start my trading journey thinking about execution models. Like most beginners, I started with charts, indicators, and the belief that if I could just find the right entry signal, profits would follow. My early trading notebook was full of screenshots of RSI signals, candlestick patterns, and support levels. What it did not […]

Alphabet falls to $329.71 premarket as AI spending eclipses cloud growth
Alphabet traded near $329.71 premarket after strong Q2 revenue and cloud growth collided with a much larger AI spending plan. What investors need to watch.

How Liquidity Affects Day Trading Results
When I first started trading day trading, I believed success was all about finding the perfect indicator. I spent weeks testing moving averages, RSI settings, support and resistance levels, and dozens of YouTube strategies that promised easy wins. Some worked for a few trades, but most failed. What confused me was that the same setup […]

Why Market Open Hours Create the Best Trading Opportunities
I used to think trading was a 24-hour conveyor belt of endless cash. In my earliest days, armed with a laptop, a hot cup of coffee, and far too much unearned confidence, I would stare at charts at 11:00 PM on a Tuesday. The candles barely moved. They crawled across my screen like snails on […]

The Clock and the Cash: My Journey into the Hidden Rhythm of Session-Based Trading
There was a time when I thought the global financial market was a single, monstrous wave that never stopped moving. I believed that if I sat in front of my monitors long enough, clicking buttons whenever a pretty pattern appeared on my charts, the market would eventually reward my sheer endurance. I was dead wrong. […]