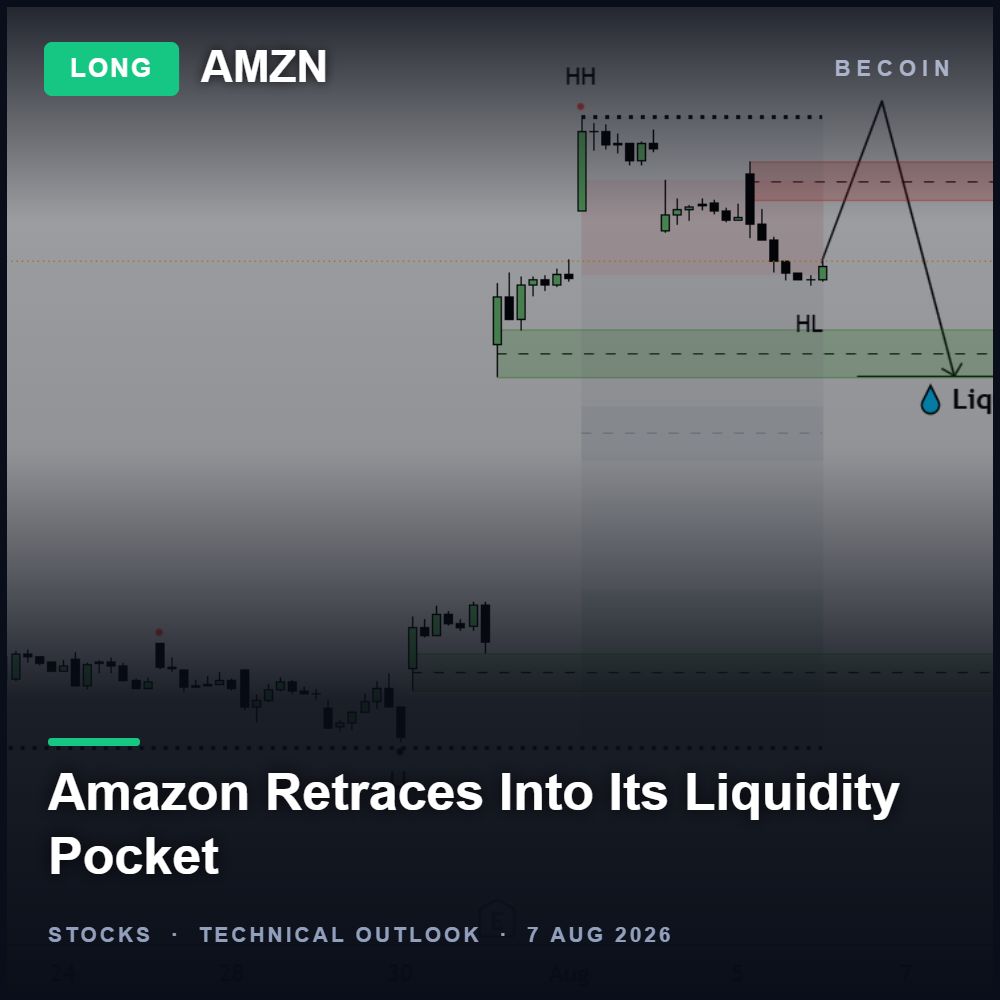
Amazon Pulls Back Into Its Liquidity Zone — The Level That Keeps the Uptrend Alive
The breakout was real; the pullback is normal
Amazon has been one of the cleaner large-cap charts of the past month. Price broke impulsively out of its previous range, printed a fresh higher high, and has since drifted back down in a slower, more overlapping fashion. That difference in character matters. Impulsive moves up followed by corrective moves down is the textbook signature of a healthy trend, and it is the reason a retracement of this shape should not be confused with a reversal.
Where the market has to defend
The area that decides the next phase sits just below current price, in the demand pocket highlighted on the chart shared with you on 7 August. It is the zone where the last leg higher originated, which means it holds unfilled buying interest and sits above the most recent higher low. If institutional demand is still present in this name, that is where it should reveal itself. Holding it keeps the sequence of higher highs and higher lows intact.
The bullish continuation case
Should buyers step in there, the natural path is a rotation back toward the overhead resistance band that stopped the last advance, followed by an attempt on the prior swing high. Breakout, retest, continuation is the most common way trending stocks travel, and Amazon currently has all three ingredients in place. The nuance is that confirmation should come from price behaviour at the zone, not from the zone existing.
What a failure would mean
A sustained move beneath the demand area changes the message. It would take out the recent higher low, break the structure that has supported the advance, and open the door to a deeper retracement toward the next shelf below. That would not automatically turn Amazon bearish, but it would remove the justification for treating this as a simple pause in an uptrend.
How to approach it
The temptation with a chart like this is to anticipate the bounce. The more durable approach is to wait for a reaction: a rejection candle, a shift back to higher lows on a lower timeframe, or a reclaim of the level after a brief sweep beneath it. Large-cap technology names also carry index correlation risk, so a broad market drawdown can override a perfectly valid single-stock setup.
Bottom line
Amazon is doing what strong trends do, which is give back part of a move before deciding whether to extend it. The demand zone underneath price is the whole argument: defended, and the prior high comes back into range; lost, and the correction has further to run. This is analysis rather than investment advice, and single-stock positions carry company-specific risk.
Becoin.net Premium Forecast AMAZON - Becoin.net Premium Plan

Which Broker Has Better Risk Management Tools?
The burning smell of my own account blowing up is a scent I will never forget. It was a rainy Tuesday afternoon a few years back. I sat huddled over my laptop, watching a currency pair oscillate. Confident, arrogant, and entirely unprotected, I clicked buy. Minutes later, a sudden market spike completely wiped out my […]

How Understanding Market Structure Saved My Day Trading
I remember the exact moment my trading account hit zero for the third time in a single month. It was a rainy Tuesday evening, and I was staring at a 1-minute chart on my laptop screen. The price had been moving up aggressively. It looked like a flawless rocket ship to the moon. I clicked […]

The Clock and the Cash: My Journey into the Hidden Rhythm of Session-Based Trading
There was a time when I thought the global financial market was a single, monstrous wave that never stopped moving. I believed that if I sat in front of my monitors long enough, clicking buttons whenever a pretty pattern appeared on my charts, the market would eventually reward my sheer endurance. I was dead wrong. […]

The Clock and the Candle: How I Stopped Guessing the Best Time to Trade Day Trading
I still remember the night I blew my third trading account. It was 11:30 PM. The house was completely quiet, the market charts on my screen were barely crawling, and I was forcing trades out of pure impatience. I kept staring at a flatline asset, placing one-minute positions, convinced that the market owed me a […]

The Day I Stopped Trading and Finally Started Making Money
It was a rainy Tuesday morning, and I was staring at my screen with a familiar knot in my stomach. The previous three days had been a slow, agonizing slide into the red. I had given back two weeks of hard-earned profits in less than seventy-two hours. Every asset I clicked on looked like a […]

Finding My Perfect Workspace: The Search for the Best Broker for My Daily Trading Routine
The alarm goes off at 6:00 AM. By 6:30 AM, I am sitting in front of my monitors with a steaming mug of black coffee. The house is completely quiet, the market is preparing its next major move, and my charts are completely bare. This is my daily sanctuary. For a long time, this morning […]