Aave Forecast: $90 Support Guards the Path to the $105 Gate
Aave Forecast: A Coil With a Clear Trigger
Aave has spent the last several weeks doing something more constructive than its price action suggests. Each pullback has bottomed a little higher than the one before it, while each rally has stalled in the same place. That combination produces a compression pattern, and compression patterns end with a move rather than a fade. The published setups circulating on this token disagree about direction but agree almost perfectly about the levels, which is the useful part.
The $90 Zone Is Doing the Heavy Lifting
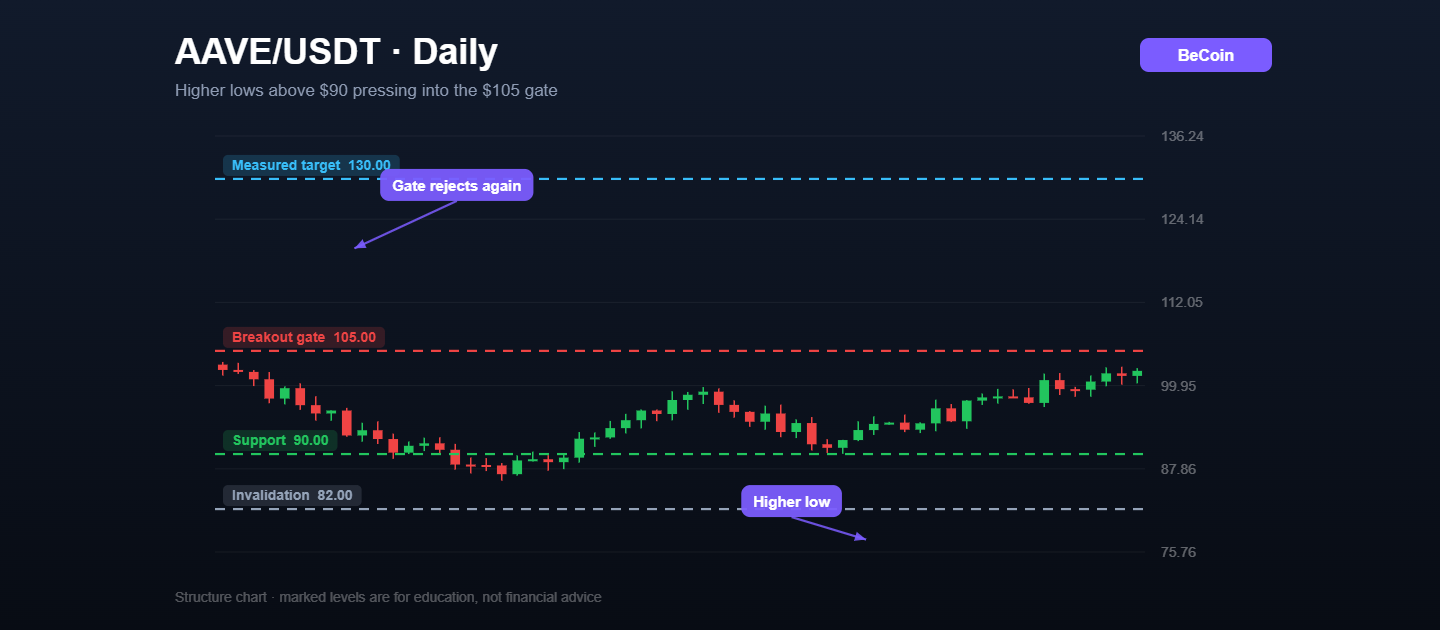
Support between $86 and $92 has been tested repeatedly, and each test has been shallower than the last. A rising trendline drawn from the recovery low now intersects that same band, giving buyers two reasons to defend it instead of one. Long setups posted around Aave anchor entries there, with stops below $82 rather than $86, because the wick tolerance in this token is wide enough to punish anyone using a tight technical stop on a round number.
$105 Is the Gate, Not the Target
Every rally since the recovery began has died between $103 and $105. Until Aave produces a daily close above that band, the higher-low structure is a coil rather than a trend. Once it does, the measured move from the range gives a projection into the $117 to $130 area, which is where the more optimistic published targets sit. Traders should note the sequencing: the gate comes first, the target comes second, and skipping the first step is how people end up long into resistance.
The Fundamental Layer Underneath
Aave is not a narrative token in the way meme coins are. Its price tends to track lending demand across the wider DeFi ecosystem, total value locked, and the general appetite for on-chain leverage. When borrowing activity picks up, revenue expectations improve and the token behaves like a levered bet on crypto risk appetite. When activity flatlines, Aave grinds sideways regardless of how good the chart looks. That is why the current compression coincides with a market that has not yet chosen a direction.
How the Setup Is Usually Framed
The common structure is accumulation between $88 and $95 with invalidation on a daily close beneath $82, a first objective at $103, and continuation toward $117 and $130 only once $105 breaks and holds on a retest. The short version of the trade is the mirror image: fade $103 to $105 with a stop above $108 and a target at $94. Both are valid; running both at once is not. For levels that update as the coil resolves rather than sitting static on a screenshot, Becoin.net Premium Forecast maps the same structure across the major DeFi tokens, and Becoin.net Tariff Plans outlines which access tier fits a position-trading approach.
The Line That Ends the Thesis
A daily close under $82 removes the rising trendline, the higher-low sequence and the entire bullish framing in one move. Below that, $76 becomes the next area worth watching, and patience beats conviction.

How Liquidity Affects Day Trading Results
When I first started trading day trading, I believed success was all about finding the perfect indicator. I spent weeks testing moving averages, RSI settings, support and resistance levels, and dozens of YouTube strategies that promised easy wins. Some worked for a few trades, but most failed. What confused me was that the same setup […]

How Understanding Market Structure Saved My Day Trading
I remember the exact moment my trading account hit zero for the third time in a single month. It was a rainy Tuesday evening, and I was staring at a 1-minute chart on my laptop screen. The price had been moving up aggressively. It looked like a flawless rocket ship to the moon. I clicked […]

How I Learned to Sit on My Hands During Choppy Markets
I remember the morning vividly. It was a Tuesday. The coffee on my desk was still piping hot, the charts on my screen were blinking, and I was feeling incredibly confident. I had just finished reading about how market open hours create the best trading opportunities, and I was ready to hunt for a clean […]

IQ Option vs Deriv Chart Comparison
The Night I Realized My Charts Were Lying to Me It was three in the morning, the exact hour when the market looks either like a goldmine or a psychological hazard. I was sitting in front of two monitors, a lukewarm mug of coffee in hand, watching a critical support level on EUR/USD. On my […]

Best Broker for One Trade a Day Strategy in 2026
Most traders lose money because they trade too much. They enter random setups, chase candles, overreact emotionally, and turn a simple strategy into pure gambling. That is exactly why the one trade a day strategy is becoming more popular among smart traders in 2026. Instead of sitting in front of charts all day, this approach […]

Binomo vs IQ Option Mobile App Comparison 2026: Which Trading App Is Better for Beginners?
Mobile trading is no longer a backup option for traders. For many beginners, the smartphone app becomes the main trading workstation. Whether you are entering quick trades during a lunch break or analyzing charts late at night, the quality of a broker’s mobile app can directly impact your results. Two platforms that continue to dominate […]