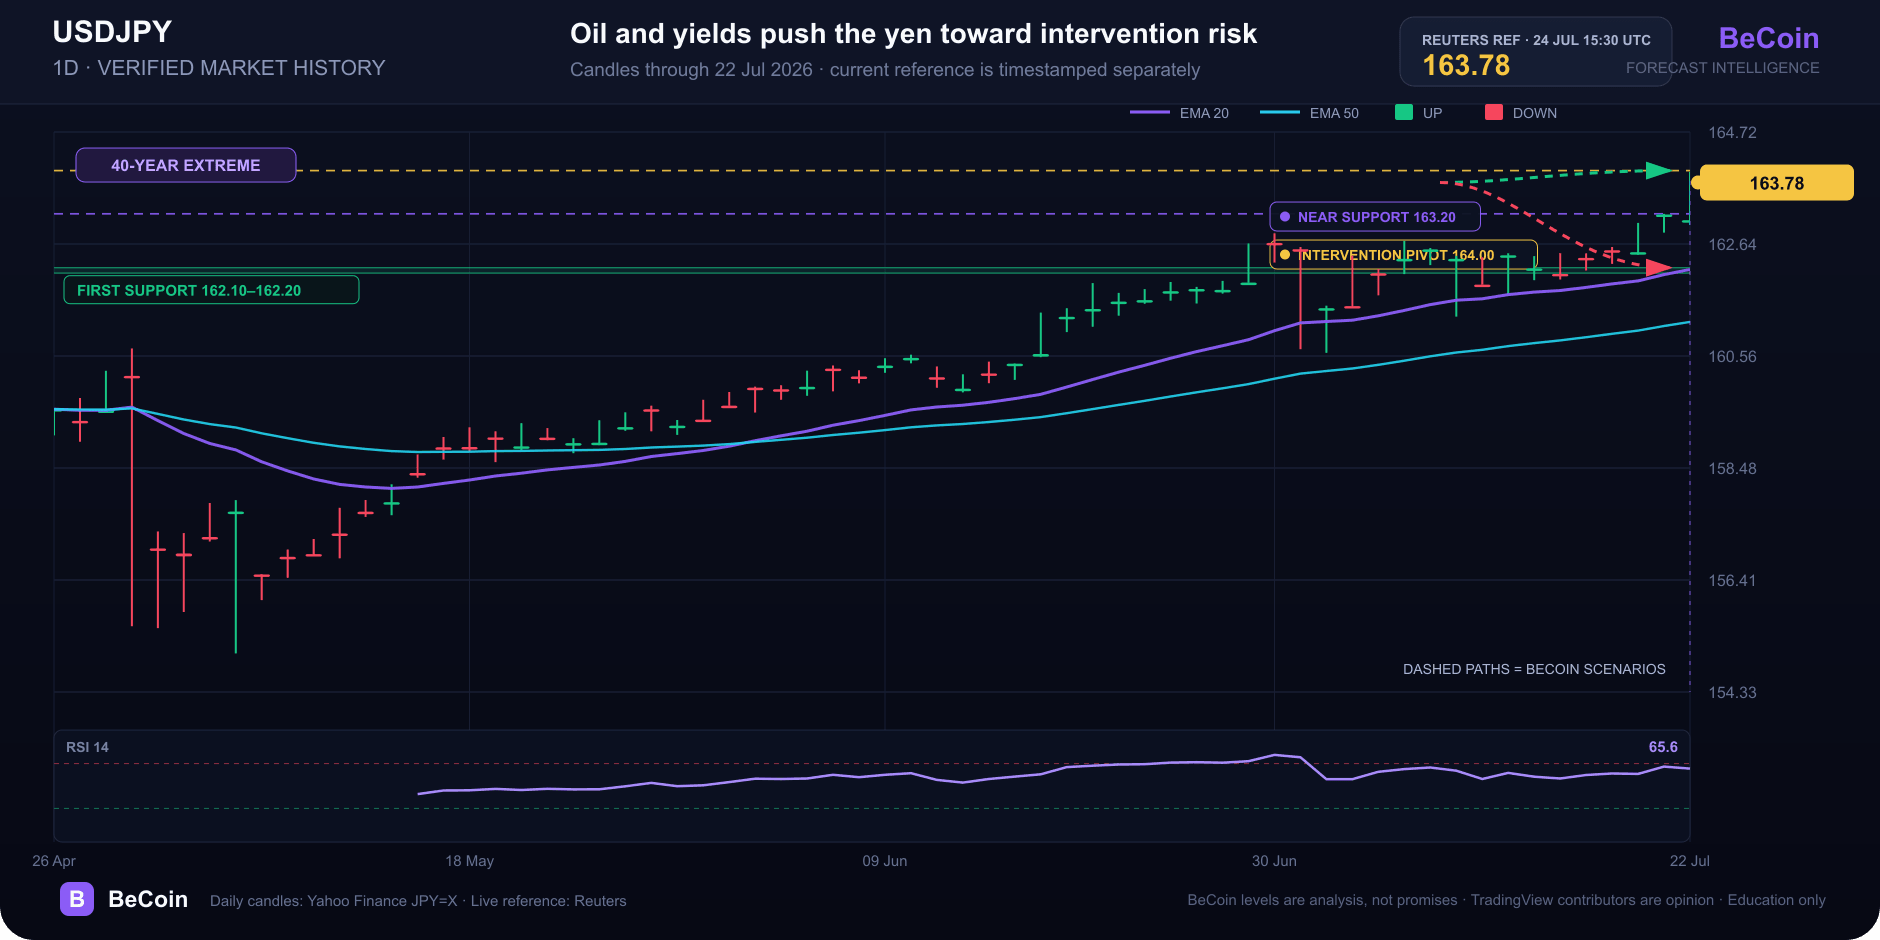
USD/JPY reaches 163.78 as oil shock pushes yen toward intervention risk
USD/JPY traded at 163.78 on July 24, after touching 163.98 on Thursday—the dollar’s strongest level against the yen since November 1986, according to Reuters. The pair is now testing the 164 area while Japan repeats that it is ready to act against excessive currency moves.
Why it matters
Japan imports most of its energy, so a higher oil price worsens its terms of trade. The yen is also a low-yielding currency while U.S. yields have risen on renewed inflation and Federal Reserve hike expectations. That combination supports USD/JPY even when intervention warnings intensify.
Reuters reported the dollar up nearly 0.9% against the yen for the week and markets pricing out a Bank of Japan hike at next week’s meeting. Google’s top results emphasized the 40-year low, Treasury pressure for BOJ hikes and intervention. BeCoin adds the level map and explains why verbal support alone has had limited effect.
Technical and market context
The immediate ceiling is 163.98–164.00. A sustained break opens a technically thin area, but intervention risk rises rather than falls as the pair accelerates. The first support is 163.20, followed by 162.10–162.20.
A July 21 TradingView idea called 162.80 and 163.20 resistance; price has already moved above both, so that bullish opinion is stale as a resistance map. A separate bearish contributor identified 162.20 as the first intervention-sensitive objective. That remains an opinion, not an official intervention level.
BeCoin forecast read
BeCoin’s base case is unstable consolidation between 162.20 and 164.00. The bull case needs a close above 164 without coordinated policy action. The bear case begins below 163.20 and becomes meaningful below 162.20. Any official intervention can produce gaps that bypass technical levels.
Follow USD/JPY forecasts and compare currency risk on the Forecast Hub.
Methodology and sources
Spot, weekly change and policy context: Reuters currency report dated July 24 and updated before the 15:45 UTC cutoff. Google results were reviewed July 24; no People Also Ask module appeared for the exact query. TradingView USDJPY ideas dated July 17–22 are opinion only.
This content is for education only and is not financial advice.
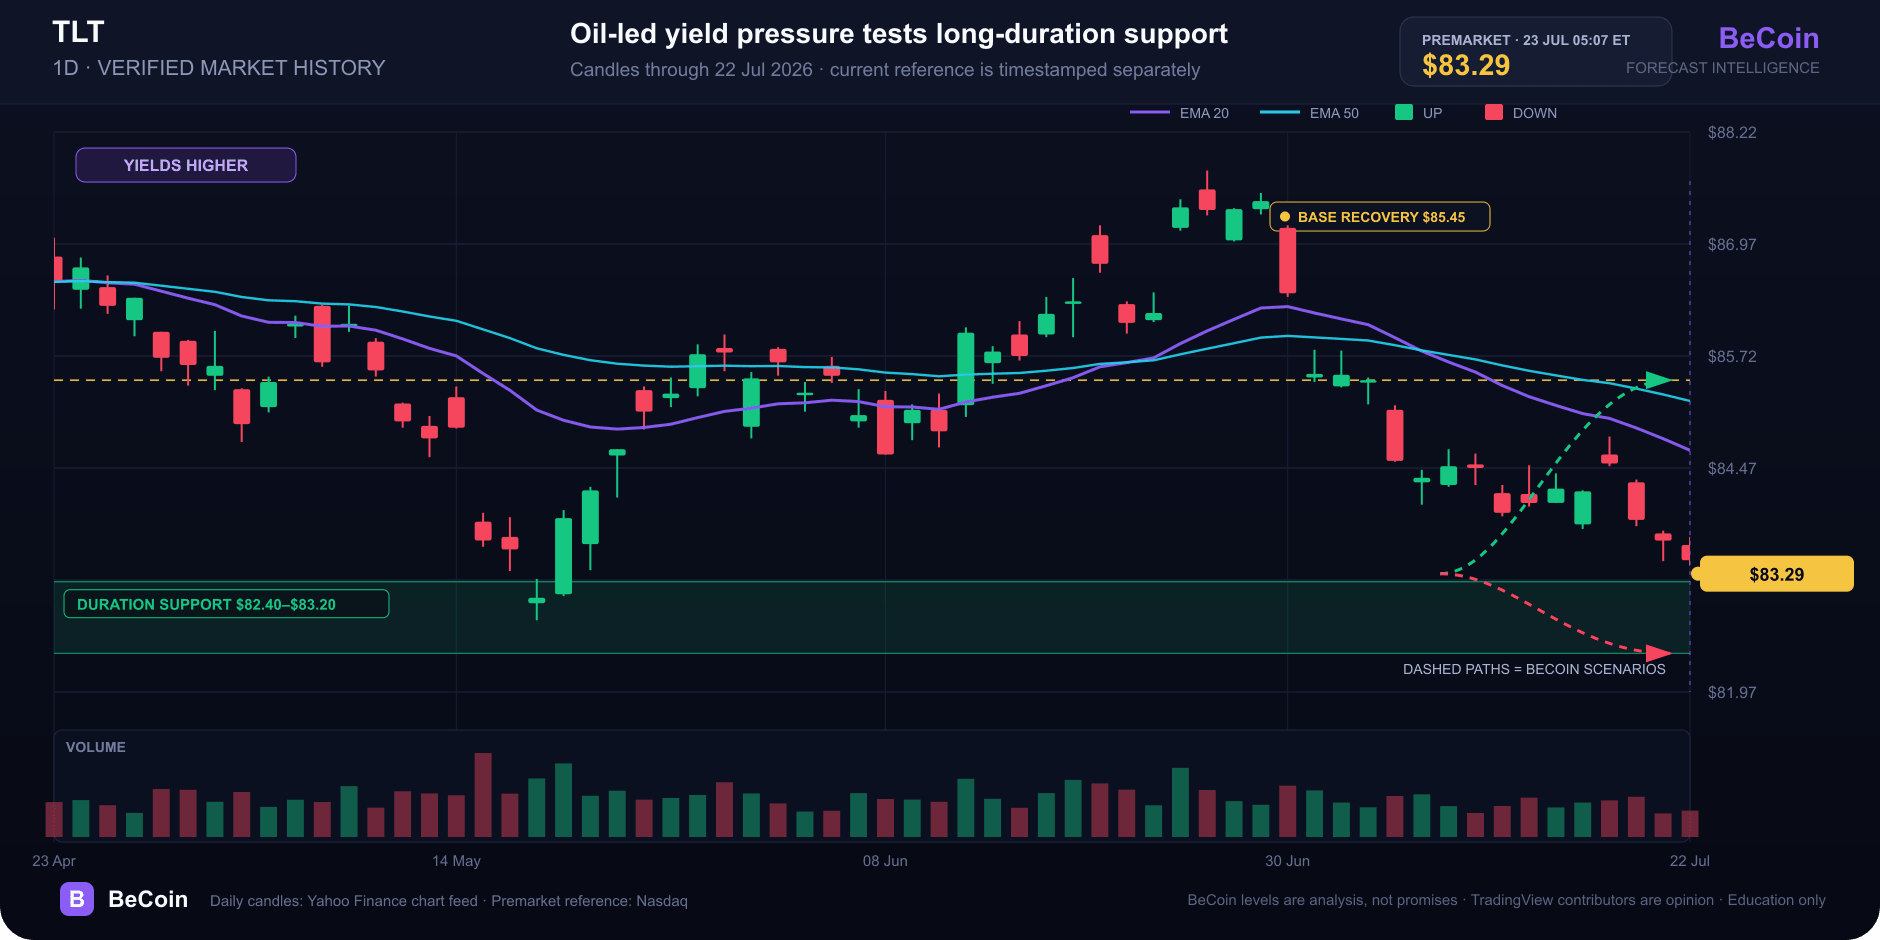
TLT slips to $83.29 as oil pushes long-duration risk back into focus
TLT traded near $83.29 premarket as oil and Treasury yields rose. Here is why duration matters and which levels separate a base from a breakdown.

EUR/USD holds 1.1414 before the ECB decision: three scenarios
EUR/USD traded near 1.1414 before the ECB’s July decision. Here is what a hold, hawkish hold or surprise hike could mean for 1.1350 and 1.1480.

WTI reaches $89.43 as Brent clears $95 on renewed supply risk
WTI traded near $89.43 while Brent moved above $95 as Middle East shipping risk lifted crude for a fifth session. Key levels, catalysts and invalidation.
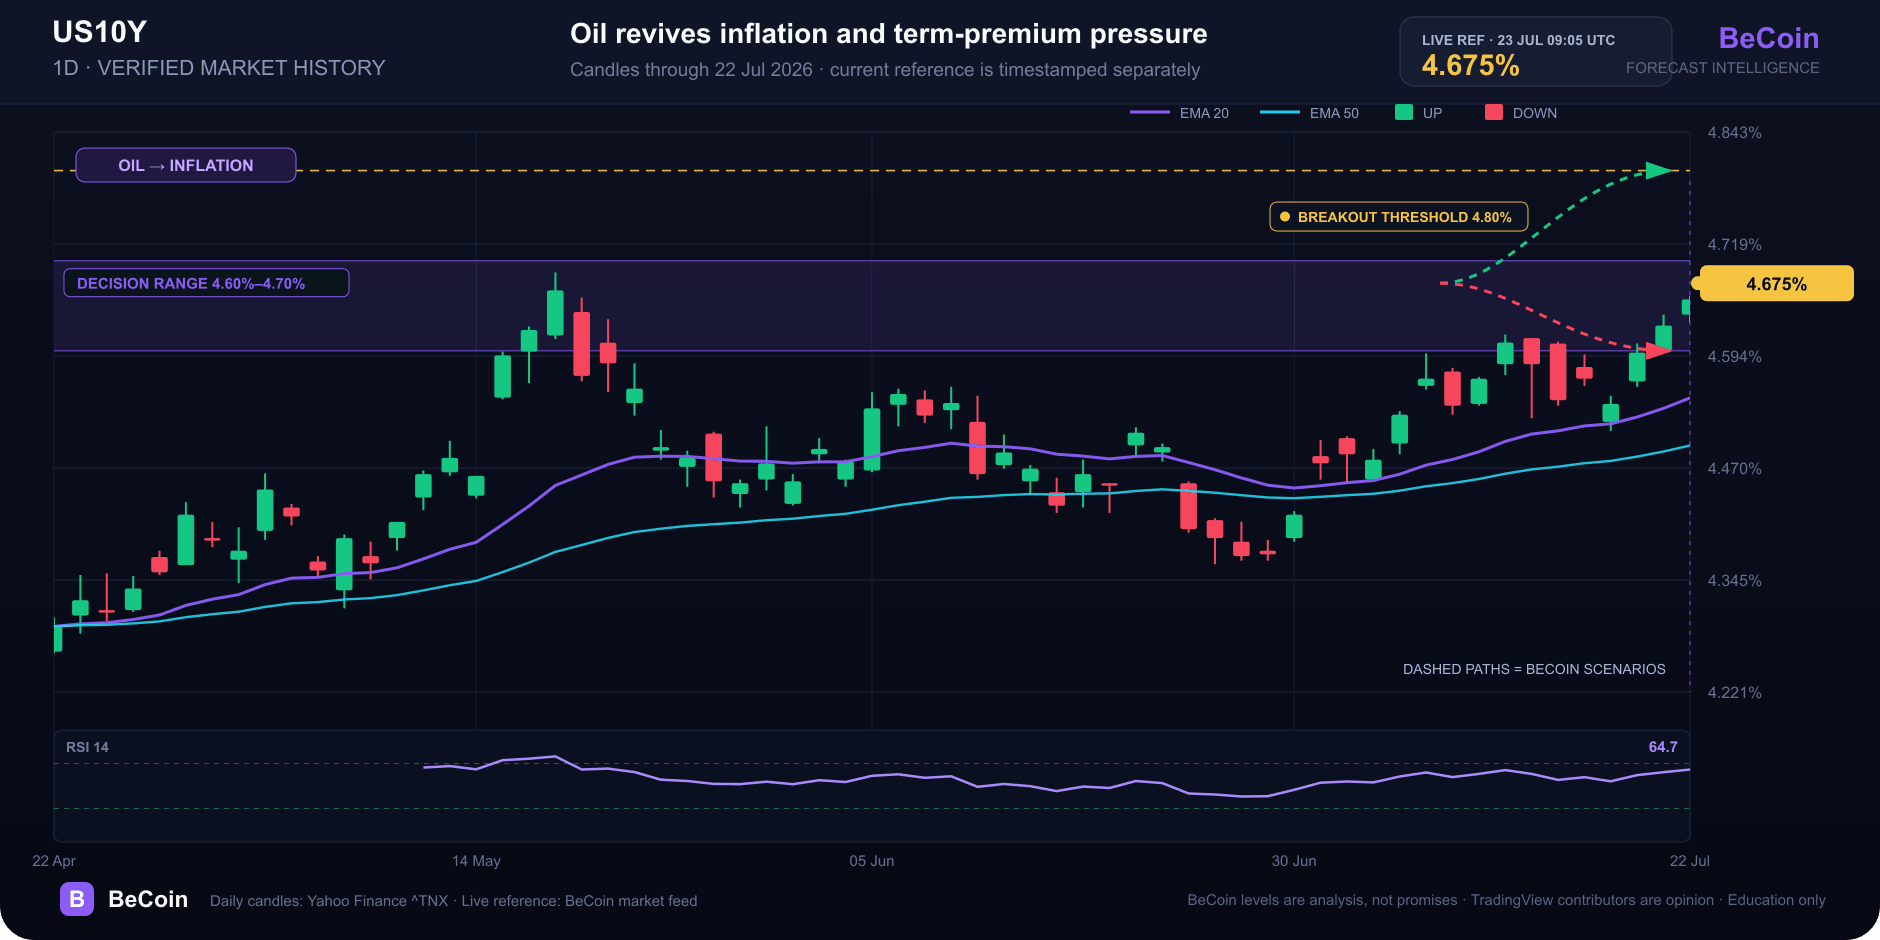
US 10-year yield reaches 4.675% as oil revives inflation pressure
The US 10-year yield reached 4.675% as oil prices rose and markets awaited labor data. What 4.70%, 4.80% and a reversal below 4.60% would mean.

Alphabet falls to $329.71 premarket as AI spending eclipses cloud growth
Alphabet traded near $329.71 premarket after strong Q2 revenue and cloud growth collided with a much larger AI spending plan. What investors need to watch.

Bitcoin slips to $65,741 as oil and yields test the breakout
Bitcoin is near $65,741 as rising oil and Treasury yields test the $65.7K breakout floor. Here are the levels that confirm or invalidate the move.