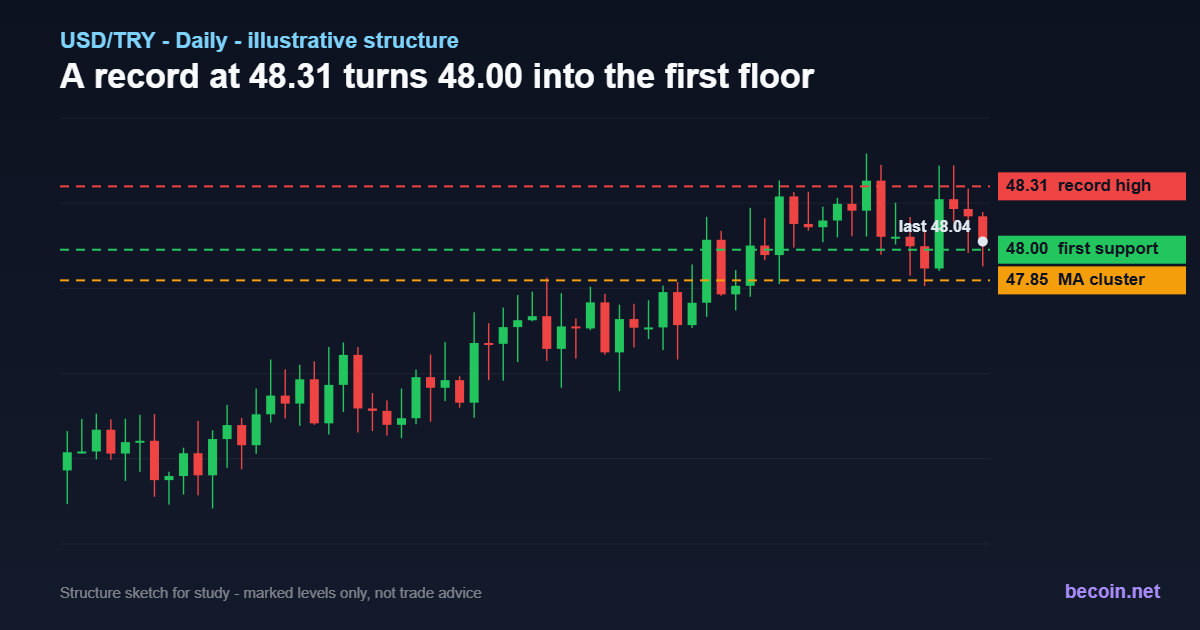
USD/TRY Forecast 2026: 48.50 Resistance and 48.00 Support
USD/TRY Forecast: 48.50 Is the New Ceiling as 48.00 Holds
The USD/TRY rate has entered September trading close to 48.30, leaving the pair only a short distance below the 48.50 area. The major change from the previous outlook is that the old 48.31 record is no longer the key ceiling.
Investing.com historical data show USD/TRY reaching an intraday high of 48.4982 on August 31, followed by another high of 48.3587 on September 1 and a September 2 close around 48.30.
That makes the 48.50 zone the more important reference point for traders now.
The price action remains remarkably controlled. Rather than producing a sharp breakout followed by a large reversal, USD/TRY has continued to grind higher in relatively small daily moves. That keeps the broader trend tilted toward further lira depreciation while reducing the usefulness of short-term countertrend signals.
For the next phase, the important question is simple:
Can USD/TRY establish itself above 48.50, or will the 48.00 area finally give way?
The USD/TRY level map
Three zones matter most heading into September.
48.50 — Major resistance
The 48.50 area is the immediate upside reference.
USD/TRY approached this level at the end of August, with Investing.com recording a high of 48.4982 on August 31.
A sustained break above 48.50 would put the pair into fresh territory and potentially open the way toward the psychological 49.00 level.
The important distinction is between an intraday spike and a confirmed breakout. A brief move above 48.50 would not necessarily change the trend by itself. A series of daily closes above the zone would provide a much stronger continuation signal.
48.00 — Key support
The 48.00 level remains the most important downside reference.
USD/TRY traded below 48.00 during parts of late August, but the pair subsequently recovered and moved back above the level. Historical data show the August 28 session reaching as low as roughly 47.91 before closing above 48.20.
That makes 48.00 more than a round number. It has become a useful dividing line between the current bullish USD/TRY structure and a potential short-term consolidation.
As long as USD/TRY remains above 48.00, the path of least resistance continues to favor higher levels.
47.80–47.90 — Secondary support
If 48.00 breaks decisively, the next area to watch would be the upper-47s.
This is where traders should look for evidence of whether a pullback is merely a correction or the beginning of a deeper change in trend.
A move into this zone would not automatically mean the Turkish lira has entered a sustainable recovery. The broader macro trend would still need to change before calling a major USD/TRY reversal.
USDTRY rate: where does the pair stand now?
The latest available September 2 data put USD/TRY around 48.30. Investing.com reported a September 2 close of approximately 48.30, with the session trading around a narrow 48.25–48.30 range.
Other market-data providers also place the pair around the same area. YCharts, using an ECB-sourced series, showed USD/TRY at approximately 48.29 on September 2.
That means the market is currently sitting almost exactly between the two major psychological levels:
48.00 support → 48.30 current area → 48.50 resistance
That relatively tight structure is what makes the next breakout important.
Turkey inflation remains the biggest macro variable
Turkey's latest inflation release provides a more nuanced picture.
Official August data showed consumer prices rising 1.84% month over month and 31.51% year over year, down from 31.75% in July.
The decline in annual inflation is encouraging for the disinflation story, but inflation remains extremely elevated.
The composition also matters. Annual inflation in August reached 33.79% for food and non-alcoholic beverages, while housing, water, electricity, gas and other fuels rose 39.77% year over year.
For USD/TRY, the key question is whether disinflation progresses quickly enough to strengthen confidence in the Turkish lira.
So far, the answer is not clear enough to challenge the pair's established upward trend.
CBRT policy keeps the carry trade alive
The Central Bank of the Republic of Türkiye has maintained its one-week repo policy rate at 37%. The latest official July decision also kept the overnight lending rate at 40% and the overnight borrowing rate at 35.5%.
The CBRT continues to describe monetary policy as tight and says the stance will be maintained until price stability is achieved.
That creates an important tension for USD/TRY.
High Turkish interest rates can support demand for lira assets and help the disinflation process. At the same time, persistent inflation and a steadily weakening currency can reduce the real attractiveness of the lira for investors who are exposed to exchange-rate risk.
This is why the pair can continue climbing even while Turkish interest rates remain very high.
The next CBRT decision could matter
The September Monetary Policy Committee meeting is scheduled for September 10, 2026.
That makes the meeting one of the most important near-term catalysts for USD/TRY.
A policy decision that reinforces confidence in the disinflation process could temporarily strengthen the lira and push USD/TRY below 48.00.
Conversely, a more cautious policy signal—particularly if policymakers highlight inflation, energy or geopolitical risks—could keep the pair supported.
The market will therefore be watching both the headline rate and the language surrounding future policy.
USDTRY Investing: what traders should watch
For anyone searching for USDTRY investing information, the most useful approach is to combine the live rate with the broader macro picture rather than looking at the exchange rate in isolation.
The current setup can be simplified into four levels:
| Level | Importance | Interpretation |
|---|---|---|
| 49.00 | Psychological resistance | Next upside objective |
| 48.50 | Major resistance | Breakout zone |
| 48.00 | Major support | Current trend divider |
| 47.80–47.90 | Secondary support | Deeper pullback zone |
The key is confirmation.
A break above 48.50 followed by acceptance above the level would strengthen the bullish USD/TRY scenario.
A break below 48.00 would instead suggest that the market is entering a consolidation phase.
USD/TRY forecast: three scenarios for September
Bullish scenario
USD/TRY holds above 48.00, breaks through 48.50 and begins trading comfortably above the former record area.
In this scenario, 49.00 becomes the next obvious psychological target.
The bullish case remains the base scenario while the pair continues making higher highs and holding above 48.00.
Neutral scenario
USD/TRY fails to clear 48.50 but also refuses to break below 48.00.
That would create a range between roughly 48.00 and 48.50.
Such a structure would make the next major breakout more important than individual intraday moves.
Bearish scenario
A daily close below 48.00 followed by a break of the 47.80–47.90 region would weaken the current bullish structure.
That would not automatically signal a long-term Turkish lira recovery, but it would indicate that USD/TRY's steady upward grind has lost momentum.
A sustained reversal would require more than technical weakness. Traders would want to see continued disinflation, credible monetary policy and improving confidence in the Turkish lira.
USD/TRY forecast 2026: what comes next?
The broader USD/TRY trend remains upward, but the pair is approaching an important technical decision point.
48.50 is now the level bulls need to conquer.
48.00 is the level bears need to break.
Between those two prices, the market is largely in a waiting game.
Becoin.net Tariff Plans for latest Forecast
The latest inflation data show annual CPI easing to 31.51%, while the CBRT continues to maintain a 37% policy rate and a restrictive policy stance.
That combination may help prevent an uncontrolled currency selloff, but it has not yet been enough to reverse the long-running USD/TRY trend.
For traders, therefore, the cleanest framework is to avoid predicting every small move and instead monitor the reaction around 48.00 and 48.50.
A confirmed break above 48.50 would shift attention toward 49.00.
A sustained break below 48.00 would put the bullish structure under pressure.
Until one of those levels gives way, the most likely setup is continued grinding price action with volatility increasing around major Turkish inflation and central-bank events.
This analysis is for educational purposes only and does not constitute investment advice. Forex trading involves substantial risk, and traders should conduct their own research before making financial decisions.

EUR/USD holds 1.1414 before the ECB decision: three scenarios
EUR/USD traded near 1.1414 before the ECB’s July decision. Here is what a hold, hawkish hold or surprise hike could mean for 1.1350 and 1.1480.

WTI reaches $89.43 as Brent clears $95 on renewed supply risk
WTI traded near $89.43 while Brent moved above $95 as Middle East shipping risk lifted crude for a fifth session. Key levels, catalysts and invalidation.

Bitcoin slips to $65,741 as oil and yields test the breakout
Bitcoin is near $65,741 as rising oil and Treasury yields test the $65.7K breakout floor. Here are the levels that confirm or invalidate the move.

How Liquidity Affects Day Trading Results
When I first started trading day trading, I believed success was all about finding the perfect indicator. I spent weeks testing moving averages, RSI settings, support and resistance levels, and dozens of YouTube strategies that promised easy wins. Some worked for a few trades, but most failed. What confused me was that the same setup […]

Best Trading Platform for Slow Internet in 2026
A slow internet connection can ruin trades faster than a bad strategy. Charts freeze, apps reload, and delayed execution creates unnecessary losses. This is especially common for traders using mobile data, shared WiFi, or older smartphones. Most broker reviews ignore this issue completely. After testing multiple platforms on weaker connections and low-end Android devices, some […]

Best Broker Without KYC (2026) — Truth + Risks Before You Choose
If you’re searching for the best broker without KYC, you likely want speed, low friction, and fast access to trading. But here’s the reality: Most traders don’t lose because of strategy.They lose because they choose the wrong platform early. No-KYC brokers can help you start quickly — but they also introduce hidden risks around withdrawals, […]