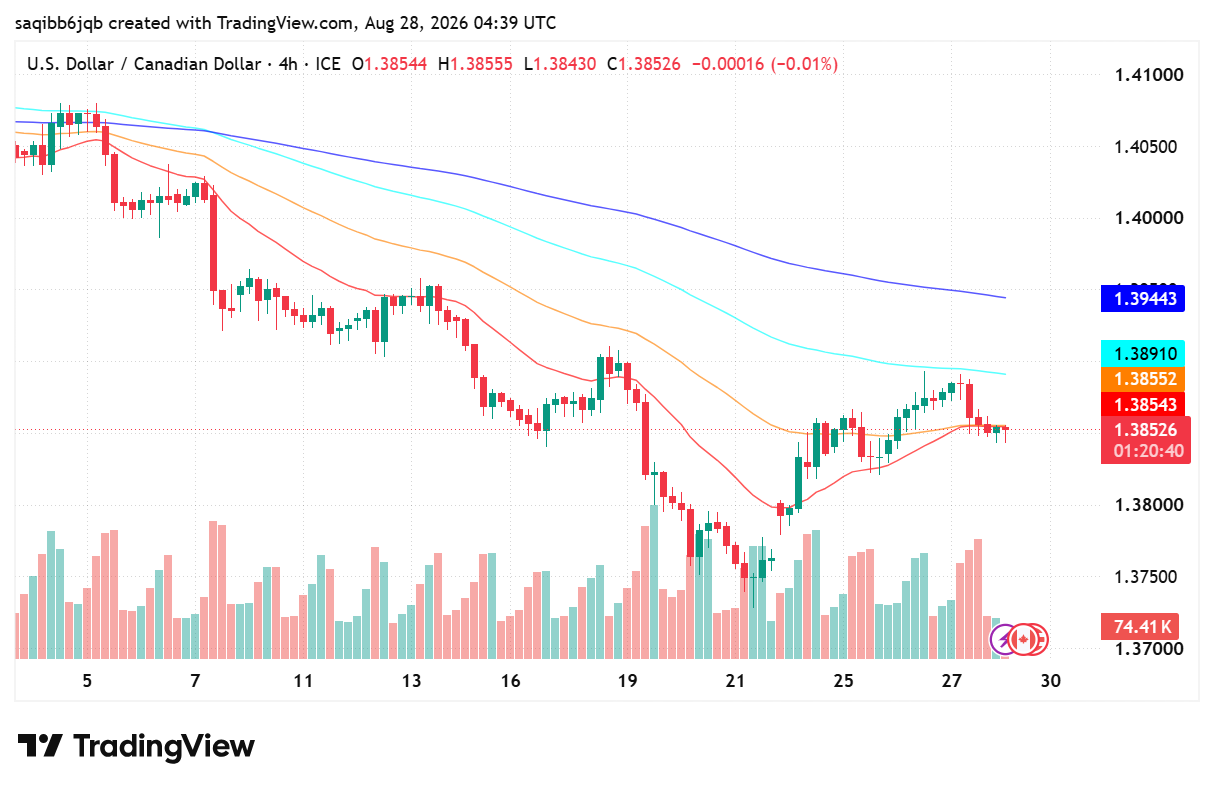
USD/CAD Forecast: 1.3850 Pinned Under a 1.38910 Average
- 1.3850, essentially unchanged on the day, after a rebound that stopped at 1.38878 on 27 August.
- Canadian headline inflation rose to 3% in July, but the core measures the central bank actually watches did not move.
- 1.38910 decides the next move; the bounce stalled one pip short of it.
Fundamental Analysis: USD/CAD
July's Canadian inflation report looked hot and was not. Headline CPI rose to 3.0% from 2.8%, driven almost entirely by energy, which was up 16.6% on the year with petrol roughly 26% higher. Strip that out and the picture is unchanged: CPI-trim came in at 1.9% and CPI-median at 2.0%, averaging exactly the target. The Bank of Canada has held at 2.25% for six consecutive meetings and meets again on 2 September with no obvious reason to move.
The counterweight is what that energy line is doing to the terms of trade. Crude is up around 30% on the year, and Canada is a net exporter of it — the same barrel that pushes Canadian headline inflation higher also improves the country's export receipts. That is a structural support for the loonie which does not depend on the central bank doing anything at all, and it goes some way to explaining why the dollar's yield advantage of roughly 150 basis points has not delivered more.
What the balance means is that this pair is currently a range instrument rather than a trend instrument. The Fed has the higher rate but faces its own September decision; the Bank of Canada has a credible reason to sit still; and the commodity channel quietly works against the dollar whenever crude firms. None of those forces is strong enough to break the other.
Technical Analysis: USD/CAD
August has been a one-way descent interrupted by one bounce. The decline ran from above 1.4090 at the start of the month to the 1.37460 low of 21 August; the recovery since peaked at 1.38878 on 27 August, which is one pip below the descending average at 1.38910. Price has slipped back to sit almost exactly on the two averages at 1.38552 and 1.38543, which have converged into a single line.
Resistance is 1.38910 first, then the slower average at 1.39443 and the 1.4000 handle beyond. Support is the 1.38000 round number, then 1.37460. A four-hour close above 1.38910 would be the first genuine sign the August downtrend has ended; failure to hold 1.37460 confirms it has not.

Trading Currency Strength Instead of Single Pairs
It was a Tuesday afternoon when I realized I was fighting a losing battle against a ghost. My screen was a chaotic web of indicators. I had the EUR/USD chart open, a moving average crossing over here, a relative strength index flashing oversold there, and a price action setup that looked textbook perfect. I clicked […]

The Clock and the Cash: My Journey into the Hidden Rhythm of Session-Based Trading
There was a time when I thought the global financial market was a single, monstrous wave that never stopped moving. I believed that if I sat in front of my monitors long enough, clicking buttons whenever a pretty pattern appeared on my charts, the market would eventually reward my sheer endurance. I was dead wrong. […]

EUR/USD holds 1.1414 before the ECB decision: three scenarios
EUR/USD traded near 1.1414 before the ECB’s July decision. Here is what a hold, hawkish hold or surprise hike could mean for 1.1350 and 1.1480.

The Clock and the Candle: How I Stopped Guessing the Best Time to Trade Day Trading
I still remember the night I blew my third trading account. It was 11:30 PM. The house was completely quiet, the market charts on my screen were barely crawling, and I was forcing trades out of pure impatience. I kept staring at a flatline asset, placing one-minute positions, convinced that the market owed me a […]

The Day I Stopped Trading and Finally Started Making Money
It was a rainy Tuesday morning, and I was staring at my screen with a familiar knot in my stomach. The previous three days had been a slow, agonizing slide into the red. I had given back two weeks of hard-earned profits in less than seventy-two hours. Every asset I clicked on looked like a […]

Which Broker Is Better for Weekend Trading?
It was a chilly Saturday morning, and while the rest of the world was sleeping in or catching up on shows, I was staring at a completely frozen screen. My usual EUR/USD chart looked like a heart monitor flatlining. The traditional markets were closed. The banks were shut down. For a long time, that was […]