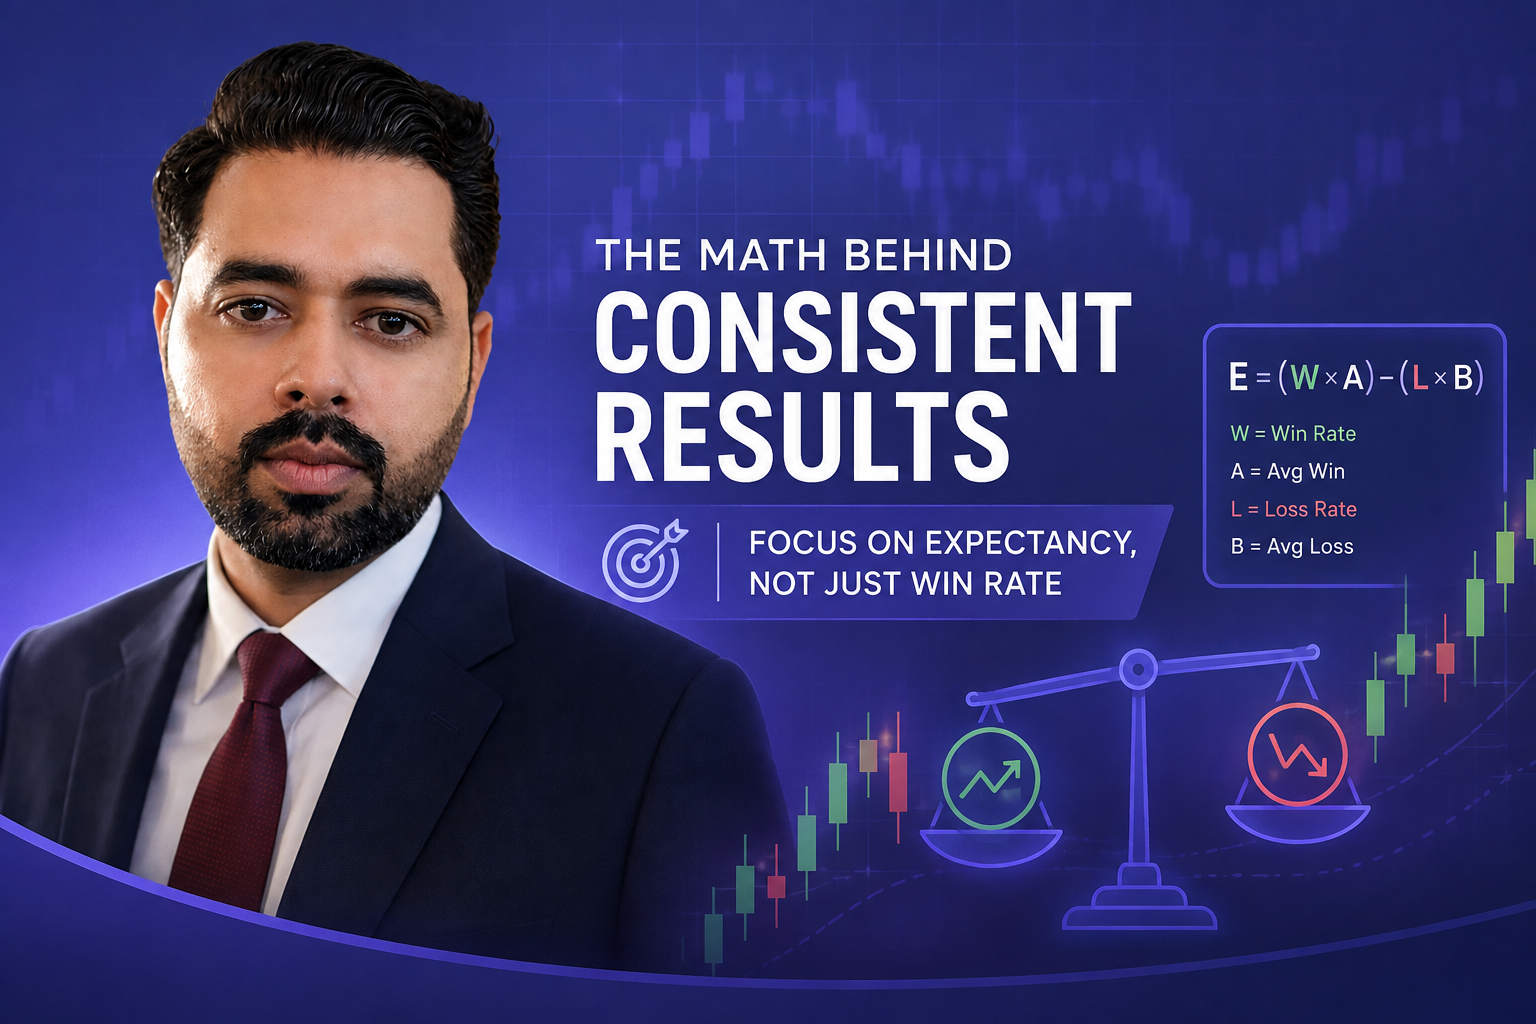
Understanding Expectancy in Binary Trading
I still remember the exact night my trading perspective changed forever. It was 2:15 AM, and my computer monitor was casting a cold blue glow across my desk. I had just closed my seventh consecutive loss on a series of fast-paced 60-second binary contracts. My account balance was down to a fraction of what it had been at the start of the week.
Like most traders starting out, I was convinced that my problem was finding better indicators. I spent months tweaking Relative Strength Index levels, testing Fibonacci retracements, and hunting for exotic candlestick patterns. Yet, despite occasionally hitting a string of four or five winning trades in a row, my account equity kept slowly leaking away.
It was during a late-night deep dive into probability theory that I stumbled across a single concept that made everything click. I was not losing because my strategy was completely broken. I was losing because I had no understanding of mathematical expectancy.
Once I calculated my true expected value per trade, I realized I had been playing a game where the mathematical odds were rigged against me from the start. Here is how understanding expectancy saved my trading career, how the math actually works in day trading, and how you can structure your trades to build a long term statistical edge.
What Is Mathematical Expectancy (And Why Win Rate Is a Vanity Metric)
When I first entered the trading world, I was obsessed with my win rate. I thought that if I could win 60% or 70% of my trades, wealth would naturally follow. What I failed to grasp is that in trading, win rate is only half of the equation.
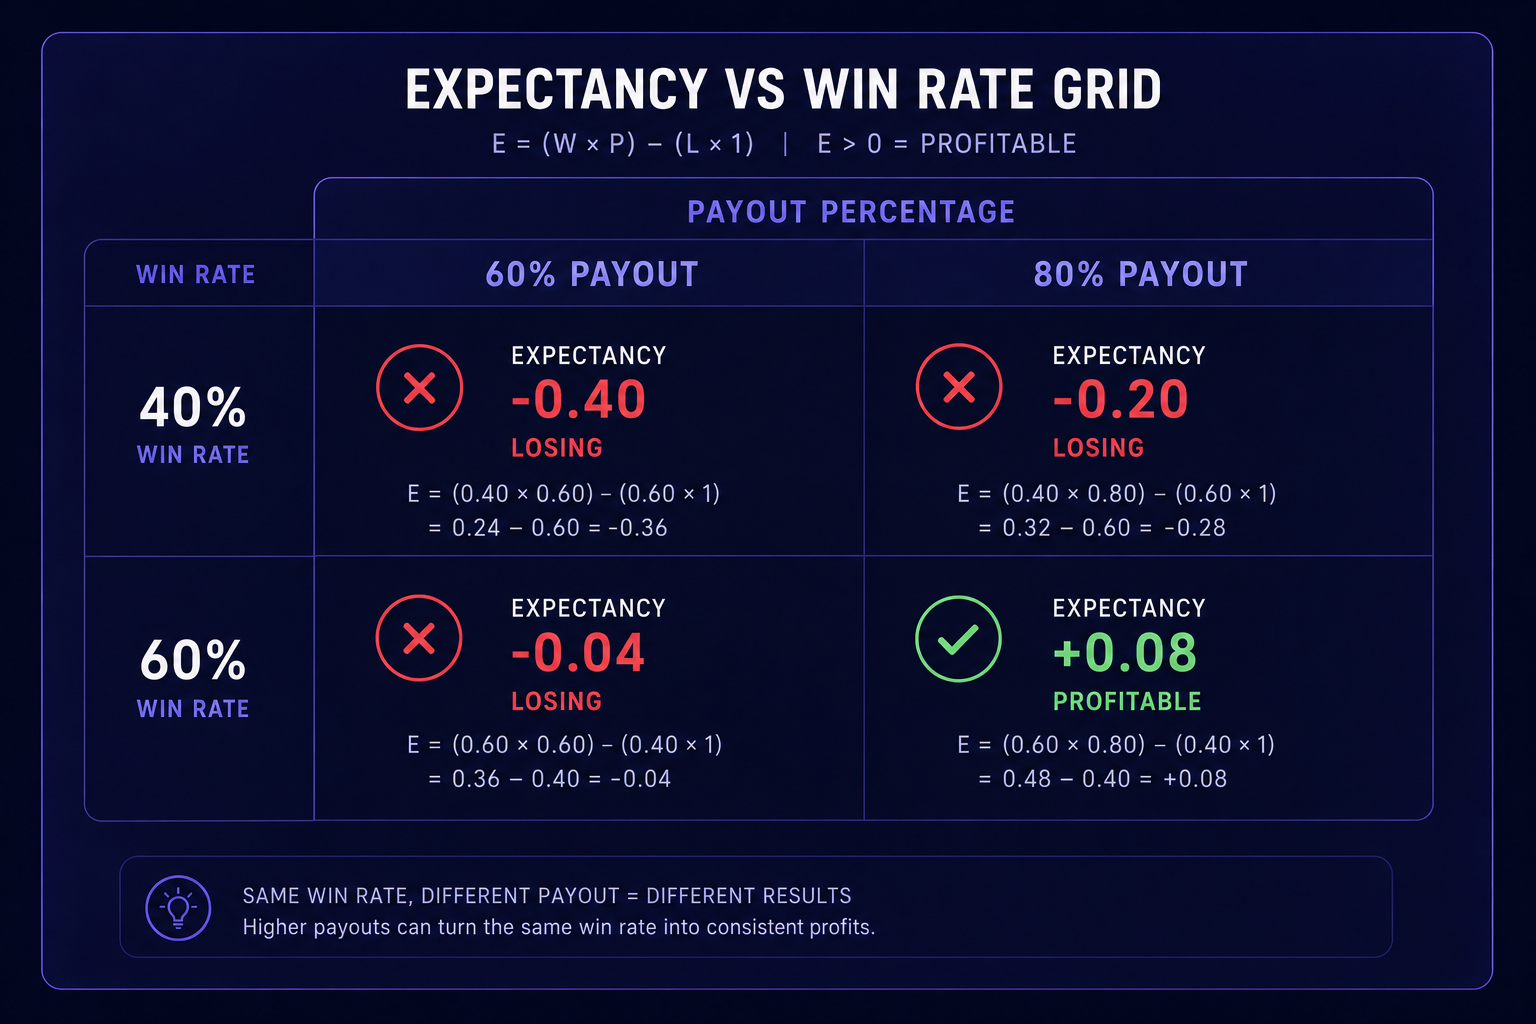
Mathematical expectancy tells you the average amount of money you can expect to win or lose per dollar risked over a large sample of trades. It combines your win rate with your risk-to-reward ratio or payout structure.
In traditional spot Forex or stock trading, you can adjust your risk-to-reward ratio by extending your take-profit target and tightening your stop-loss. In binary trading, however, the structure is fixed. You risk 100% of your stake on every trade to make a predetermined payout percentage, usually ranging between 70% and 92%.
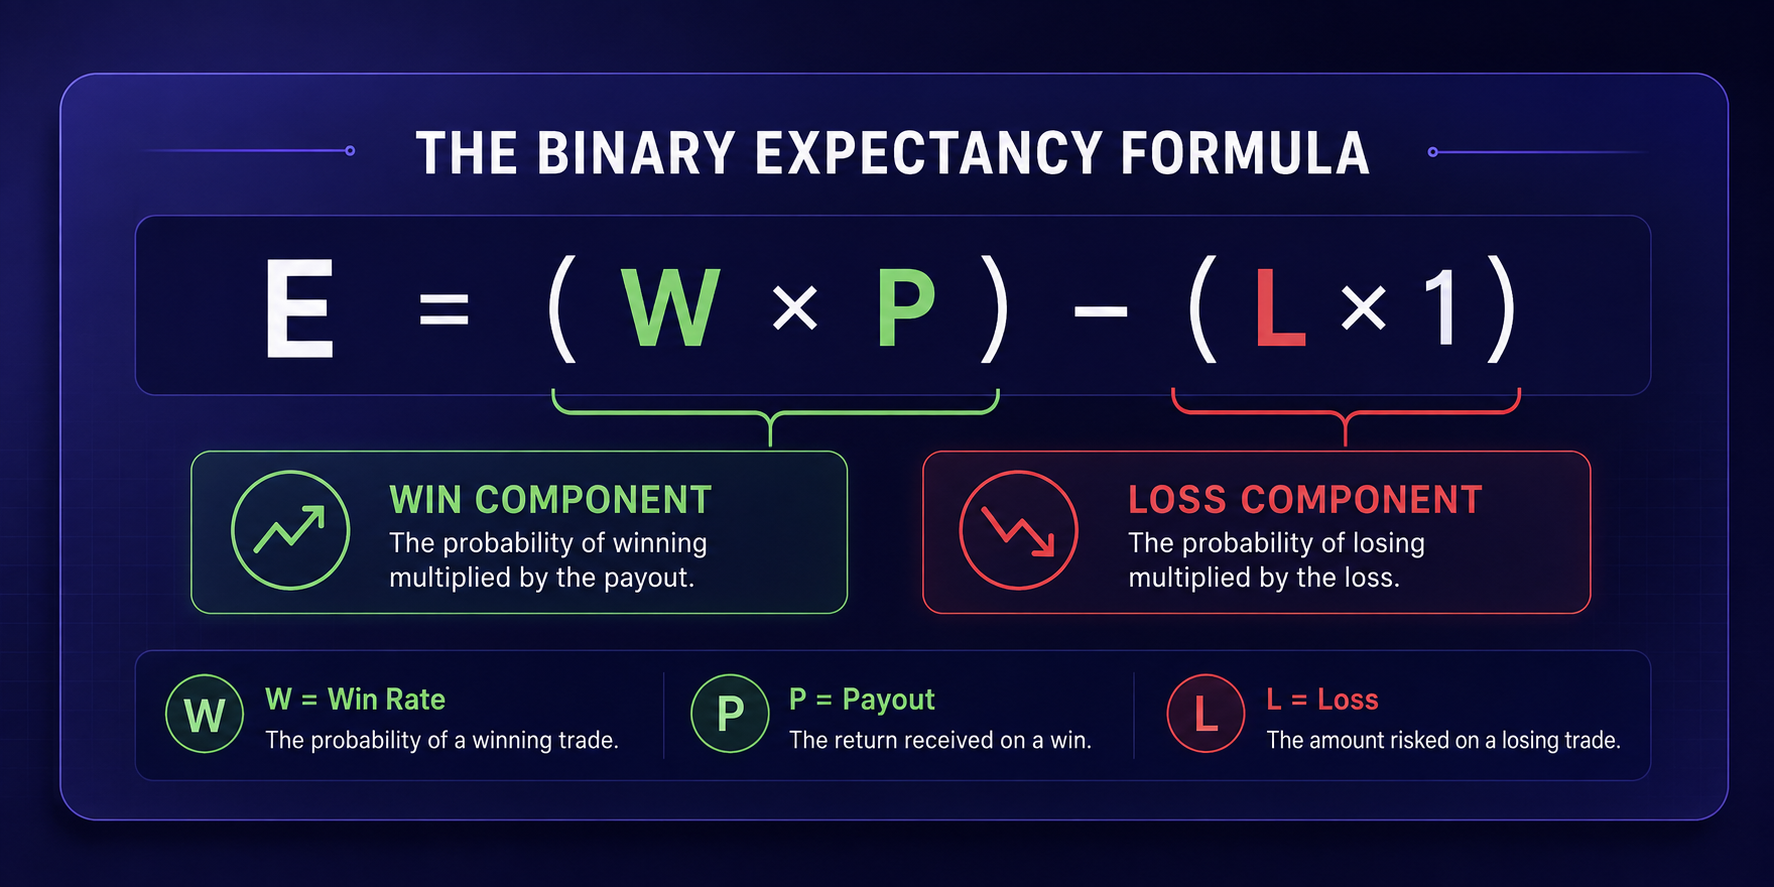
To calculate your mathematical expectancy (E) in binary trading, you use this equation:
E=(WP)-(LC)
Where:
- W is your Win Rate expressed as a decimal (e.g., 0.55 for 55%).
- P is the Broker Payout percentage as a decimal (e.g., 0.80 for an 80% payout).
- L is your Loss Rate as a decimal (1-W).
- C is the cost or amount lost per trade, which in binary contracts is always 1.0 (100% of your investment).
Let us walk through a real scenario from my early trading journal. I was running a strategy that achieved a decent 55% win rate. I felt proud of that number because winning more than half the time felt like a victory. But my broker at the time was paying out 70% on the asset pair I was trading.
Let us plug those numbers into the expectancy formula:
E=(0.550.70)-(0.451.0)
E=0.385-0.45=-0.065
Every single time I clicked a button and placed a $100 trade, I was mathematically expected to lose $6.50 over time. Even with a 55% win rate, my strategy was guaranteed to bleed my account dry. That realization felt like getting splashed with ice water.
The Hidden Asymmetry of Day Trading Payouts
The core challenge of day trading lies in its negative asymmetry. When you lose, you lose 100% of your stake. When you win, you only receive your stake back plus a payout that is almost always less than 100%.
Because of this asymmetry, a 50% win rate, which represents pure random chance like flipping a coin, results in a heavy financial loss over time.
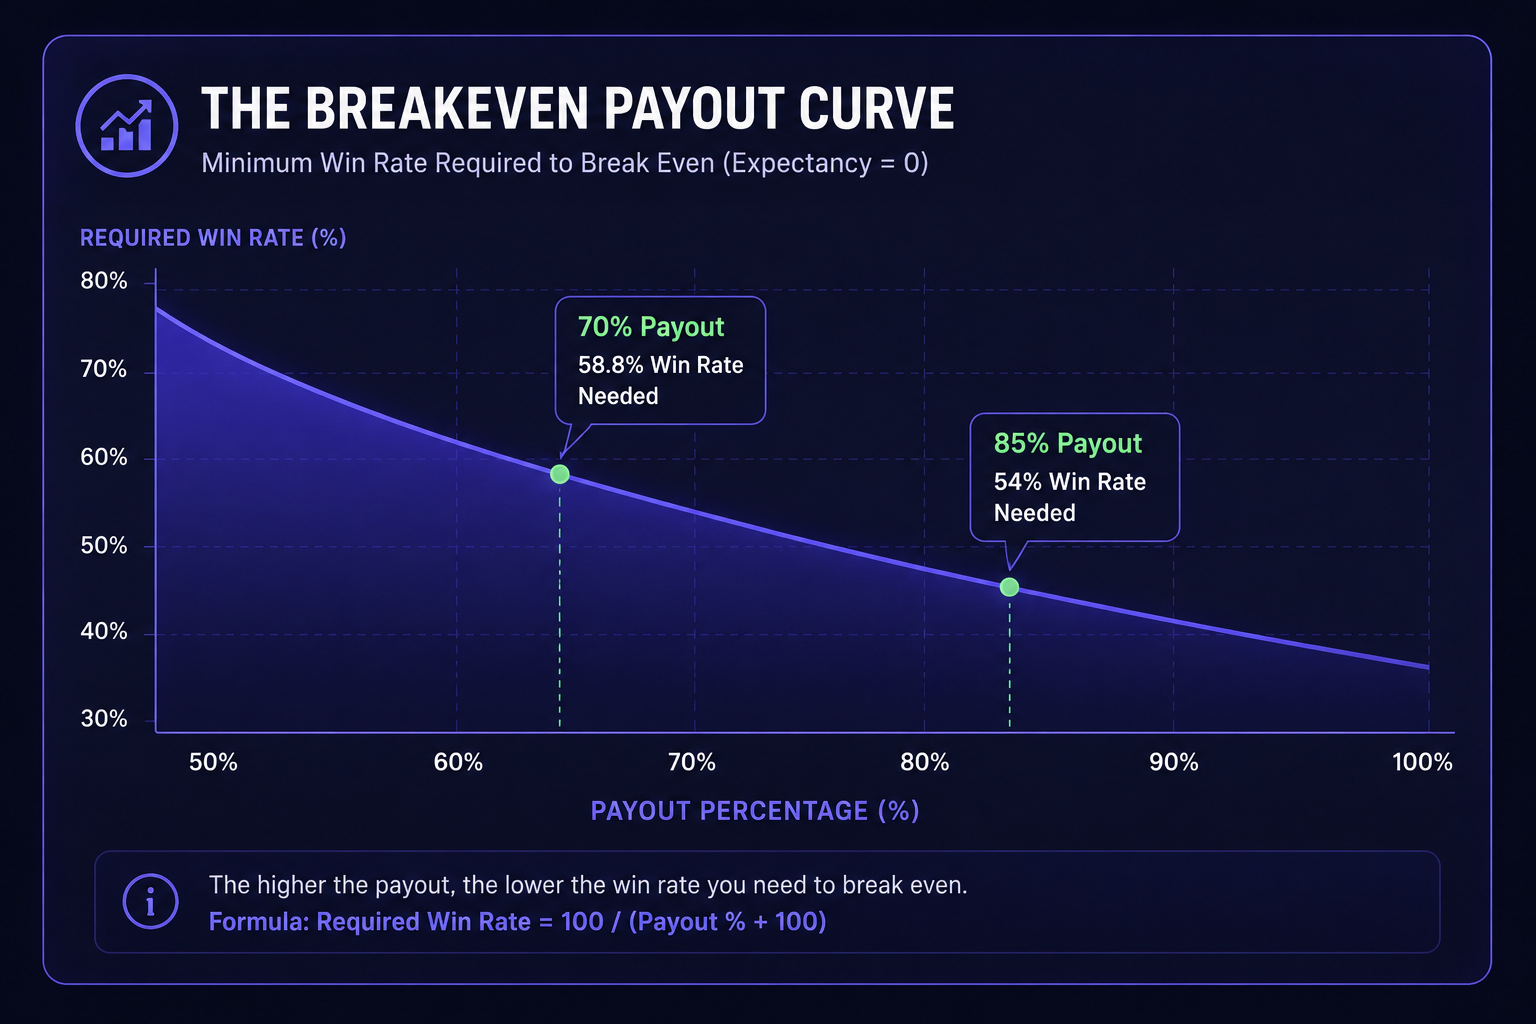
To see where you break even, you must calculate your required minimum win rate (Wbreakeven) based on your broker payout (P):
Wbreakeven=11+P
Let us compare how different payout percentages alter your required win rate:
- At a 70% payout (P=0.70): You need a 58.8% win rate just to break even.
- At an 80% payout (P=0.80): You need a 55.5% win rate to break even.
- At a 90% payout (P=0.90): You need a 52.6% win rate to break even.
This math revealed why selecting the right trading platform and execution environment is just as vital as reading price charts. If you are trading on low-payout assets, you are forcing yourself to maintain an abnormally high win rate just to stand still.
When I overhauled my process, I began evaluating platforms strictly based on their payout consistency and execution speed. Platforms like IQ Option offer competitive payout rates on major currency pairs during high-volatility trading sessions. Similarly, modern platforms like Pocket Option and Quotex provide clear real-time payout percentages so you can filter out low-yielding pairs before taking a position.
For traders looking for alternative contract structures and asset choices, exploring established brokers such as Deriv,ExpertOption,Olymp Trade, or Capital Core can help you find execution parameters that suit your individual style.
How I Flipped My Expectancy from Negative to Positive
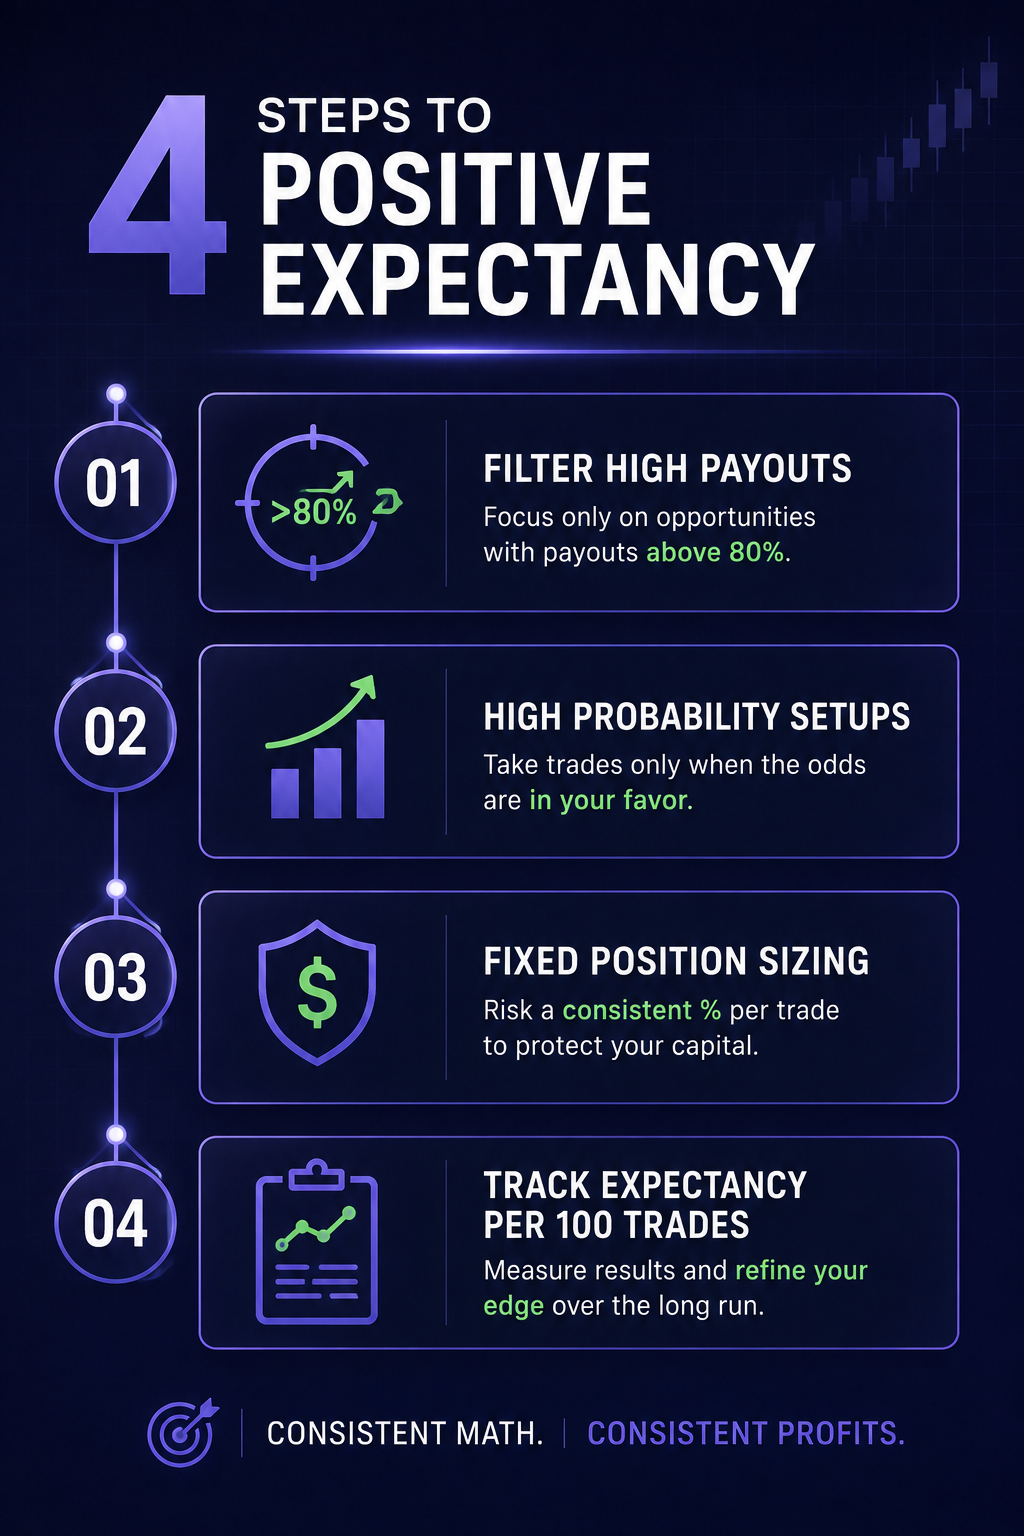
Once I understood the cold mathematical reality, I completely changed how I traded. I stopped trying to predict every minor market twitch and focused entirely on shifting my expected value into positive territory. Here are the four steps I implemented.
1. Enforcing a Strict Payout Threshold
I made a firm rule: I never trade an asset with a payout below 82%.
By setting an 82% payout floor, my break-even win rate dropped to 54.9%. Any trade taken below that payout threshold simply did not offer enough return to justify the risk. If the market quieted down and payouts dropped to 70% or 75%, I closed my charts and walked away.
2. High-Probability Setup Filtering
Instead of taking 20 to 30 impulsive trades a day, I narrowed my focus to high-confluence setups. I combined key horizontal support and resistance levels with volume momentum signals.
I began reading educational breakdowns and market structure lessons on the Becoin Blog guides to refine my technical analysis. By reducing my trade volume and taking only premium technical setups, my win rate rose from 55% to a stable 62%.
Let us re-calculate my expectancy with a 62% win rate and an average 85% payout:
E=(0.620.85)-(0.381.0)
E=0.527-0.38=+0.147
Suddenly, my expected value was positive $0.147 per dollar traded. On a 100contractsize,mylong-termexpectedreturnbecame+14.70 per trade. The mathematical wind was finally at my back.
3. Fixed Position Sizing and Eliminating Martingale
In my early days, after a loss, I would double my stake on the next trade to win back my capital. This is the classic Martingale system, and it is an expectancy killer.
A single bad streak destroys your capital faster than positive expectancy can rebuild it. I switched to a strict fixed-risk model, risking no more than 2% of my account per trade. This allowed my statistical edge to play out over hundreds of trades without risking a catastrophic drawdown.
4. Evaluating Results in Batches of 100
One trade means nothing. Five trades mean nothing. In probability theory, sample size is everything.
I stopped judging my success based on whether my last trade won or lost. Instead, I tracked my trades in blocks of 100. If my math held up across 100 trades, I knew my edge was real.
The Psychological Trap: Overcoming the Impulse to "Win It Back"
Understanding the math on paper is one thing; sticking to it during live market volatility is another story. The biggest enemy of positive expectancy is emotional trading.
When you lose three trades in a row, your brain interprets it as a problem that needs immediate fixing. The impulse to jump into a low-payout asset or trade against a strong trend kicks in.
I overcame this by treating my trading like a casino treats blackjack. A casino does not panic when a player hits a winning hand or wins five hands in a row. Why? Because the house knows the mathematical expectancy favors them over thousands of hands.
When you establish a positive expectancy framework, you become the house. Individual losses are simply the cost of doing business.
To build this level of discipline, it helps to review detailed market insights and educational resources regularly. Expanding your knowledge through the Becoin Blog educational center helps reinforce systematic, strategy-led thinking over emotional reactions.
Turning Math into Execution: Gaining Your Ultimate Market Edge
Mastering binary trading does not require predicting the future. It requires understanding probability, managing risk asymmetry, and sticking to a mathematically proven plan.
When you pair a strict payout filter with high-confluence chart analysis, day trading transform from a high-risk gamble into a structured, probability-based business.
If you are ready to stop guessing and start trading with precision, having access to institutional-level analysis and high-probability market forecasts makes all the difference. You can upgrade your approach by joining Becoin Premium to gain access to in-depth technical breakdowns and elite trading setups designed to help you maintain a true competitive edge.
To complement your daily market prep, explore real-time market outlooks and projections at the Becoin Forecast Hub. Aligning your trades with structured math and expert market insight is how you turn negative expectancy into lasting consistency.

How Understanding Market Structure Saved My Day Trading
I remember the exact moment my trading account hit zero for the third time in a single month. It was a rainy Tuesday evening, and I was staring at a 1-minute chart on my laptop screen. The price had been moving up aggressively. It looked like a flawless rocket ship to the moon. I clicked […]

Binomo Verification (KYC) for First Withdrawal: Exact Documents That Usually Trigger Rejection
The first time I tried to withdraw from Binomo, I was not worried about the trade. I was worried about the paperwork. That probably sounds strange if you are new. Most traders obsess over entries, expiry times, payout percentages, and strategy screenshots. I did too. But the moment I clicked my first withdrawal request, the […]
Capital Core Withdrawal Test: How Long Does It Really Take to Get Paid?
If you are thinking about using Capital Core, ignore the flashy payout claims for a minute. The only thing that really matters is whether the broker pays you when you request a withdrawal. That was the exact reason I decided to test it for myself. I wasn’t interested in another recycled broker review built around […]

Finding the Best Trading Broker for Side Income: My Raw, First-Hand Journey to Consistent Daily Wins
Six months ago, I sat at my kitchen table staring at an accumulation of household bills, realizing my primary salary was no longer cutting it. I didn’t want a second job that required clocking into a physical location or taking endless boss mandates after hours. I needed a flexible, scalable side income. That night, I […]

The Day I Lost My First Ten Dollars: My Hunt for the Best Mobile Trading App for Beginners
I still remember the exact shape of the cloud outside my window when my first live trade ended in the red. It was a crisp morning, and I was sitting on my couch with a lukewarm cup of coffee, staring at a flashing line on my smartphone screen. I had just deposited ten bucks, convinced […]